Create a custom bar chart of amino acid content for a list of foods
Contributed by:
Gay Wilson and Jeff Bryant
Examples
Basic Examples (1)
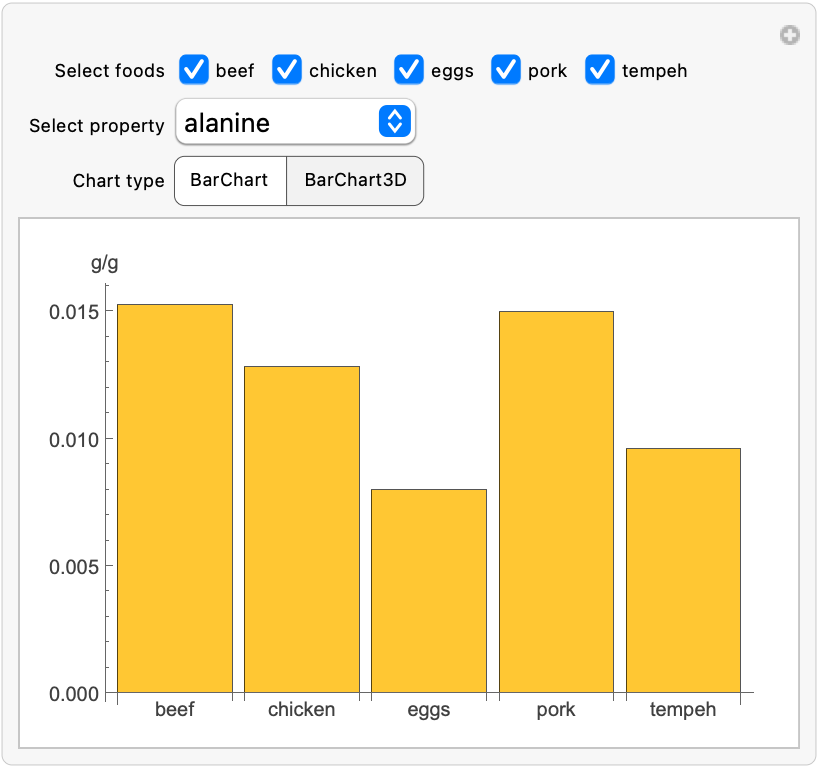
Compare the amounts of amino acids in these high-protein foods. Choose from 20 amino acids in the dropdown list:
Scope (2)
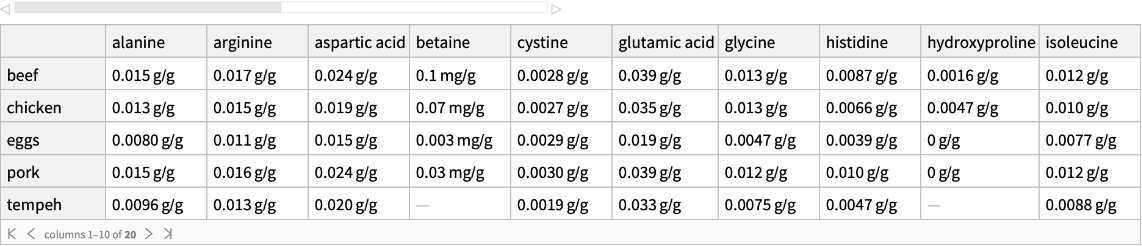
Display the amino acids data as a Dataset:
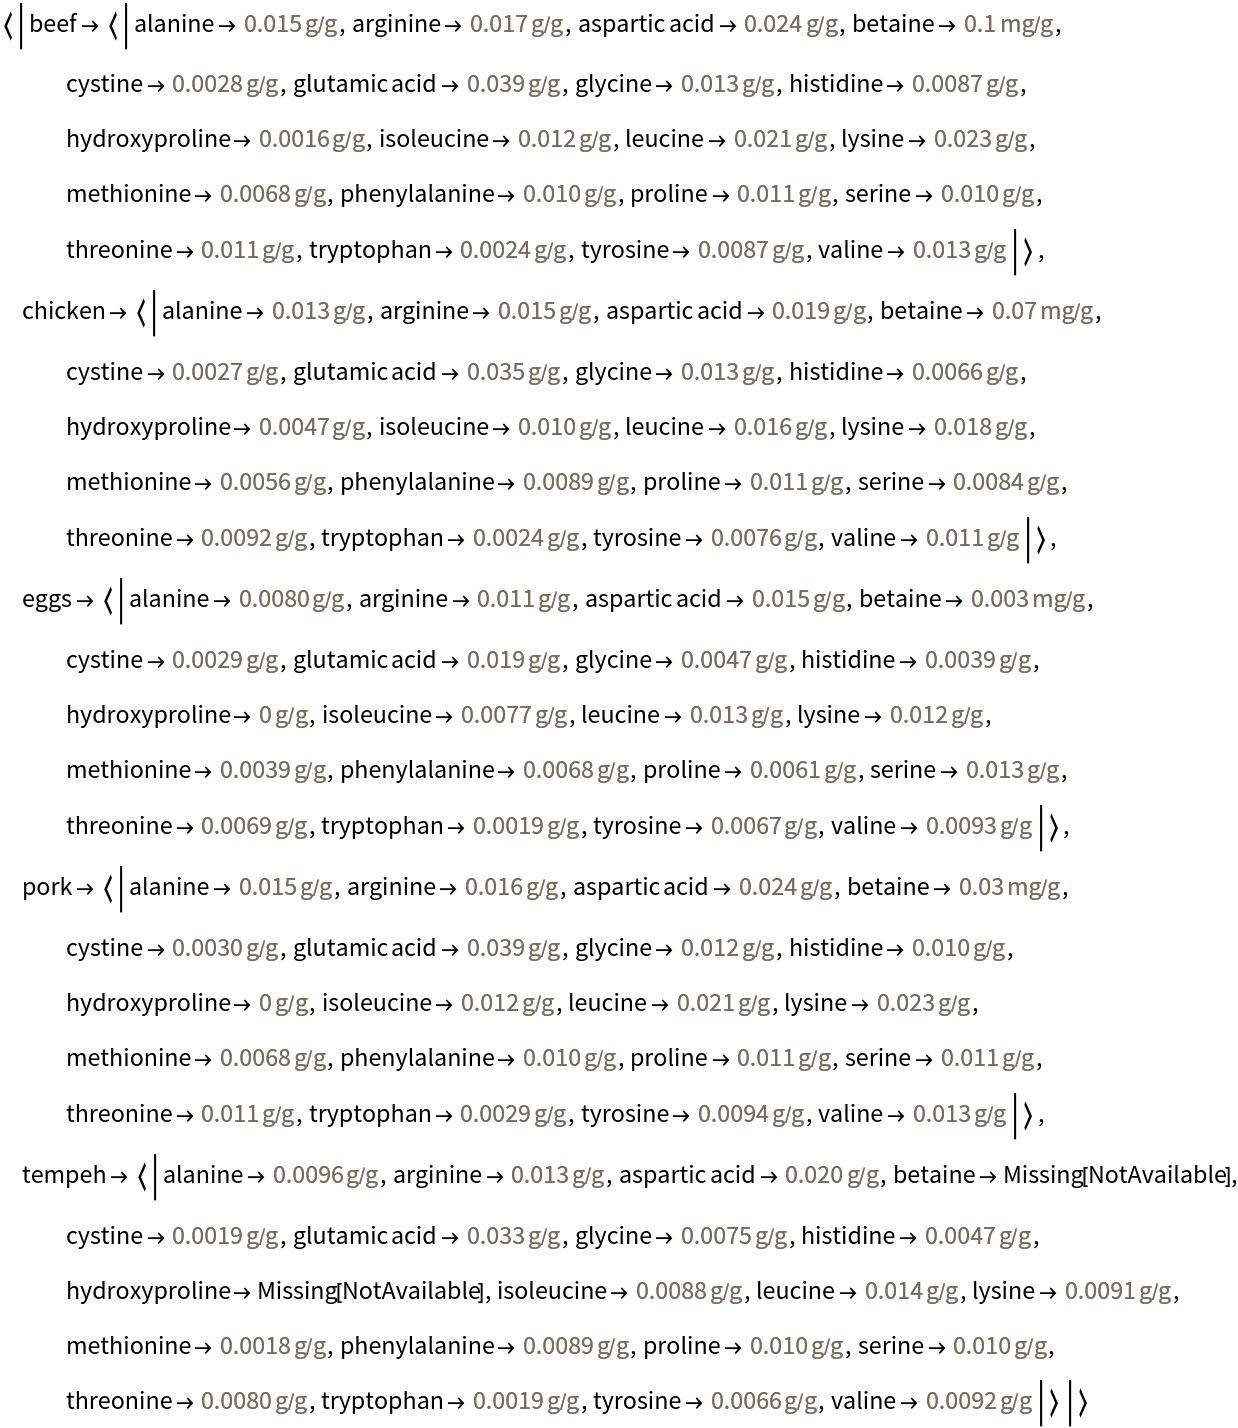
Display the data as associations:
Options (2)
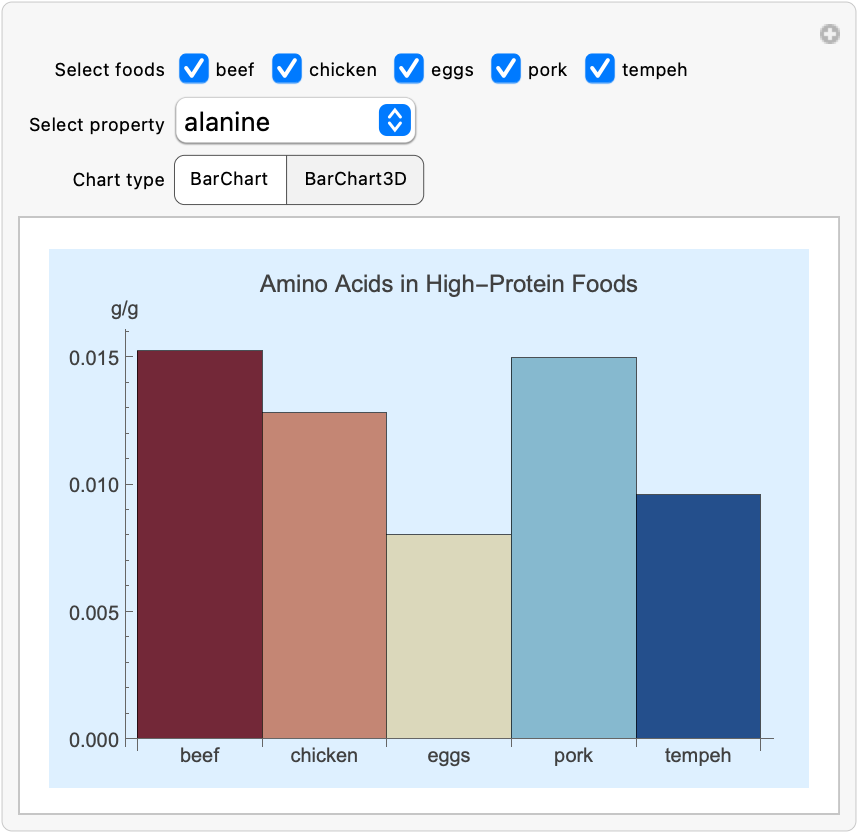
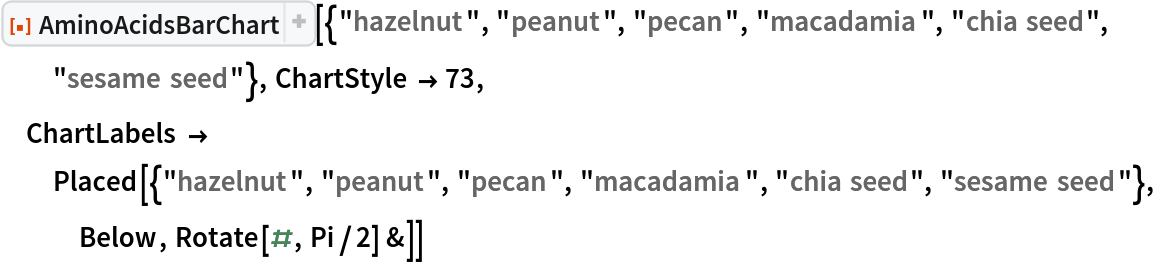
Use options to customize the appearance of the chart:
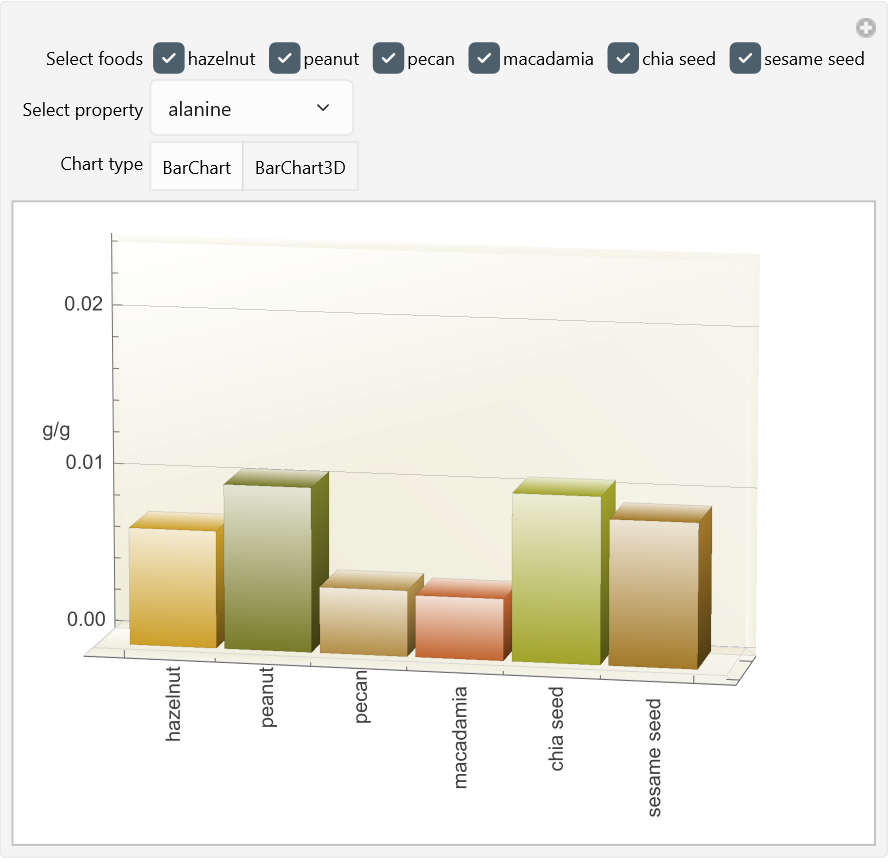
Select the BarChart3D chart type for a different perspective when comparing these nuts and seeds:
Neat Examples (2)
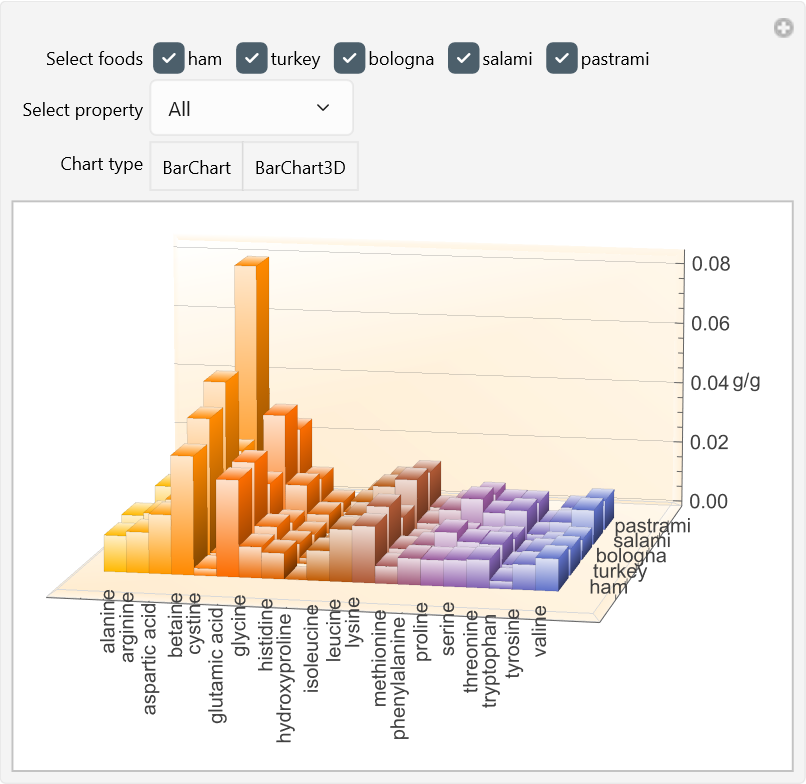
Select All in the dropdown list for an interactive 3D chart of the amino acids in these deli meats:
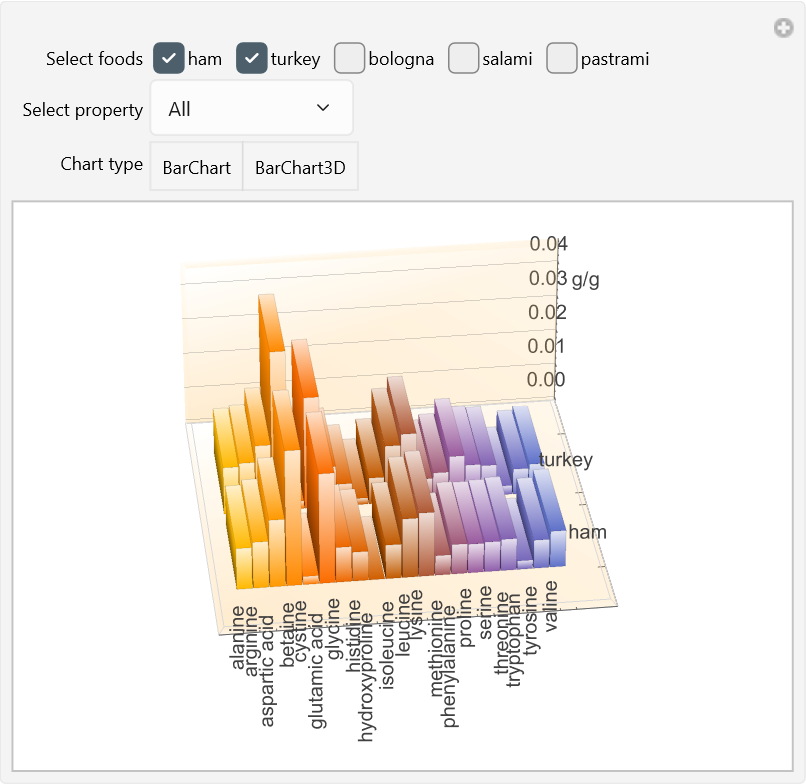
Deselect foods to examine a smaller set of data, then reselect those foods to restore their data to the chart. Rotate the chart for different views:
Requirements
Wolfram Language 13.0
(December 2021) or above
Version History
-
1.2.1
– 02 November 2026
-
1.2.0
– 01 May 2026
-
1.1.0
– 15 May 2024
-
1.0.0
– 22 March 2024
Related Resources