Function Repository Resource:

Kurvendiskussion

Source Notebook

Get a dynamic plot of a univariate function along with supplemental information

Contributed by: Wolfram|Alpha Math Team

ResourceFunction["Kurvendiskussion"][expr,x]

returns a dynamic plot of expr, viewed as a function of x, allowing the additional display of related points and functions of interest.

Details and Options

In the German language, a Kurvendiskussion of a univariate function consists of a plot along with supplemental information about the function.
ResourceFunction["Kurvendiskussion"] returns a framed Panel expression containing dynamic elements.
Besides the function itself, ResourceFunction["Kurvendiskussion"] allows the user to select among expr’s roots, extrema, stationary points, inflection points, discontinuities, limits at infinity, asymptotes, integral and derivative to plot as well. Some selections may be unavailable when not applicable (e.g. the discontinuties checkbox will be missing for a continuous function).
Symbolic formulas for the additional data on the function can be viewed by clicking the "Properties" Opener.
Mousing over points on the plot will display additional information, as determined by selection under the "Plot style" Opener.
Gridlines can optionally be plotted, and the plot stye can be toggled between light and dark backgrounds.
ResourceFunction["Kurvendiskussion"] tries to automatically pick a suitable plot range to use. This plot range may depend on which dynamic elements are selected.

Examples

Basic Examples (2) 

Plot a Kurvendiskussion for a trigonometric function:

In[1]:=
ResourceFunction["Kurvendiskussion"][Sin[x], x]
Out[1]=

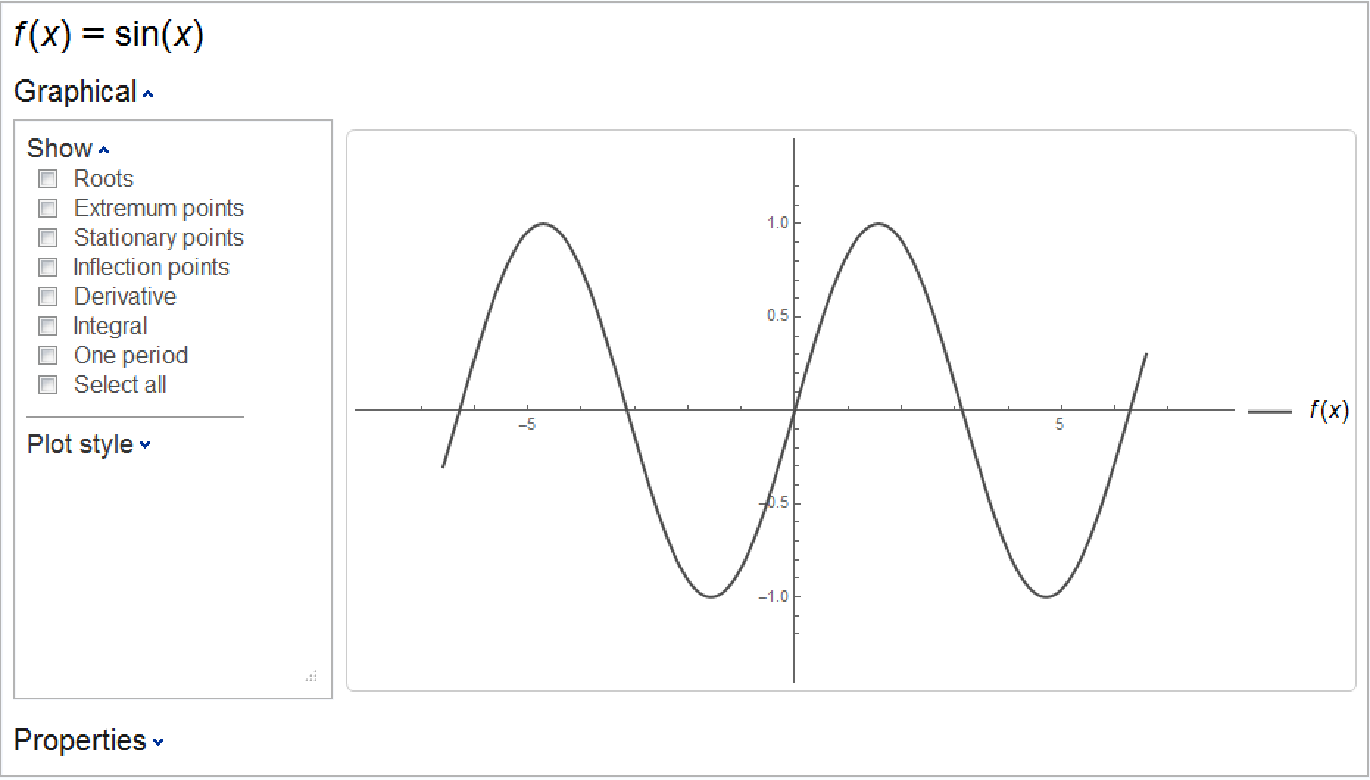
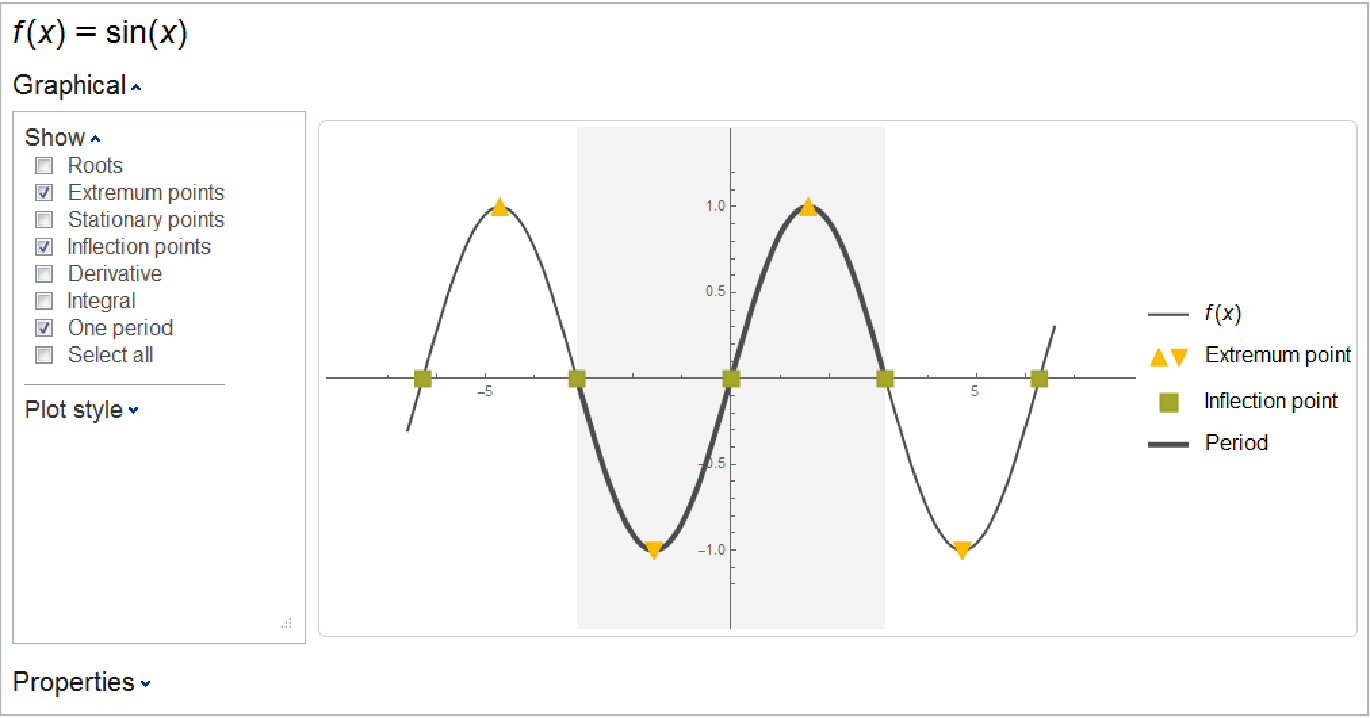
Select some additional elements to display:

Scope (6) 

Plot a Gaussian function along with its extremum:

In[2]:=
func = 3 Exp[-(x + 2)^2/2];
ResourceFunction["Kurvendiskussion"][func, x]
Out[2]=

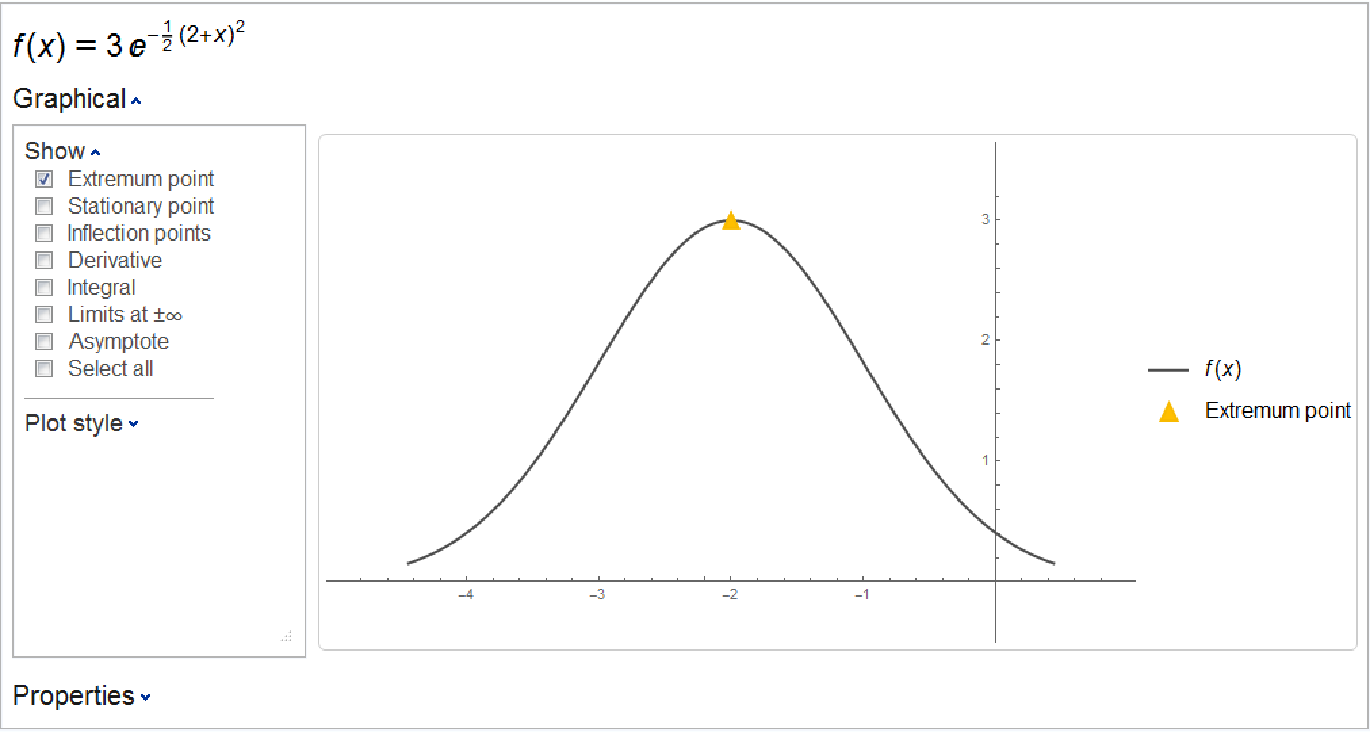
Plot a function along with its roots and inflection points:

In[3]:=
func = x + Sin[x] + 3/2;
ResourceFunction["Kurvendiskussion"][func, x]
Out[3]=

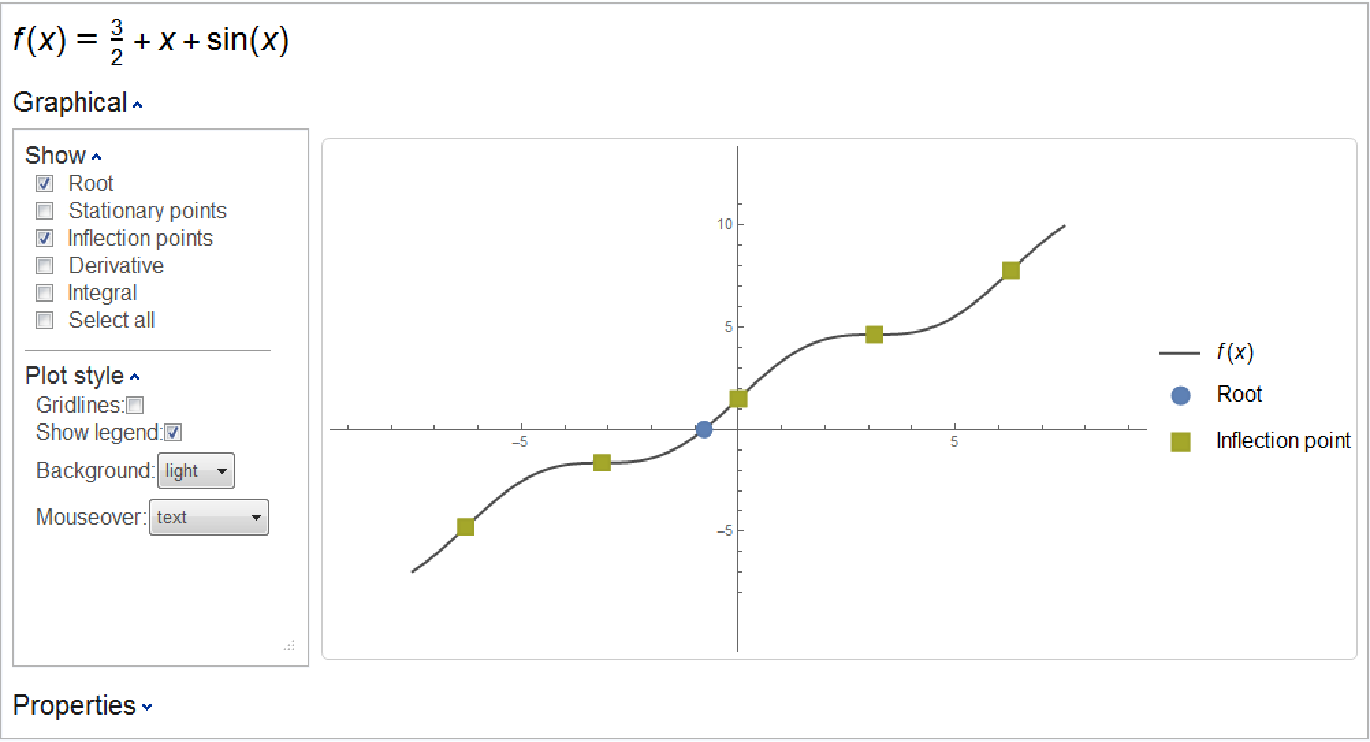
The plotted inflection points are the same as those returned by the resource function InflectionPoints:

In[4]:=
ResourceFunction["InflectionPoints"][func, x]
Out[4]=

Plot a rational function along with its stationary points, also showing Gridlines:

In[5]:=
func = (37 x^5 + 2 x^2 + 3 x + 4)/(x^2 - x - 1);
ResourceFunction["Kurvendiskussion"][func, x]
Out[5]=

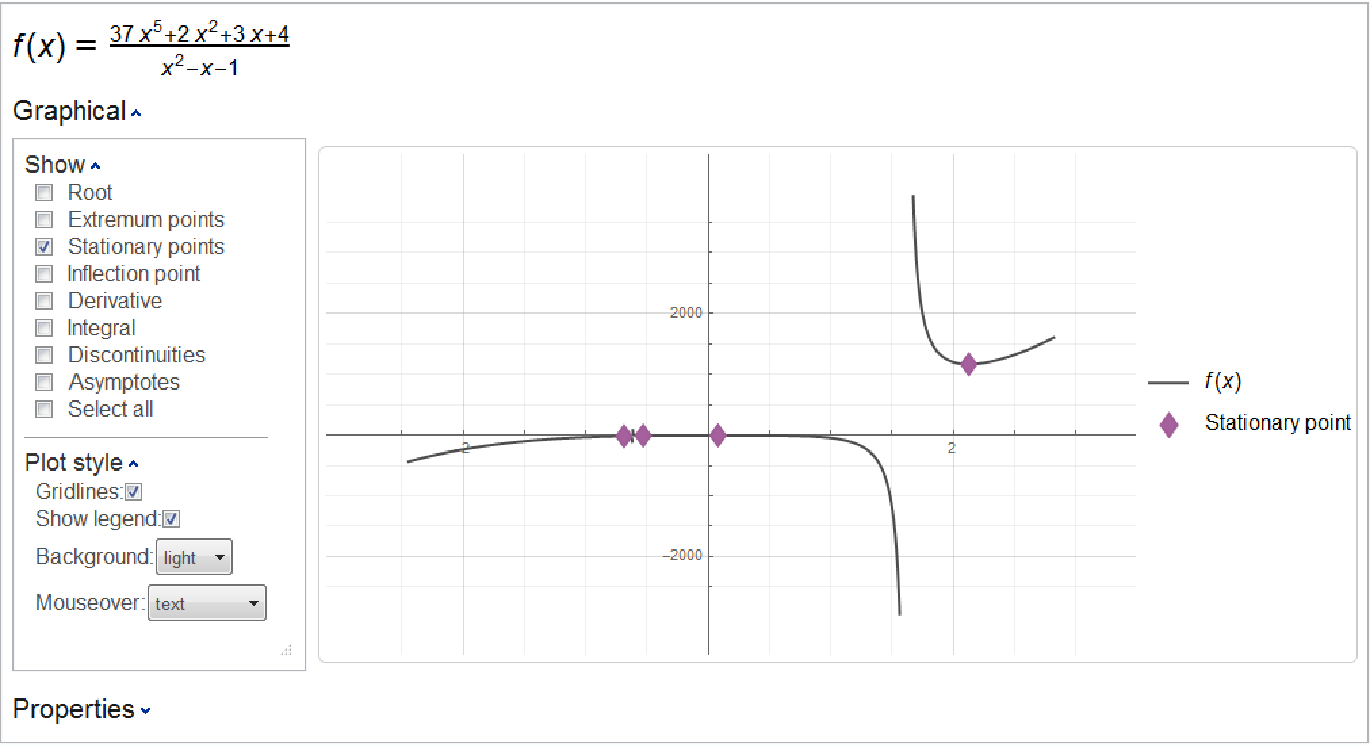
The four stationary points displayed are the same as those found by the resource function StationaryPoints:

In[6]:=
statPnts = ResourceFunction["StationaryPoints"][func, x]
In[7]:=
Flatten[Values[statPnts], {1, 2}][[All, 2]]
Out[7]=

Plot a function along with its derivative, using a dark theme and GridLines:

In[8]:=
func = (-12 - x + x^2)/(8 + 2 x - 5 x^2 + x^3);
ResourceFunction["Kurvendiskussion"][func, x]
Out[8]=

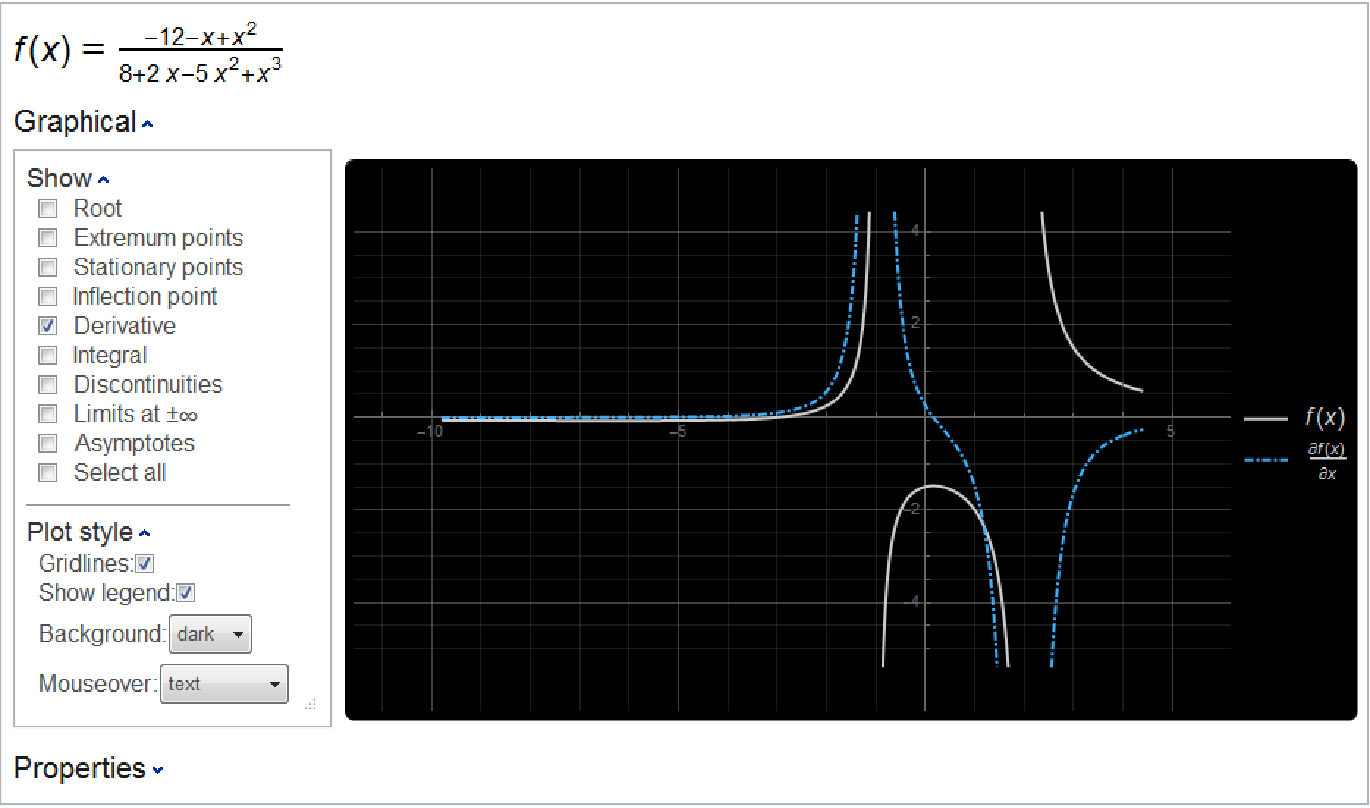
Plot a function along with its points of discontinuity:

In[9]:=
func = 1/Sin[x];
ResourceFunction["Kurvendiskussion"][func, x]
Out[9]=

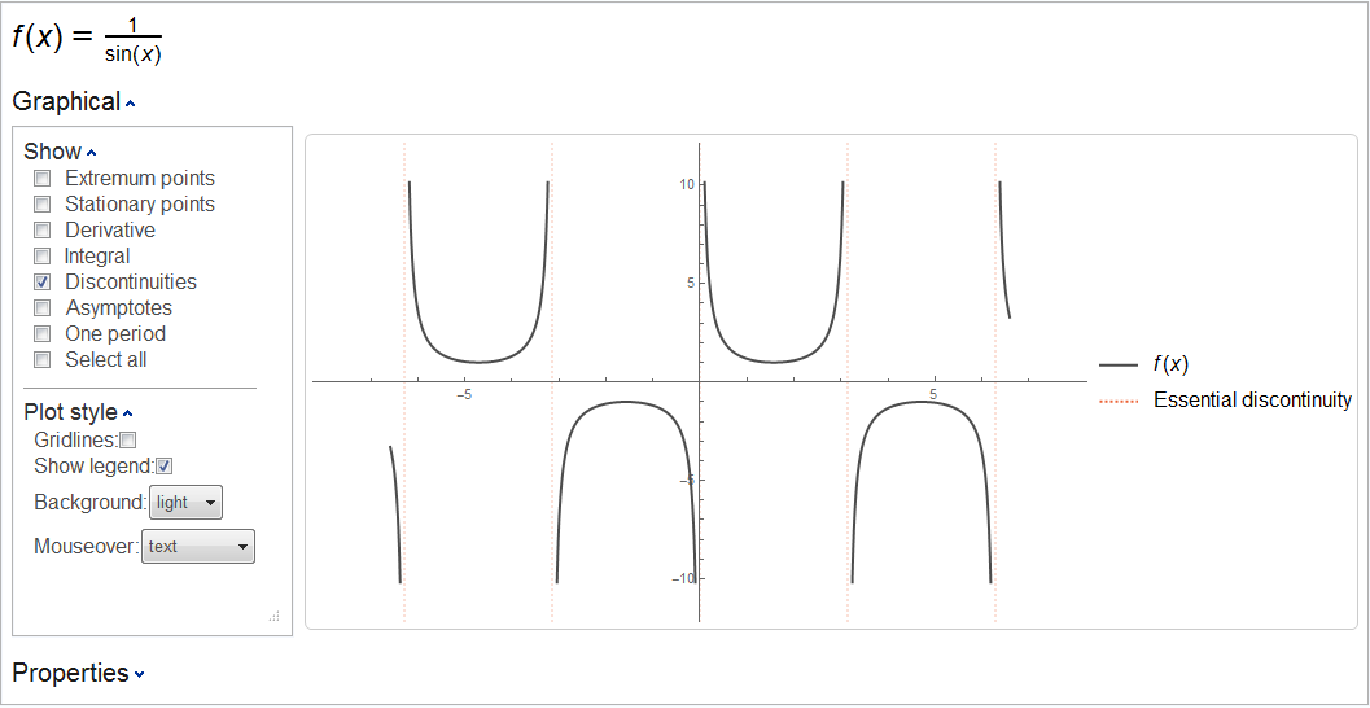
The discontinuities displayed are the same as those found by the resource function FunctionDiscontinuities:

In[10]:=
ResourceFunction["FunctionDiscontinuities"][func, x]
Out[10]=

Plot a function along with its parabolic asymptote:

In[11]:=
func = (x^3 + Sin[x])/x;
ResourceFunction["Kurvendiskussion"][func, x]
Out[11]=

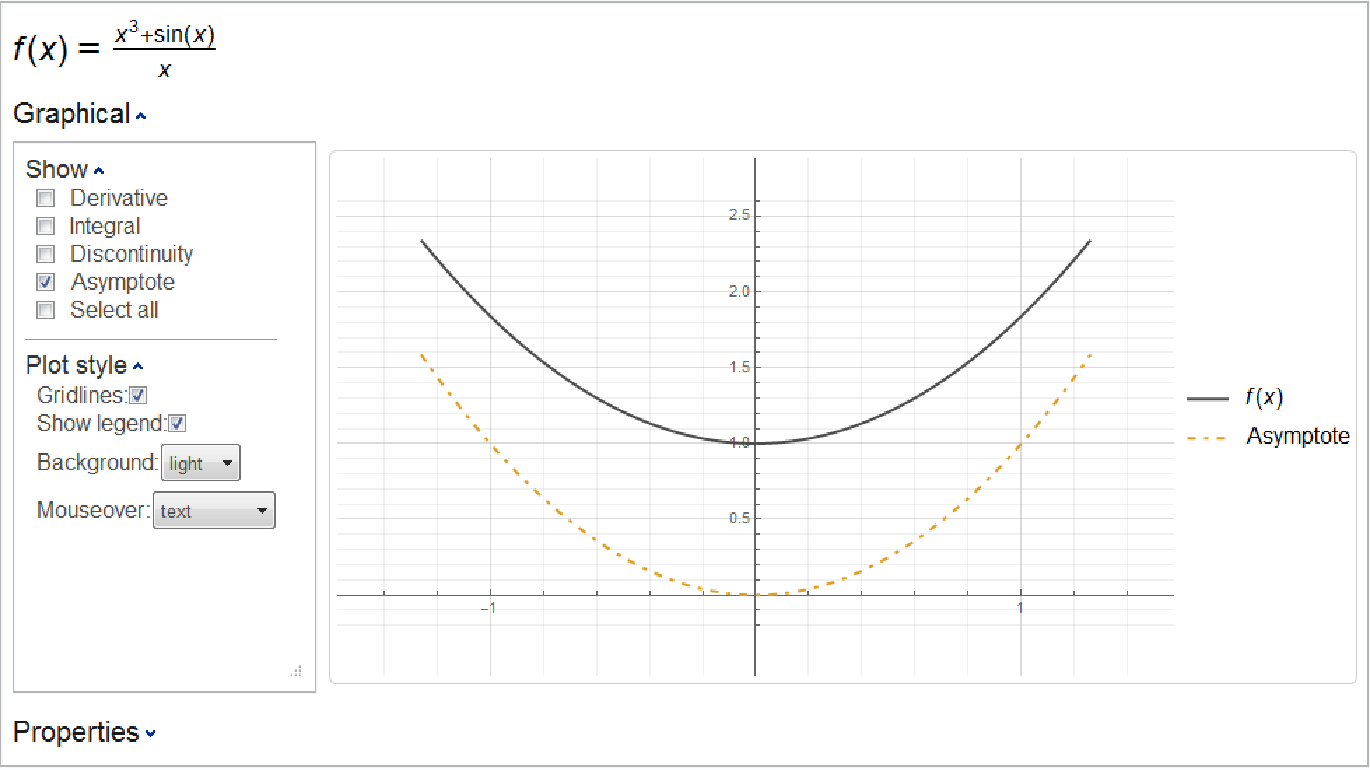
This is the same parabolic asymptote that is found by the resource function Asymptotes:

In[12]:=
ResourceFunction["Asymptotes"][func, x, y]
Out[12]=

Publisher

Wolfram|Alpha Math Team

Version History

  • 2.0.0 – 23 March 2023
  • 1.0.0 – 28 October 2019

Related Resources

License Information