| "Type" | "ENTREZ_GENE_ID" | type of gene identifiers used for the input;
allowed values include:
"AFFYMETRIX_3PRIME_IVT_ID","AFFYMETRIX_EXON_GENE_ID","AFFYMETRIX_SNP_ID",
"AGILENT_CHIP_ID","AGILENT_ID","AGILENT_OLIGO_ID","ENSEMBL_GENE_ID",
"ENSEMBL_TRANSCRIPT_ID","ENTREZ_GENE_ID","FLYBASE_GENE_ID",
"FLYBASE_TRANSCRIPT_ID","GENBANK_ACCESSION","GENPEPT_ACCESSION",
"GENOMIC_GI_ACCESSION","PROTEIN_GI_ACCESSION","ILLUMINA_ID","IPI_ID",
"MGI_ID","GENE_SYMBOL","PFAM_ID","PIR_ACCESSION","PIR_ID","PIR_NREF_ID",
"REFSEQ_GENOMIC","REFSEQ_MRNA","REFSEQ_PROTEIN","REFSEQ_RNA","RGD_ID",
"SGD_ID","TAIR_ID","UCSC_GENE_ID","UNIGENE","UNIPROT_ACCESSION","UNIPROT_ID",
"UNIREF100_ID","WORMBASE_GENE_ID","WORMPEP_ID","ZFIN_ID"
|
| "Annotation" | {"GOTERM_BP_ALL","GOTERM_CC_ALL",
"GOTERM_MF_ALL","KEGG_PATHWAY"} | List of annotation terms to be analyzed; the list can include a mix of annotation groups and individual annotations;
allowed annotation groups (left) and individual annotations (right) include:
"Gene Ontology"-> {"GOTERM_BP_1","GOTERM_BP_2","GOTERM_BP_3","GOTERM_BP_4","GOTERM_BP_5",
"GOTERM_BP_ALL","GOTERM_BP_FAT","GOTERM_CC_1","GOTERM_CC_2","GOTERM_CC_3","GOTERM_CC_4",
"GOTERM_CC_5","GOTERM_CC_ALL","GOTERM_CC_FAT","GOTERM_MF_1","GOTERM_MF_2","GOTERM_MF_3",
"GOTERM_MF_4","GOTERM_MF_5","GOTERM_MF_ALL","GOTERM_MF_FAT"},
"Pathways"->{"BBID","BIOCARTA","EC_NUMBER","KEGG_COMPOUND","KEGG_PATHWAY","KEGG_REACTION"},
"Protein Domains"->{"BLOCKS_ID","COG","INTERPRO","PDB_ID","PFAM","PIR_ALN","PIR_HOMOLOGY_DOMAIN",
"PIR_SUPERFAMILY","PRINTS","PRODOM","PROSITE","SCOP_ID","SMART","TIGRFAMS"},
"Disease"->{"GENETIC_ASSOCIATION_DB_DISEASE","OMIM_DISEASE"},
"General Annotations"->{"ALIAS_GENE_SYMBOL","CHROMOSOME","CYTOBAND","GENE","GENE_SYMBOL",
"HOMOLOGOUS_GENE","LL_SUMMARY","OMIM_ID","PIR_SUMMARY","PROTEIN_MW","REFSEQ_PRODUCT",
"SEQUENCE_LENGTH","SP_COMMENT"},
"Functional Categories"->{"CGAP_EST_QUARTILE","CGAP_EST_RANK","COG_ONTOLOGY","PIR_SEQ_FEATURE",
"SP_COMMENT_TYPE","SP_PIR_KEYWORDS","UP_SEQ_FEATURE"},
"Protein-Protein Interaction"->{"BIND","DIP","HIV_INTERACTION_CATEGORY","HIV_INTERACTION",
"MINT","NCICB_CAPATHWAY","TRANSFAC_ID"},
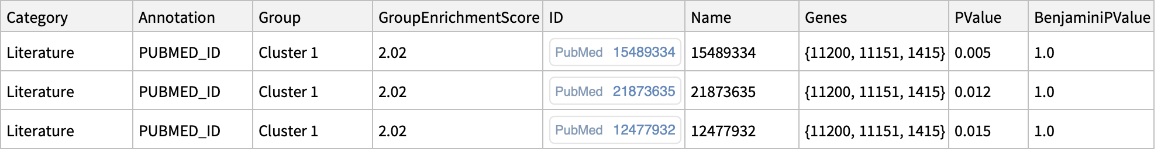
"Literature"->{"GENERIF_SUMMARY","HIV_INTERACTION_PUBMED_ID","PUBMED_ID"} |
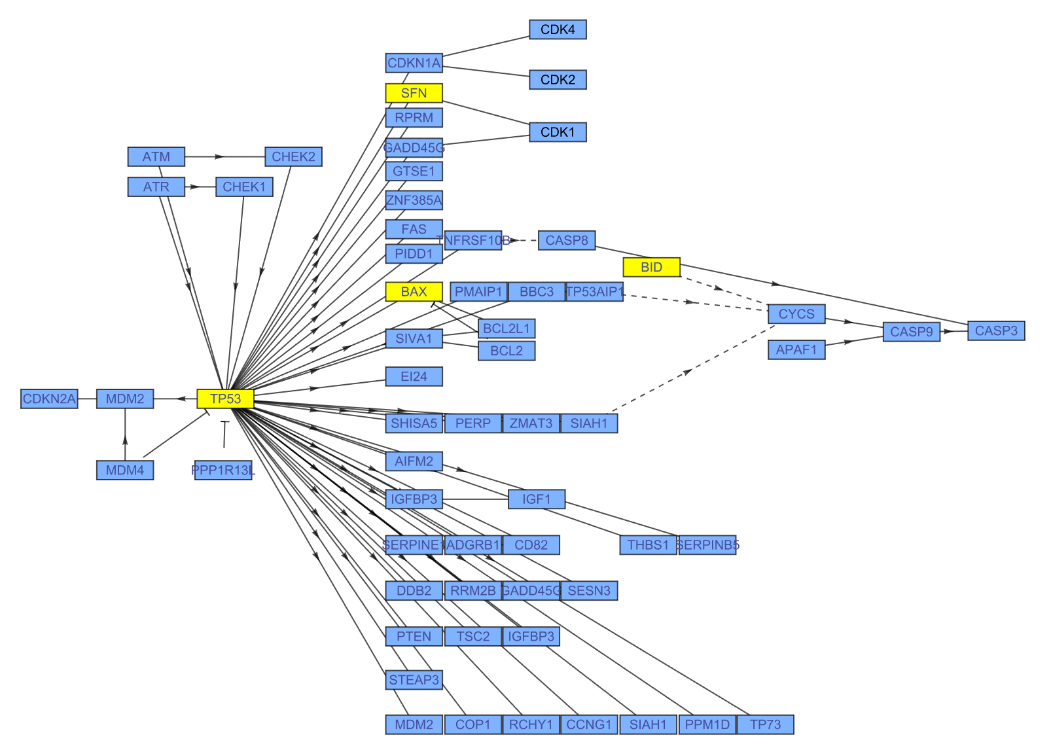
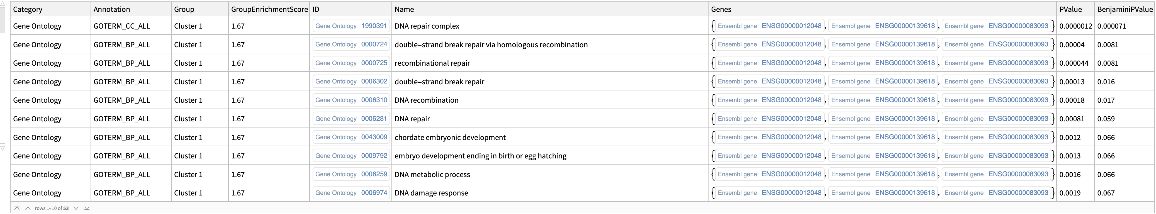
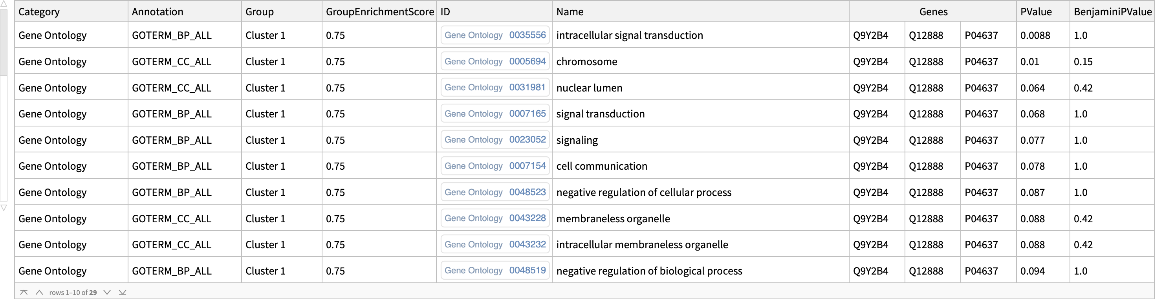
![ResourceFunction[
"DAVIDGeneEnrichmentAnalysis"][{ExternalIdentifier["EnsemblGeneID", "ENSG00000012048"], ExternalIdentifier["EnsemblGeneID", "ENSG00000139618"], ExternalIdentifier["EnsemblGeneID", "ENSG00000083093"]}, "Type" -> "ENSEMBL_GENE_ID"]](https://www.wolframcloud.com/obj/resourcesystem/images/21c/21c69d99-35f6-4e79-96a0-6d67a099c105/442ed8ec431c06d0.png)
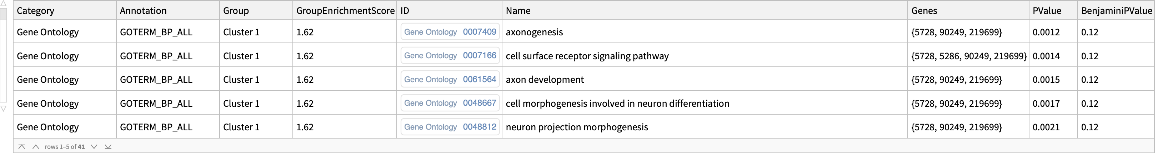
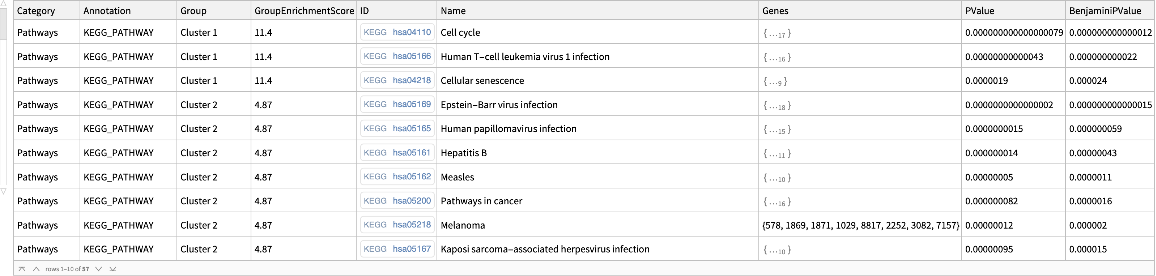
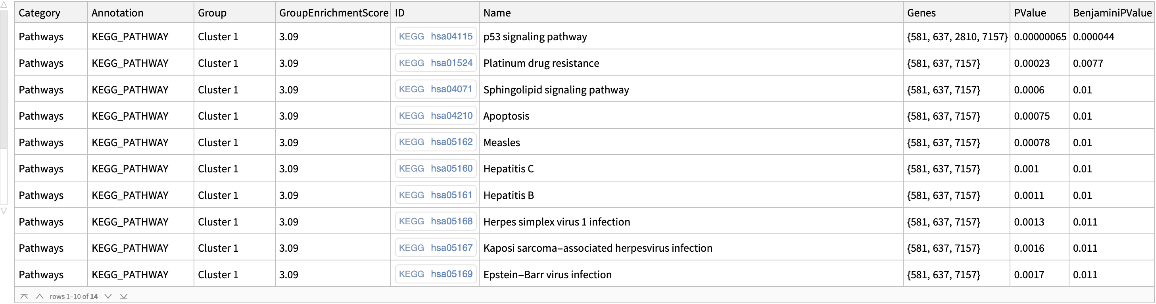
![keggpathwaygenes = ResourceFunction[
"DAVIDGeneEnrichmentAnalysis"][{"7157", "7042", "6794", "655", "7057", "1029", "2066", "7128", "6772", "11200", "958", "4734", "578", "6375", "991", "51561", "3082", "916", "1869", "2252", "8792", "864", "8817", "5105", "990", "701", "9641", "7187", "3383",
"699", "355", "894", "3696", "8555", "9134", "3339", "8317", "5971", "9088", "2258", "890", "1871", "8200", "3693", "9700", "10220", "2919", "266629", "3695", "3679"}, "Annotation" -> "KEGG_PATHWAY"]](https://www.wolframcloud.com/obj/resourcesystem/images/21c/21c69d99-35f6-4e79-96a0-6d67a099c105/5dcffc6d81a6e476.png)
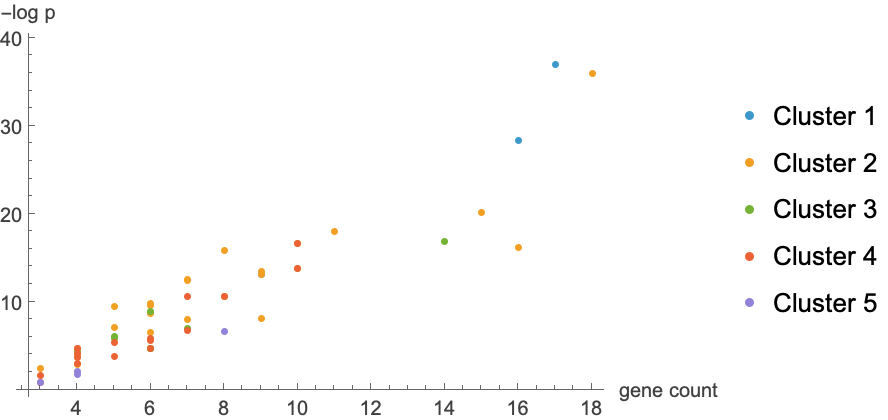

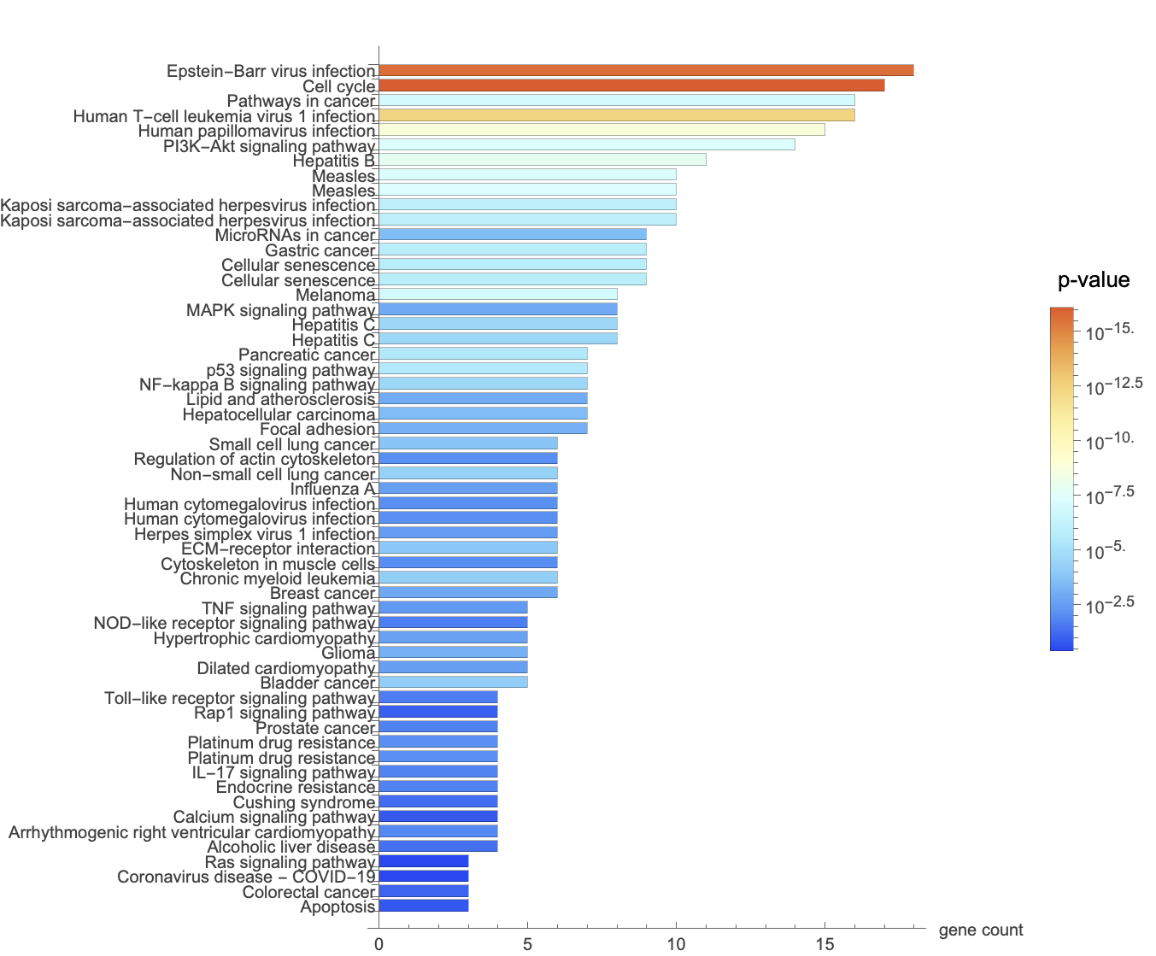
![Legended[
BarChart[
MapThread[
Style[#1, ColorData["LightTemperatureMap"][
Rescale[-Log10[#2], MinMax[-Log10 /@ keggpvalue[[All, 3]]]]]] &, {keggpvalue[[All, 2]], keggpvalue[[All, 3]]}], ChartLabels -> keggpvalue[[All, 1]],
BarOrigin -> Left, AxesLabel -> "gene count", AspectRatio -> 1.7, ImageSize -> 600], BarLegend[{"LightTemperatureMap", MinMax[-Log10 /@ keggpvalue[[All, 3]]]}, LabelingFunction -> Function[(10^-HoldForm[#])], LegendLabel -> "p\[Hyphen]value"]]](https://www.wolframcloud.com/obj/resourcesystem/images/21c/21c69d99-35f6-4e79-96a0-6d67a099c105/26c1d0ed27502c92.png)
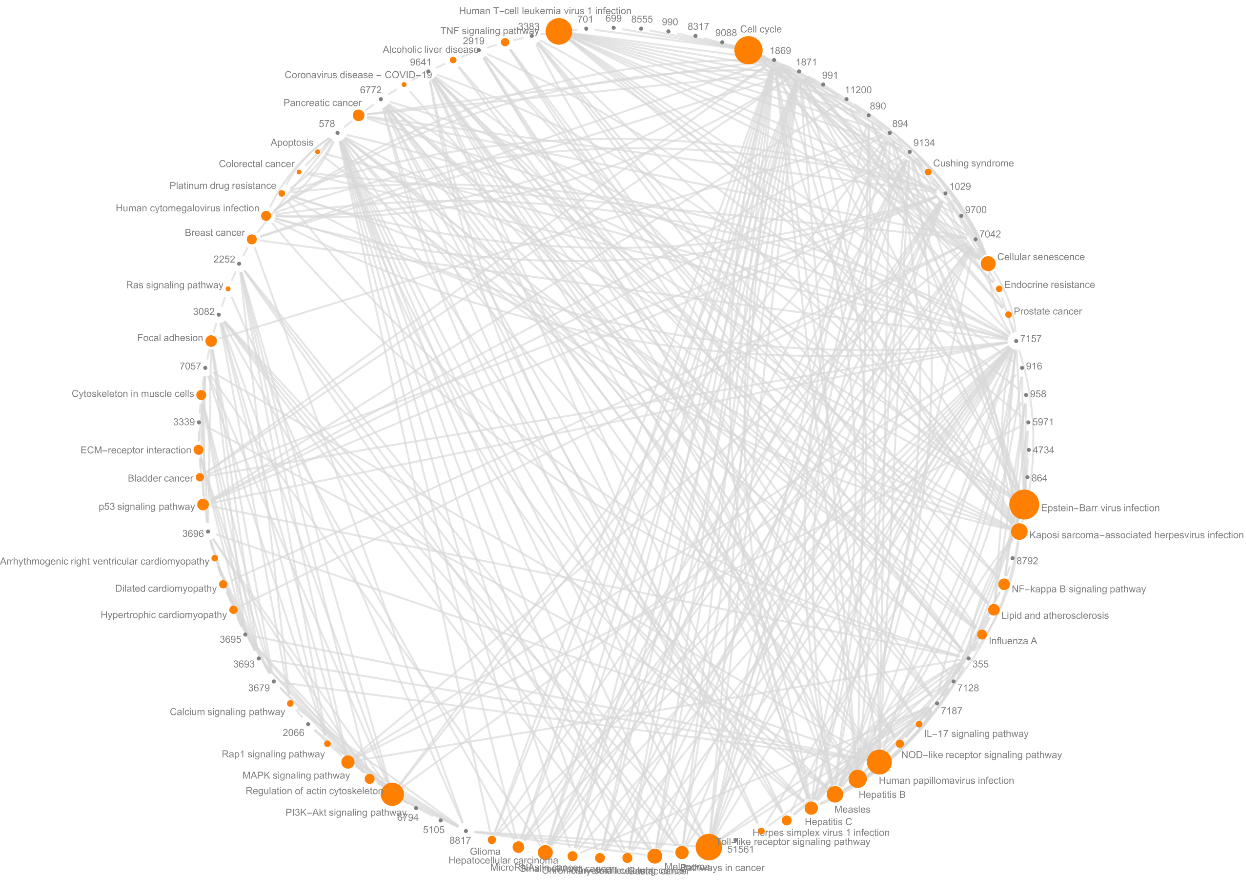
![Graph[Flatten[
Normal@keggpathwaygenes[All, Thread[{#"Name", #"Genes"}] &], 1] /. {bp_, gn_} :> UndirectedEdge[gn, bp], VertexStyle -> Map[# -> Orange &, Normal@keggpathwaygenes[All, "Name"]],
VertexSize -> Join[Map[#[[1]] -> {#[[2]]*.002, #[[2]]*.002} &, Normal@keggpathwaygenes[All, {#"Name", Length[#"Genes"]} &]], Map[# -> .15 &, Union@Flatten@Normal@keggpathwaygenes[All, "Genes"]]],
VertexLabels -> "Name", EdgeStyle -> Directive[Thick, LightGray], BaseStyle -> Directive[Gray, EdgeForm[None]], GraphLayout -> "CircularEmbedding"]](https://www.wolframcloud.com/obj/resourcesystem/images/21c/21c69d99-35f6-4e79-96a0-6d67a099c105/5331ca180b69301b.png)
![genes = Normal@Flatten@Values@ResourceFunction[
ResourceObject[<|"Name" -> "BioDBnetGeneData", "ShortName" -> "BioDBnetGeneData", "UUID" -> "73f25ec5-bf6c-435a-8087-74a79d984422", "ResourceType" -> "Function", "Version" -> "1.0.0", "Description" -> "Access information on genes available in major biological databases", "RepositoryLocation" -> URL[
"https://www.wolframcloud.com/obj/resourcesystem/api/1.0"], "SymbolName" -> "FunctionRepository`$f4720c38dbf74195bd13e18f466ed042`BioDBnetGeneData", "FunctionLocation" -> CloudObject[
"https://www.wolframcloud.com/obj/90cea3ec-6d0a-42f7-828a-46ffd6ae44dd"]|>, ResourceSystemBase -> Automatic]][{"581", "637", "2810", "7157"}, "GeneSymbol"]](https://www.wolframcloud.com/obj/resourcesystem/images/21c/21c69d99-35f6-4e79-96a0-6d67a099c105/1dc0b1fafc8c15b2.png)