Wolfram Function Repository
Instant-use add-on functions for the Wolfram Language
Function Repository Resource:
Plot the Frenet–Serret frame of a curve
ResourceFunction["FrenetSerretPlot"][c,t0,{t,tmin,tmax}] plots the curve c with parameter t from tmin to tmax, with the Frenet–Serret frame for c at t0. |
A figure eight:
| In[1]:= |
The Frenet–Serret frame:
| In[2]:= |
| Out[2]= | 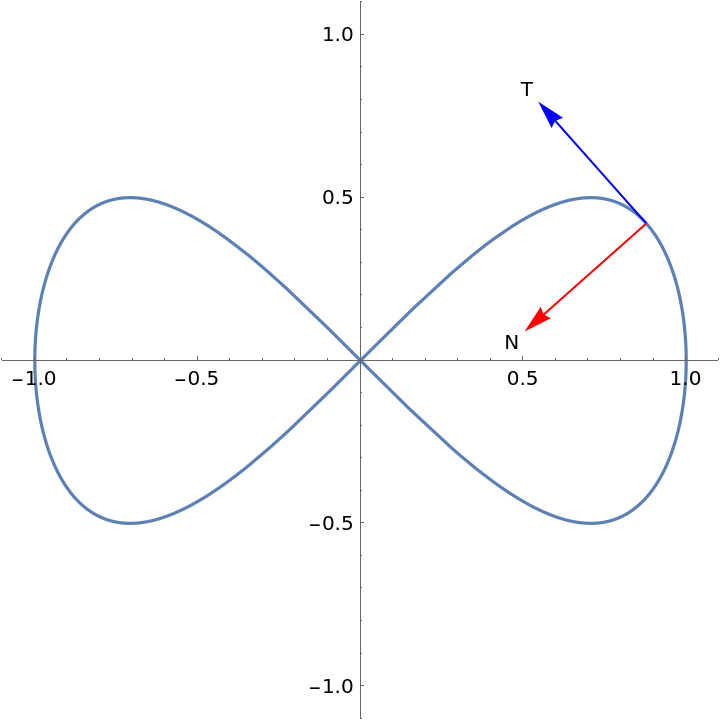 |
See how the system changes as t0 is varied:
| In[3]:= |
| Out[3]= | 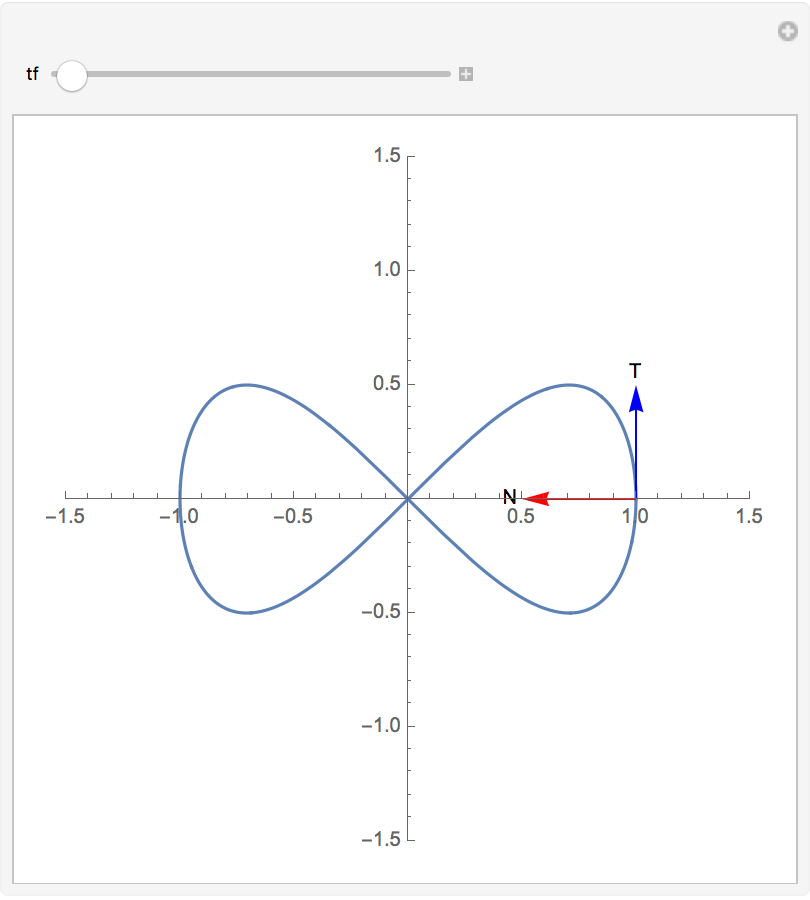 |
Viviani’s curve:
| In[4]:= |
| Out[4]= |
The Viviani’s curve with an animation of the tangent, normal, and binormal moves along the curve:
| In[5]:= | ![Manipulate[
Show[ResourceFunction["FrenetSerretPlot"][viviani, tf, {t, 0, 4 \[Pi]}, PlotRange -> 1.5], Graphics3D[{Opacity[.5], Sphere[]}]], {{tf, 2}, 0, 4 \[Pi]}]](https://www.wolframcloud.com/obj/resourcesystem/images/fa4/fa4dba61-a745-4928-a986-3d8c92942157/1115bbc21687d667.png) |
| Out[5]= | 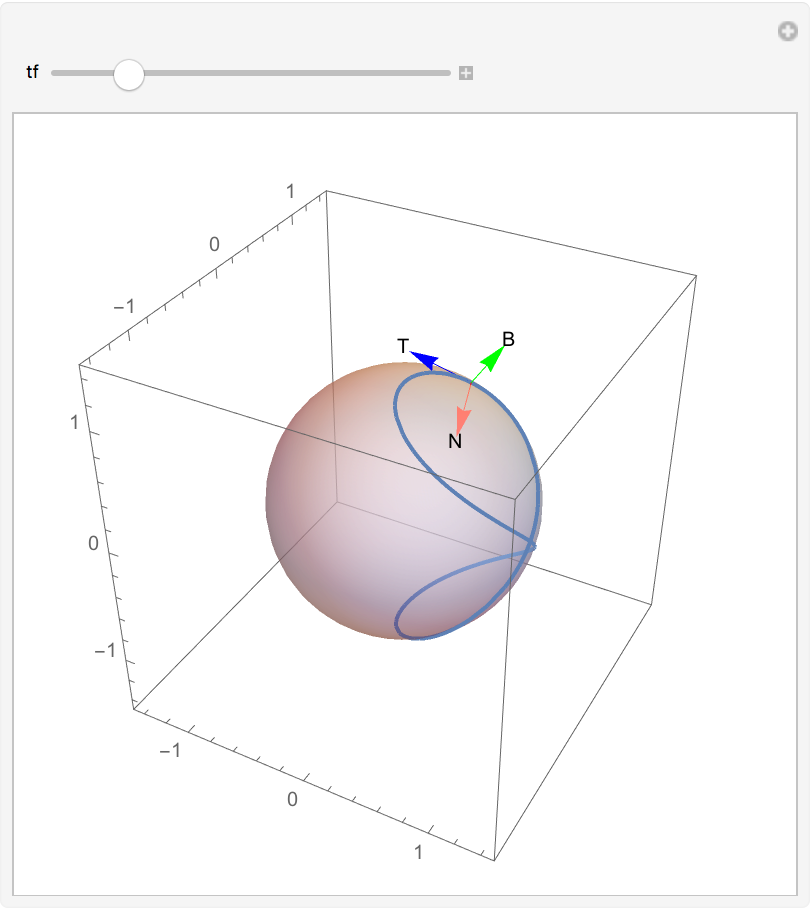 |
Modify the length of vectors:
| In[6]:= | ![Module[{tf = 4}, Show[ResourceFunction[
"FrenetSerretPlot"][{1/2 (1 + Cos[t]), Sin[t]/2, Sin[t/2]}, tf, {t, 0, 4 \[Pi]}, PlotRange -> 1.75, "ScaleFactor" -> 1],
Graphics3D[{Opacity[0.5`], Sphere[]}]]]](https://www.wolframcloud.com/obj/resourcesystem/images/fa4/fa4dba61-a745-4928-a986-3d8c92942157/2eee6fd950c043fd.png) |
| Out[6]= | 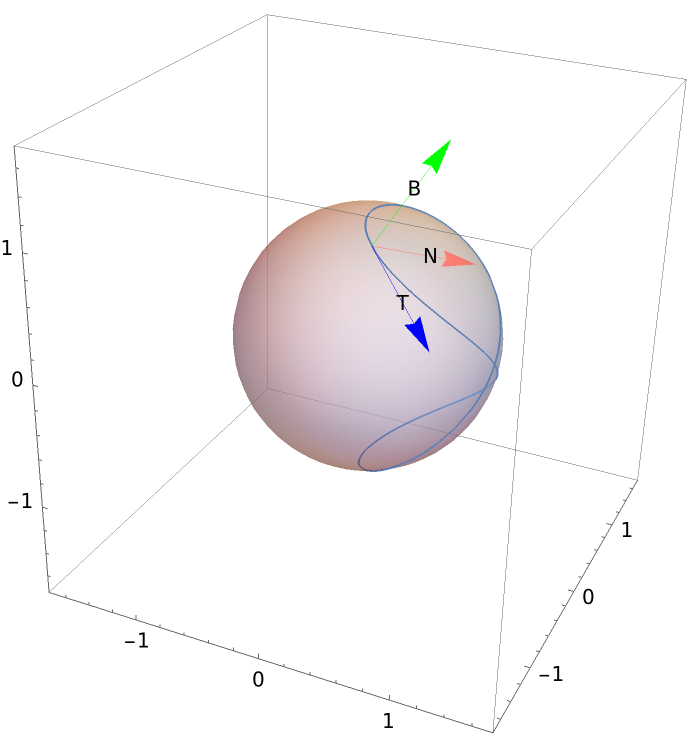 |
Change the style of vectors:
| In[7]:= | ![Module[{tf = 4}, Show[ResourceFunction[
"FrenetSerretPlot"][{1/2 (1 + Cos[t]), Sin[t]/2, Sin[t/2]}, tf, {t, 0, 4 \[Pi]}, PlotRange -> 1.5, "FrameStyle" -> {Directive[Dashed], Directive[Red, Dashing[0], Thick], Directive[Yellow]}], Graphics3D[{Opacity[0.5`], Sphere[]}]]]](https://www.wolframcloud.com/obj/resourcesystem/images/fa4/fa4dba61-a745-4928-a986-3d8c92942157/31b915f3dc71f4f2.png) |
| Out[7]= | 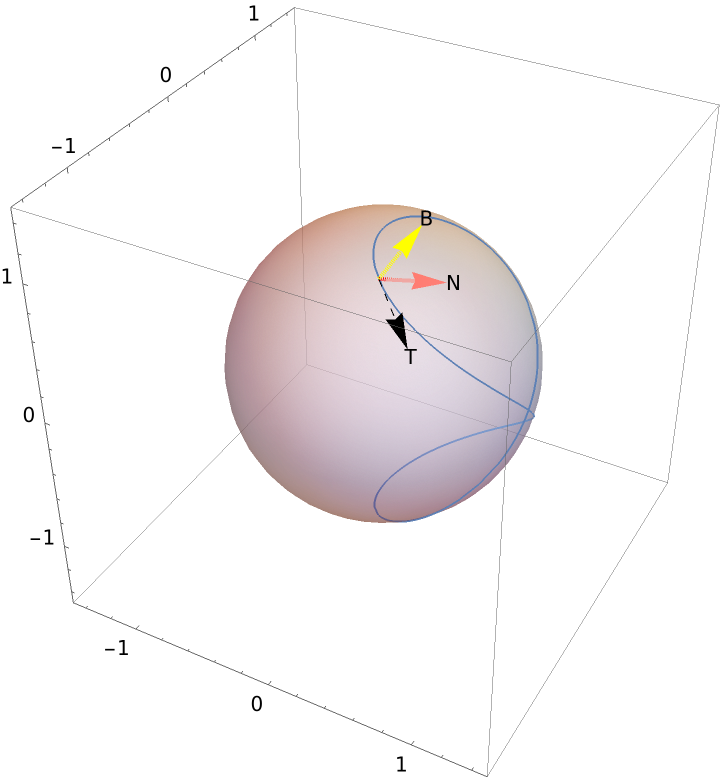 |
Change the text for vectors of the frame:
| In[8]:= | ![Module[{tf = 4}, Show[ResourceFunction[
"FrenetSerretPlot"][{1/2 (1 + Cos[t]), Sin[t]/2, Sin[t/2]}, tf, {t, 0, 4 \[Pi]}, PlotRange -> 1.5, "FrameText" -> {"1", "2", "3"}],
Graphics3D[{Opacity[0.5`], Sphere[]}]]]](https://www.wolframcloud.com/obj/resourcesystem/images/fa4/fa4dba61-a745-4928-a986-3d8c92942157/0a43c6fc63238f94.png) |
| Out[8]= | 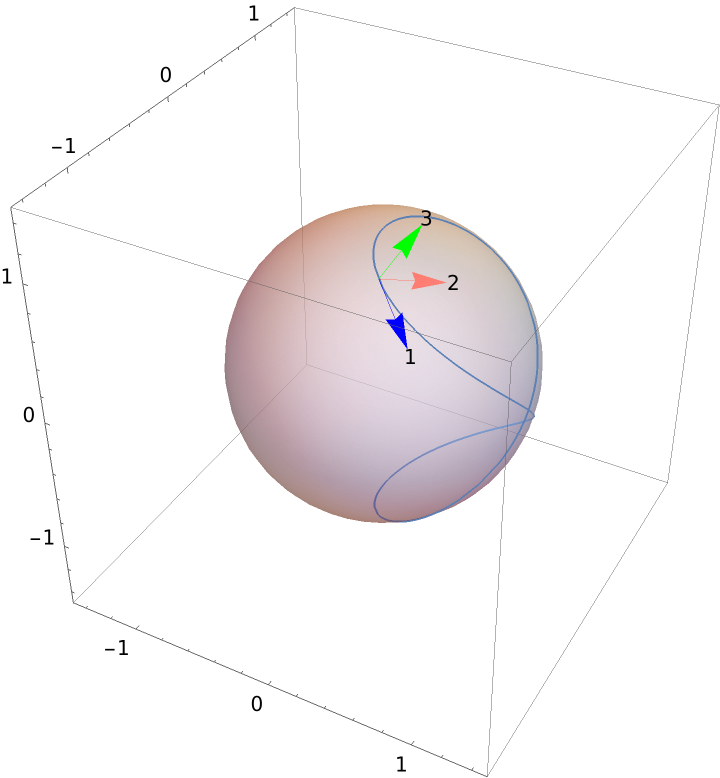 |
Adjust text position:
| In[9]:= | ![Module[{tf = 4}, Show[ResourceFunction[
"FrenetSerretPlot"][{1/2 (1 + Cos[t]), Sin[t]/2, Sin[t/2]}, tf, {t, 0, 4 \[Pi]}, PlotRange -> 1.5, "FrameTextPosition" -> -{0.25, 0.25, 0.25}],
Graphics3D[{Opacity[0.5`], Sphere[]}]]]](https://www.wolframcloud.com/obj/resourcesystem/images/fa4/fa4dba61-a745-4928-a986-3d8c92942157/5ea4ffdcecc6e369.png) |
| Out[9]= |  |
This work is licensed under a Creative Commons Attribution 4.0 International License