Wolfram Function Repository
Instant-use add-on functions for the Wolfram Language
Function Repository Resource:
Make a line that wiggles
ResourceFunction["WiggleLine"][points] creates a Line that wiggles along a smoothed BSplineCurve derived from the given list of points. | |
ResourceFunction["WiggleLine"][f] wiggles along the curve given by f. |
| "Shape" | "Sine" | wiggle shape function or one of "Sine", "Square", "Triangle", "Sawtooth", "Helix", "Semicircles", "Braid" |
| "Frequency" | Automatic | frequency of the wiggle |
| "Amplitude" | Automatic | amplitude of the wiggle |
| "TaperFraction" | Automatic | fraction of a line to taper off near the endpoints |
| "Points" | Automatic | number of line points |
Make a wiggly line between two points:
| In[1]:= |
| Out[1]= |
Make a curvier wiggly line:
| In[2]:= |
| Out[2]= |  |
Use BSplineFunction, BezierFunction or InterpolatingFunction as input:
| In[3]:= |
| Out[3]= |  |
| In[4]:= |
| Out[4]= |  |
| In[5]:= |
| Out[5]= |  |
Change the wiggle frequency:
| In[6]:= |
| Out[6]= |  |
Change the wiggle amplitude:
| In[7]:= |
| Out[7]= |  |
Change the amount of taper at endpoints:
| In[8]:= |
| Out[8]= |  |
No taper may produce a wiggle that misses its specified endpoints:
| In[9]:= |
| Out[9]= |  |
There are number of built-in wiggly shapes:
| In[10]:= | ![With[{pts = {{0, 0}, {1, 1}, {2, 0}}},
GraphicsGrid@
Partition[
Graphics[{ResourceFunction["WiggleLine"][pts, "Shape" -> #]}, PlotLabel -> #] & /@ {"Sine", "Square", "Triangle", "Sawtooth", "Helix", "Semicircles", "Braid"}, UpTo[3]]
]](https://www.wolframcloud.com/obj/resourcesystem/images/f35/f35f88d5-2cdf-4e2b-bf3a-171b95d3d101/47ea3f00e457b122.png) |
| Out[10]= | 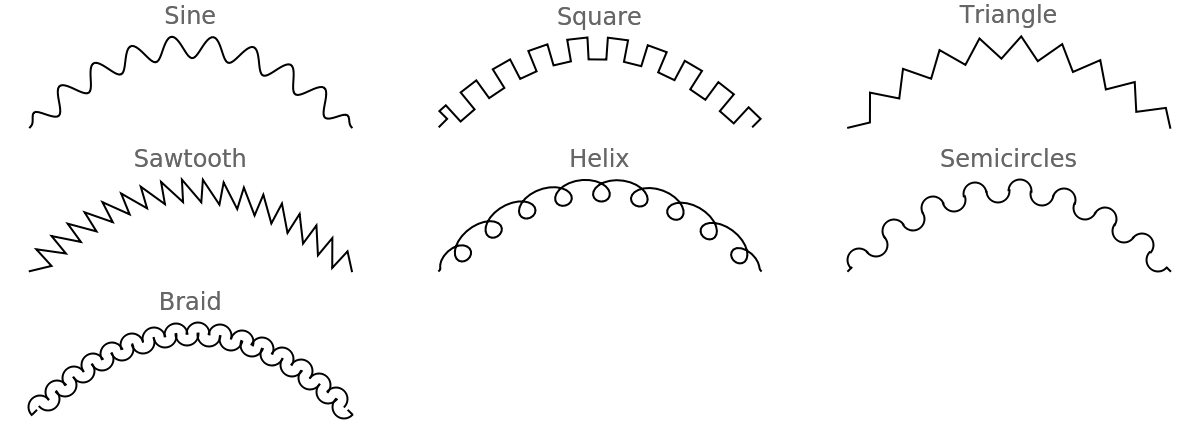 |
Use custom function as a shape:
| In[11]:= | ![Graphics[{ResourceFunction["WiggleLine"][{{0, 0}, {1, 1}, {2, 0}}, "Shape" -> Function[TriangleWave[#] - SquareWave[#]]]}]](https://www.wolframcloud.com/obj/resourcesystem/images/f35/f35f88d5-2cdf-4e2b-bf3a-171b95d3d101/3a845c99d4c372b0.png) |
| Out[11]= |  |
Provide the exact number of line points to return:
| In[12]:= |
| Out[12]= |
Draw a Feynman Diagram:
| In[13]:= | ![Graphics[{
Arrowheads[{{Medium, .5}}], Arrow[{{0, 1}, {1, 0}}], Arrow[{{1, 0}, {0, -1}}],
Arrow[{{2, .2}, {3, 1}}], Arrow[{{3, -1}, {2, .2}}],
Arrowheads[{{Small, .556, Graphics[Line[{{{-1, 1/2}, {0, 0}, {-1, -1/2}}}]]}}],
Arrow@ResourceFunction["WiggleLine"][{{1, 0}, {2, .2}}, "Shape" -> "Helix", "Amplitude" -> .03]
}]](https://www.wolframcloud.com/obj/resourcesystem/images/f35/f35f88d5-2cdf-4e2b-bf3a-171b95d3d101/718fac3423affccb.png) |
| Out[13]= |  |
If length of the line is too small, WiggleLine returns a single Point:
| In[14]:= |
| Out[14]= |
Wiggle some fractal curves:
| In[15]:= |
| Out[15]= | 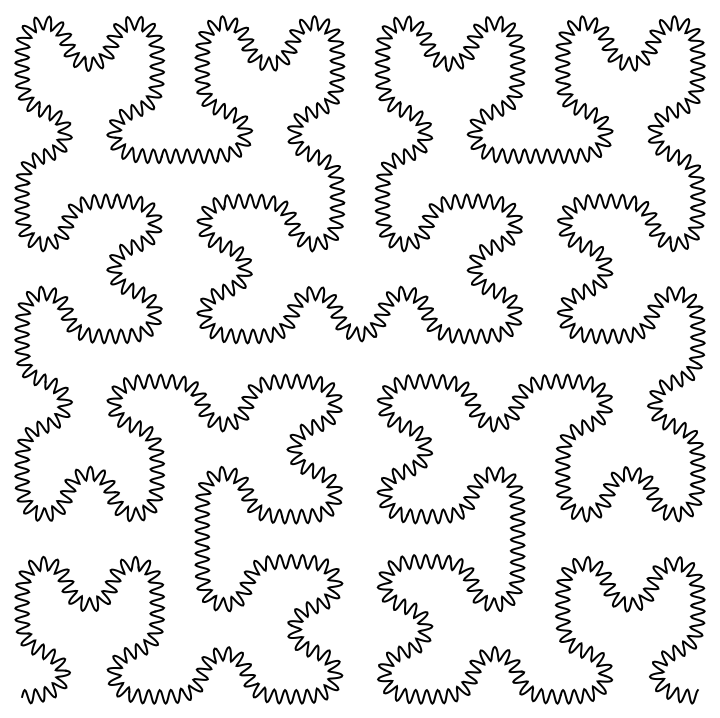 |
| In[16]:= |
| Out[16]= | 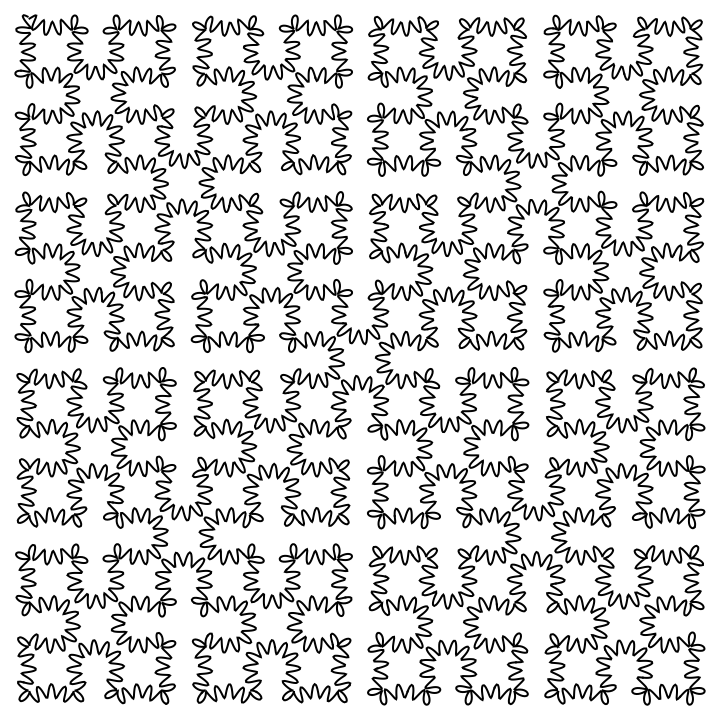 |
| In[17]:= |
| Out[17]= |  |
| In[18]:= |
| Out[18]= |  |
| In[19]:= |
| Out[19]= |  |
Wolfram Language 14.0 (January 2024) or above
This work is licensed under a Creative Commons Attribution 4.0 International License