Wolfram Function Repository
Instant-use add-on functions for the Wolfram Language
Function Repository Resource:
Create a custom bar chart of amino acid content for a list of foods
ResourceFunction["AminoAcidsBarChart"][foods] returns customizable amino acid information for a list of foods as a 2D or 3D bar chart. |
| ChartLabels | Automatic | food names |
| ImageSize | 600 | overall image size expressed in points |
| ImageMargins | Automatic | absolute margins around image |
| Background | Automatic | background color for chart |
Compare the amounts of amino acids in these high-protein foods. Choose from 20 amino acids in the dropdown list:
| In[1]:= |
| Out[1]= | 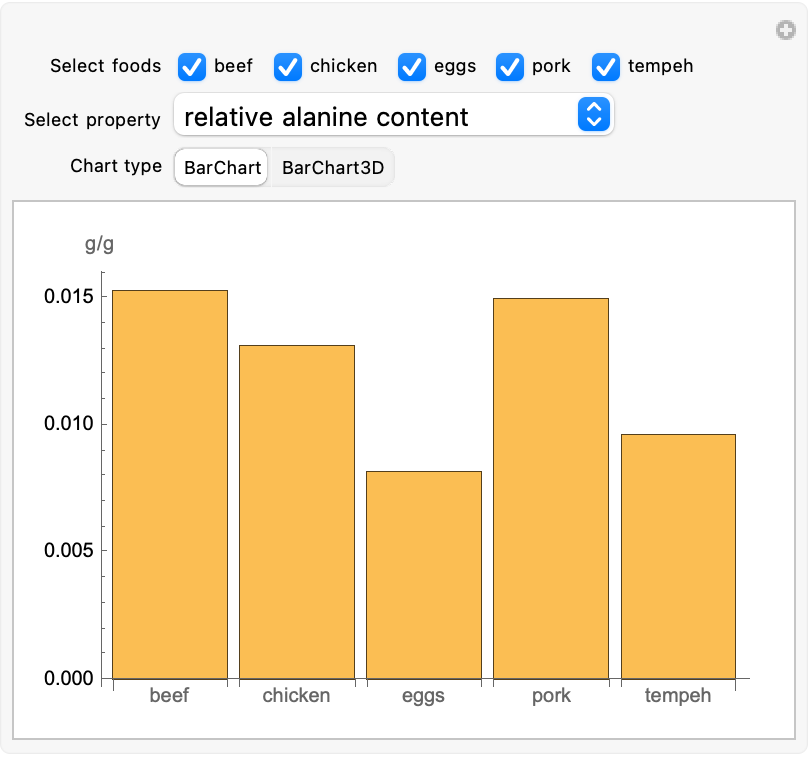 |
Use options to customize the appearance of the chart:
| In[2]:= | ![ResourceFunction[
"AminoAcidsBarChart"][{"beef", "chicken", "eggs", "pork", "tempeh"}, ChartStyle -> "RedBlueTones", BarSpacing -> None, Background -> LightBlue, ImageMargins -> 10, PlotLabel -> "Amino Acids in High-Protein Foods"]](https://www.wolframcloud.com/obj/resourcesystem/images/ee0/ee01f128-cd57-4031-8789-6edbec5b3431/45b410a705faa30d.png) |
| Out[2]= | 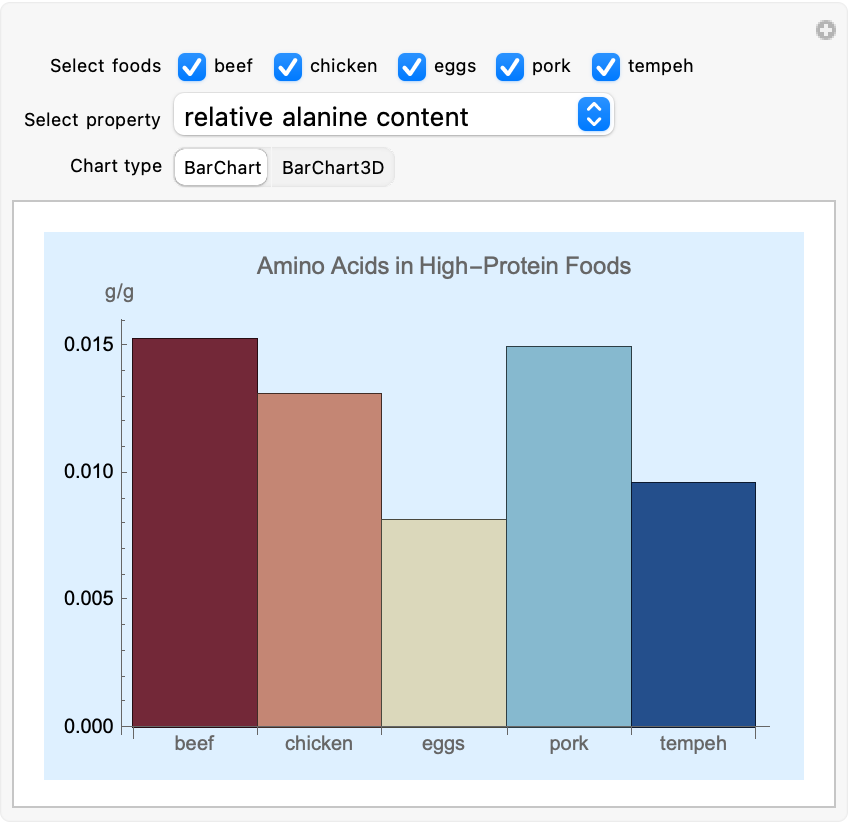 |
Select the BarChart3D chart type for a different perspective when comparing these nuts and seeds:
| In[3]:= | ![ResourceFunction[
"AminoAcidsBarChart"][{"hazelnut", "peanut", "pecan", "macadamia", "chia seed", "sesame seed"}, ChartStyle -> 73, ChartLabels -> Placed[{"hazelnut", "peanut", "pecan", "macadamia", "chia seed", "sesame seed"}, Below, Rotate[#, Pi/2] &]]](https://www.wolframcloud.com/obj/resourcesystem/images/ee0/ee01f128-cd57-4031-8789-6edbec5b3431/14a8fd9d61b60f53.png) |
| Out[3]= |  |
Select All in the dropdown list for an interactive 3D chart of the amino acids in these deli meats:
| In[4]:= |
| Out[4]= | 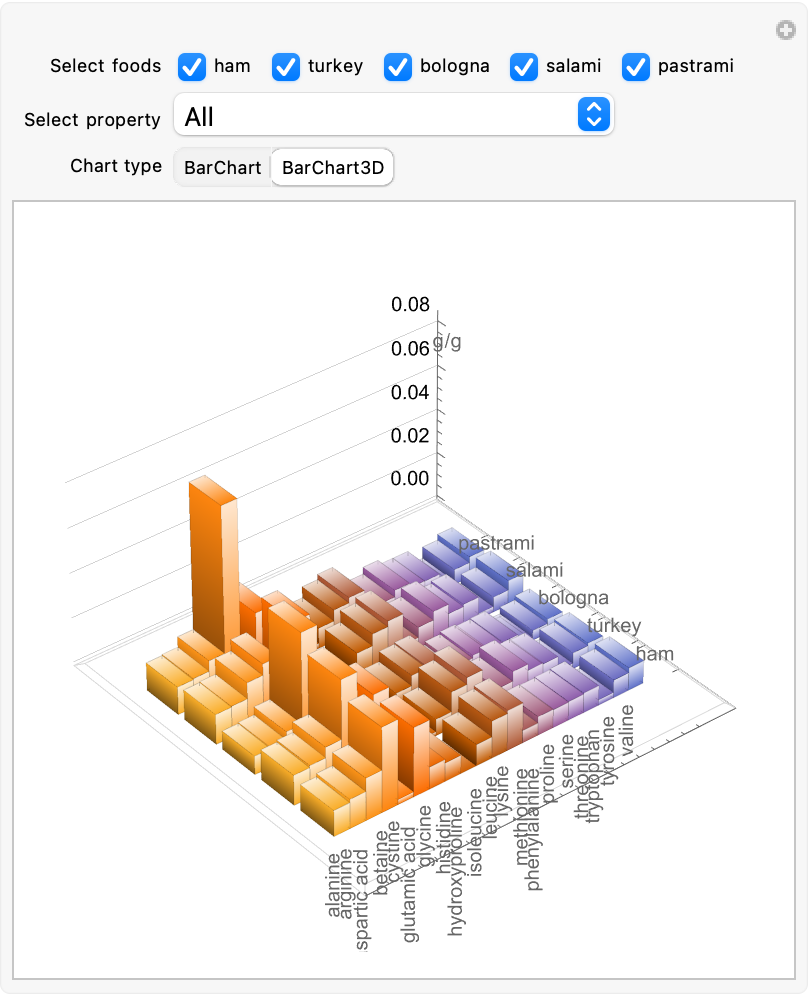 |
Deselect foods to examine a smaller set of data, then reselect those foods to restore their data to the chart. Rotate the chart for different views:
| In[5]:= |
| Out[5]= | 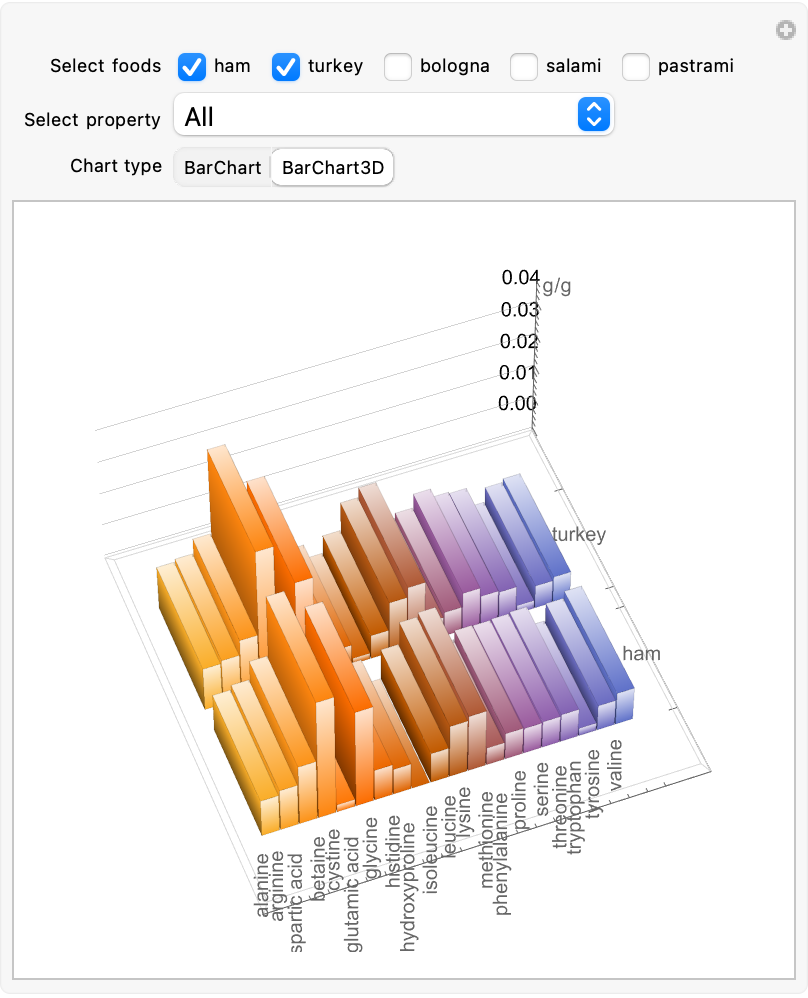 |
Wolfram Language 13.0 (December 2021) or above
This work is licensed under a Creative Commons Attribution 4.0 International License