Wolfram Function Repository
Instant-use add-on functions for the Wolfram Language
Function Repository Resource:
Assign colors to edges of a graph so that no two adjacent edges have the same color
ResourceFunction["EdgeColoring"][g] gives an edge coloring of graph g. |
Get a sample graph:
| In[1]:= |
| Out[1]= | 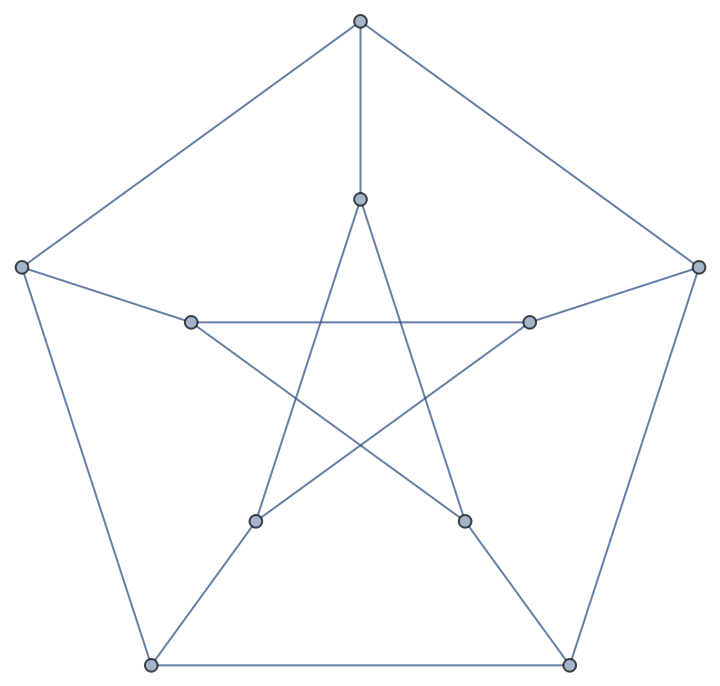 |
Group edges of a graph so that no group contains adjacent edges:
| In[2]:= |
| Out[2]= |
Highlight edges in the groups:
| In[3]:= |
| Out[3]= | 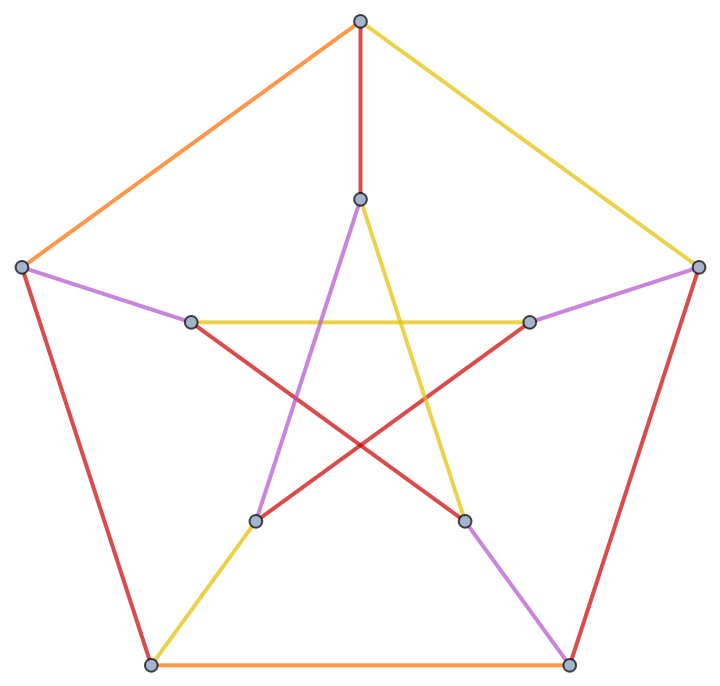 |
Use the specified set of colors:
| In[4]:= |
| Out[4]= |
| In[5]:= |
| Out[5]= | 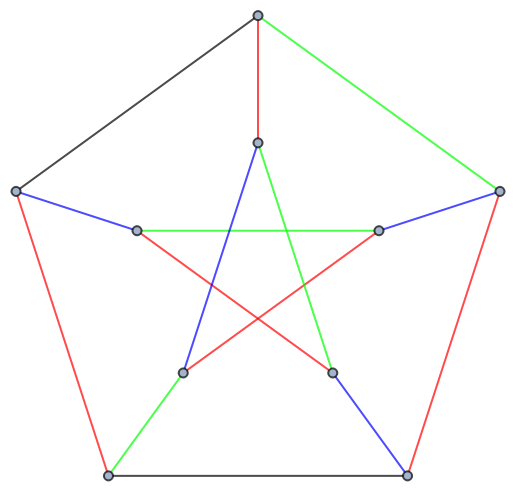 |
EdgeColoring works with undirected graphs:
| In[6]:= | ![ResourceFunction["EdgeColoring"][\!\(\*
GraphicsBox[
NamespaceBox["NetworkGraphics",
DynamicModuleBox[{Typeset`graph = HoldComplete[
Graph[{1, 2, 3, 6, 4, 5}, {Null, {{1, 2}, {1, 3}, {3, 4}, {5, 4}, {6, 1}, {6, 5}, {
4, 1}}}, {EdgeStyle -> {
Arrowheads[0.05]}, VertexShapeFunction -> {"Name"}}]], Typeset`boxes, Typeset`boxes$s2d = GraphicsGroupBox[{{
Directive[
Hue[0.6, 0.2, 0.8],
EdgeForm[
Directive[
GrayLevel[0],
Opacity[0.7]]]],
TagBox[
InsetBox[
BoxData[
FormBox[
PaneBox["1", Alignment -> Center, ImageMargins -> 2], TraditionalForm]], {0.9105692615187663, 0.8360540621313554}, BaseStyle -> "Graphics"], "DynamicName", BoxID -> "VertexID$1"],
TagBox[
InsetBox[
BoxData[
FormBox[
PaneBox["2", Alignment -> Center, ImageMargins -> 2], TraditionalForm]], {0., 1.1532590624791177`}, BaseStyle -> "Graphics"], "DynamicName", BoxID -> "VertexID$2"],
TagBox[
InsetBox[
BoxData[
FormBox[
PaneBox["3", Alignment -> Center, ImageMargins -> 2], TraditionalForm]
], {0.9901787089965595, 0.}, BaseStyle -> "Graphics"], "DynamicName", BoxID -> "VertexID$3"],
TagBox[
InsetBox[
BoxData[
FormBox[
PaneBox["6", Alignment -> Center, ImageMargins -> 2], TraditionalForm]], {1.6310911016266327`, 0.3899112848656986}, BaseStyle -> "Graphics"], "DynamicName", BoxID -> "VertexID$4"],
TagBox[
InsetBox[
BoxData[
FormBox[
PaneBox["4", Alignment -> Center, ImageMargins -> 2], TraditionalForm]], {2.2927686727030645`, 0.9445770975677718}, BaseStyle -> "Graphics"], "DynamicName", BoxID -> "VertexID$5"],
TagBox[
InsetBox[
BoxData[
FormBox[
PaneBox["5", Alignment -> Center, ImageMargins -> 2], TraditionalForm]], {1.6608421533285063`, 1.4124733715227413`}, BaseStyle -> "Graphics"], "DynamicName", BoxID -> "VertexID$6"]}, {
Directive[
Opacity[0.7],
Hue[0.6, 0.7, 0.5]],
StyleBox[
LineBox[{
DynamicLocation["VertexID$1", Automatic, Center],
DynamicLocation["VertexID$2", Automatic, Center]}],
Arrowheads[0.05], StripOnInput -> False],
StyleBox[
LineBox[{
DynamicLocation["VertexID$1", Automatic, Center],
DynamicLocation["VertexID$3", Automatic, Center]}],
Arrowheads[0.05], StripOnInput -> False],
StyleBox[
LineBox[{
DynamicLocation["VertexID$1", Automatic, Center],
DynamicLocation["VertexID$6", Automatic, Center]}],
Arrowheads[0.05], StripOnInput -> False],
StyleBox[
LineBox[{
DynamicLocation["VertexID$1", Automatic, Center],
DynamicLocation["VertexID$4", Automatic, Center]}],
Arrowheads[0.05], StripOnInput -> False],
StyleBox[
LineBox[{
DynamicLocation["VertexID$3", Automatic, Center],
DynamicLocation["VertexID$4", Automatic, Center]}],
Arrowheads[0.05], StripOnInput -> False],
StyleBox[
LineBox[{
DynamicLocation["VertexID$4", Automatic, Center],
DynamicLocation["VertexID$5", Automatic, Center]}],
Arrowheads[0.05], StripOnInput -> False],
StyleBox[
LineBox[{
DynamicLocation["VertexID$5", Automatic, Center],
DynamicLocation["VertexID$6", Automatic, Center]}],
Arrowheads[0.05], StripOnInput -> False]}}], Typeset`data},
TagBox[
DynamicBox[GraphComputation`NetworkGraphicsBox[
2, Typeset`graph, Typeset`boxes], {CachedValue :> Typeset`boxes, SingleEvaluation -> True, SynchronousUpdating -> False, TrackedSymbols :> {}},
ImageSizeCache->{{8.881784197001252*^-16, 90.}, {-36.284461649853334`,
32.00000000000001}}],
MouseAppearanceTag["NetworkGraphics"]],
AllowKernelInitialization->False,
UnsavedVariables:>{Typeset`data}]],
DefaultBaseStyle->{"NetworkGraphics", FrontEnd`GraphicsHighlightColor -> Hue[0.8, 1., 0.6]},
FrameTicks->None]\)]](https://www.wolframcloud.com/obj/resourcesystem/images/ec3/ec391a9a-e8f2-495c-8241-a79e01b643fd/5b98b776266566bb.png) |
| Out[6]= |
Directed graphs:
| In[7]:= | ![ResourceFunction["EdgeColoring"][\!\(\*
GraphicsBox[
NamespaceBox["NetworkGraphics",
DynamicModuleBox[{Typeset`graph = HoldComplete[
Graph[{1, 3, 2, 6, 4, 5}, {{{1, 2}, {3, 1}, {2, 4}, {5, 4}, {1, 6}, {6, 5}, {4, 1}},
Null}, {EdgeStyle -> {
Arrowheads[0.08]}, PerformanceGoal -> "Quality", VertexShapeFunction -> {"Name"}}]], Typeset`boxes, Typeset`boxes$s2d = GraphicsGroupBox[{{
Arrowheads[0.03036417203345085],
Directive[
Opacity[0.7],
Hue[0.6, 0.7, 0.5]],
Arrowheads[0.08],
ArrowBox[{{
DynamicLocation["VertexID$1", Automatic, Center],
DynamicLocation["VertexID$2", Automatic, Center]}, {
DynamicLocation[
"VertexID$1", Automatic, Center],
DynamicLocation["VertexID$6", Automatic, Center]}, {
DynamicLocation[
"VertexID$2", Automatic, Center],
DynamicLocation["VertexID$4", Automatic, Center]}, {
DynamicLocation[
"VertexID$3", Automatic, Center],
DynamicLocation["VertexID$1", Automatic, Center]}, {
DynamicLocation[
"VertexID$4", Automatic, Center],
DynamicLocation["VertexID$1", Automatic, Center]}, {
DynamicLocation[
"VertexID$5", Automatic, Center],
DynamicLocation["VertexID$4", Automatic, Center]}, {
DynamicLocation[
"VertexID$6", Automatic, Center],
DynamicLocation["VertexID$5", Automatic, Center]}}]}, {
Directive[
Hue[0.6, 0.2, 0.8],
EdgeForm[
Directive[
GrayLevel[0],
Opacity[0.7]]]],
TagBox[
InsetBox[
BoxData[
FormBox[
PaneBox["1", Alignment -> Center, ImageMargins -> 2], TraditionalForm]], {1.0582418052620635`, 0.9723829770648784}, BaseStyle -> "Graphics"], "DynamicName", BoxID -> "VertexID$1"],
TagBox[
InsetBox[
BoxData[
FormBox[
PaneBox["3", Alignment -> Center, ImageMargins -> 2], TraditionalForm]], {1.1509423444907019`, 0.}, BaseStyle -> "Graphics"], "DynamicName", BoxID -> "VertexID$2"],
TagBox[
InsetBox[
BoxData[
FormBox[
PaneBox["2", Alignment -> Center, ImageMargins -> 2], TraditionalForm]], {0., 1.3421036772670925`}, BaseStyle -> "Graphics"], "DynamicName", BoxID -> "VertexID$3"],
TagBox[
InsetBox[
BoxData[
FormBox[
PaneBox["6", Alignment -> Center, ImageMargins -> 2], TraditionalForm]], {1.8963933008738443`, 0.45375950808317184`}, BaseStyle -> "Graphics"], "DynamicName", BoxID -> "VertexID$4"],
TagBox[
InsetBox[
BoxData[
FormBox[
PaneBox["4", Alignment -> Center, ImageMargins -> 2], TraditionalForm]], {2.666069013196534, 1.099186522746214}, BaseStyle -> "Graphics"], "DynamicName", BoxID -> "VertexID$5"],
TagBox[
InsetBox[
BoxData[
FormBox[
PaneBox["5", Alignment -> Center, ImageMargins -> 2], TraditionalForm]], {1.9309095855504228`, 1.6429177863358628`}, BaseStyle -> "Graphics"], "DynamicName", BoxID -> "VertexID$6"]}}], $CellContext`flag},
TagBox[
DynamicBox[GraphComputation`NetworkGraphicsBox[
3, Typeset`graph, Typeset`boxes, $CellContext`flag], {CachedValue :> Typeset`boxes, SingleEvaluation -> True, SynchronousUpdating -> False, TrackedSymbols :> {$CellContext`flag}},
ImageSizeCache->{{0., 90.}, {-36.29858239089034, 32.00000000000001}}],
MouseAppearanceTag["NetworkGraphics"]],
AllowKernelInitialization->False,
UnsavedVariables:>{$CellContext`flag}]],
DefaultBaseStyle->{"NetworkGraphics", FrontEnd`GraphicsHighlightColor -> Hue[0.8, 1., 0.6]},
FrameTicks->None,
GridLinesStyle->Directive[
GrayLevel[0.5, 0.4]]]\)]](https://www.wolframcloud.com/obj/resourcesystem/images/ec3/ec391a9a-e8f2-495c-8241-a79e01b643fd/3977e3131323ab9b.png) |
| Out[7]= |
Multigraphs:
| In[8]:= | ![ResourceFunction["EdgeColoring"][\!\(\*
GraphicsBox[
NamespaceBox["NetworkGraphics",
DynamicModuleBox[{Typeset`graph = HoldComplete[
Graph[{1, 2, 3, 4, 5}, {{{1, 2}, {2, 3}, {2, 3}, {3, 1}, {3, 4}, {4, 5}, {5, 3}},
Null}, {EdgeStyle -> {
Arrowheads[Automatic]}, FormatType -> TraditionalForm, GraphLayout -> {"Dimension" -> 2}, GridLinesStyle -> Directive[
GrayLevel[0.5, 0.4]], VertexLabels -> {"Name"}}]]},
TagBox[GraphicsGroupBox[{
{Hue[0.6, 0.7, 0.5], Opacity[0.7], Arrowheads[Automatic], ArrowBox[{{2.017540424146274, 0.00044208442469451104`}, {
2.017313638325164, 0.8021720910704471}}, 0.022753627728707843`], ArrowBox[BezierCurveBox[{{2.017313638325164, 0.8021720910704471}, {1.5786497609293124`, 0.4357165494909167}, {1.008104154360962, 0.40117133112610454`}}], 0.022753627728707843`], ArrowBox[BezierCurveBox[{{2.017313638325164, 0.8021720910704471}, {1.4467680317568175`, 0.7676268727056339}, {1.008104154360962, 0.40117133112610454`}}], 0.022753627728707843`], ArrowBox[{{1.008104154360962, 0.40117133112610454`}, {
2.017540424146274, 0.00044208442469451104`}}, 0.022753627728707843`], ArrowBox[{{1.008104154360962, 0.40117133112610454`}, {0., 0.}}, 0.022753627728707843`], ArrowBox[{{0., 0.}, {0.00022442750785334198`, 0.8026134080747779}}, 0.022753627728707843`], ArrowBox[{{0.00022442750785334198`, 0.8026134080747779}, {
1.008104154360962, 0.40117133112610454`}}, 0.022753627728707843`]},
{Hue[0.6, 0.2, 0.8], EdgeForm[{GrayLevel[0], Opacity[
0.7]}], {
DiskBox[{2.017540424146274, 0.00044208442469451104}, 0.022753627728707843], InsetBox["1", Offset[{2, 2}, {2.040294051874982, 0.023195712153402354}],
ImageScaled[{0, 0}],
BaseStyle->"Graphics"]}, {
DiskBox[{2.017313638325164, 0.8021720910704471}, 0.022753627728707843], InsetBox["2", Offset[{2, 2}, {2.040067266053872, 0.8249257187991549}], ImageScaled[{0, 0}],
BaseStyle->"Graphics"]}, {
DiskBox[{1.008104154360962, 0.40117133112610454}, 0.022753627728707843], InsetBox["3", Offset[{2, 2}, {1.0308577820896698, 0.4239249588548124}], ImageScaled[{0, 0}],
BaseStyle->"Graphics"]}, {DiskBox[{0., 0.}, 0.022753627728707843], InsetBox["4", Offset[{2, 2}, {0.022753627728707843, 0.022753627728707843}], ImageScaled[{0, 0}],
BaseStyle->"Graphics"]}, {
DiskBox[{0.00022442750785334198, 0.8026134080747779}, 0.022753627728707843], InsetBox["5", Offset[{2, 2}, {0.022978055236561185, 0.8253670358034857}], ImageScaled[{0, 0}],
BaseStyle->"Graphics"]}}}],
MouseAppearanceTag["NetworkGraphics"]],
AllowKernelInitialization->False]],
DefaultBaseStyle->{"NetworkGraphics", FrontEnd`GraphicsHighlightColor -> Hue[0.8, 1., 0.6]},
FormatType->TraditionalForm,
FrameTicks->None,
GridLinesStyle->Directive[
GrayLevel[0.5, 0.4]]]\)]](https://www.wolframcloud.com/obj/resourcesystem/images/ec3/ec391a9a-e8f2-495c-8241-a79e01b643fd/70785fc62e5439b0.png) |
| Out[8]= |
Mixed graphs:
| In[9]:= | ![ResourceFunction["EdgeColoring"][\!\(\*
GraphicsBox[
NamespaceBox["NetworkGraphics",
DynamicModuleBox[{Typeset`graph = HoldComplete[
Graph[{1, 3, 2, 6, 4, 5}, {{{1, 2}, {3, 1}, {2, 4}}, {{5, 4}, {1, 6}, {6, 5}, {4, 1}}}, {EdgeStyle -> {
Arrowheads[0.08]}, PerformanceGoal -> "Quality", VertexShapeFunction -> {"Name"}}]], Typeset`boxes, Typeset`boxes$s2d = GraphicsGroupBox[{{
Arrowheads[0.03036225639824664],
Directive[
Opacity[0.7],
Hue[0.6, 0.7, 0.5]],
Arrowheads[0.08],
LineBox[{
DynamicLocation["VertexID$1", Automatic, Center],
DynamicLocation["VertexID$4", Automatic, Center]}],
LineBox[{
DynamicLocation["VertexID$1", Automatic, Center],
DynamicLocation["VertexID$6", Automatic, Center]}],
ArrowBox[{
DynamicLocation["VertexID$1", Automatic, Center],
DynamicLocation["VertexID$2", Automatic, Center]}],
ArrowBox[{
DynamicLocation["VertexID$2", Automatic, Center],
DynamicLocation["VertexID$4", Automatic, Center]}],
ArrowBox[{
DynamicLocation["VertexID$3", Automatic, Center],
DynamicLocation["VertexID$1", Automatic, Center]}],
LineBox[{
DynamicLocation["VertexID$4", Automatic, Center],
DynamicLocation["VertexID$5", Automatic, Center]}],
LineBox[{
DynamicLocation["VertexID$5", Automatic, Center],
DynamicLocation["VertexID$6", Automatic, Center]}]}, {
Directive[
Hue[0.6, 0.2, 0.8],
EdgeForm[
Directive[
GrayLevel[0],
Opacity[0.7]]]],
TagBox[
InsetBox[
BoxData[
FormBox[
PaneBox["1", Alignment -> Center, ImageMargins -> 2], TraditionalForm]], {1.0584185461609268`, 0.9722706650009502}, BaseStyle -> "Graphics"], "DynamicName", BoxID -> "VertexID$1"],
TagBox[
InsetBox[
BoxData[
FormBox[
PaneBox["3", Alignment -> Center, ImageMargins -> 2], TraditionalForm]], {1.1511230006050828`, 0.}, BaseStyle -> "Graphics"], "DynamicName", BoxID -> "VertexID$2"],
TagBox[
InsetBox[
BoxData[
FormBox[
PaneBox["2", Alignment -> Center, ImageMargins -> 2], TraditionalForm]], {0., 1.3418307911430136`}, BaseStyle -> "Graphics"], "DynamicName", BoxID -> "VertexID$3"],
TagBox[
InsetBox[
BoxData[
FormBox[
PaneBox["6", Alignment -> Center, ImageMargins -> 2], TraditionalForm]], {1.8966497904439512`, 0.4537055162293067}, BaseStyle -> "Graphics"], "DynamicName", BoxID -> "VertexID$4"],
TagBox[
InsetBox[
BoxData[
FormBox[
PaneBox["4", Alignment -> Center, ImageMargins -> 2], TraditionalForm]], {2.6664901555059592`, 1.098927115783615}, BaseStyle -> "Graphics"], "DynamicName", BoxID -> "VertexID$5"],
TagBox[
InsetBox[
BoxData[
FormBox[
PaneBox["5", Alignment -> Center, ImageMargins -> 2], TraditionalForm]], {1.931325145715449, 1.6424972585468378`}, BaseStyle -> "Graphics"], "DynamicName", BoxID -> "VertexID$6"]}}], $CellContext`flag},
TagBox[
DynamicBox[GraphComputation`NetworkGraphicsBox[
3, Typeset`graph, Typeset`boxes, $CellContext`flag], {CachedValue :> Typeset`boxes, SingleEvaluation -> True, SynchronousUpdating -> False, TrackedSymbols :> {$CellContext`flag}},
ImageSizeCache->{{0., 90.00000000000001}, {-36.278179562157156`, 32.00000000000001}}],
MouseAppearanceTag["NetworkGraphics"]],
AllowKernelInitialization->False,
UnsavedVariables:>{$CellContext`flag}]],
DefaultBaseStyle->{"NetworkGraphics", FrontEnd`GraphicsHighlightColor -> Hue[0.8, 1., 0.6]},
FrameTicks->None,
GridLinesStyle->Directive[
GrayLevel[0.5, 0.4]]]\)]](https://www.wolframcloud.com/obj/resourcesystem/images/ec3/ec391a9a-e8f2-495c-8241-a79e01b643fd/2865c6e64710c4cd.png) |
| Out[9]= |
By default, EdgeColoring uses Brelaz's heuristic, which does not necessarily give the minimum coloring:
| In[10]:= |
| Out[10]= |  |
| In[11]:= |
| Out[11]= |  |
In this case, a 6-coloring is produced:
| In[12]:= |
| Out[12]= |
The minimum coloring should use only five colors, as given by the chromatic number of the graph:
| In[13]:= |
| Out[13]= |
Obtain a minimum coloring using Method→"Optimum":
| In[14]:= |
| Out[14]= |  |
| In[15]:= |
| Out[15]= |
| In[16]:= |
| Out[16]= | 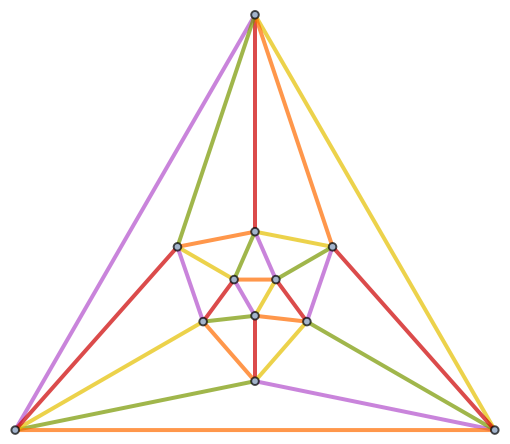 |
EdgeColoring returns a proper edge coloring–that is, a coloring in which no two adjacent edges share the same color:
| In[17]:= |
| In[18]:= |
| Out[18]= | 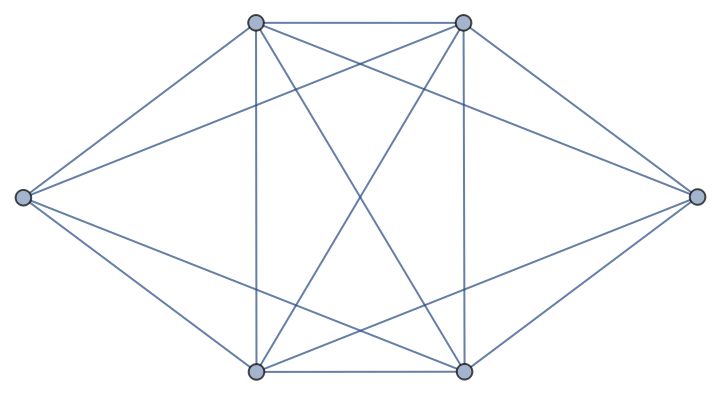 |
| In[19]:= |
| Out[19]= |
| In[20]:= |
| Out[20]= |
Verify by inspection:
| In[21]:= |
| Out[21]= | 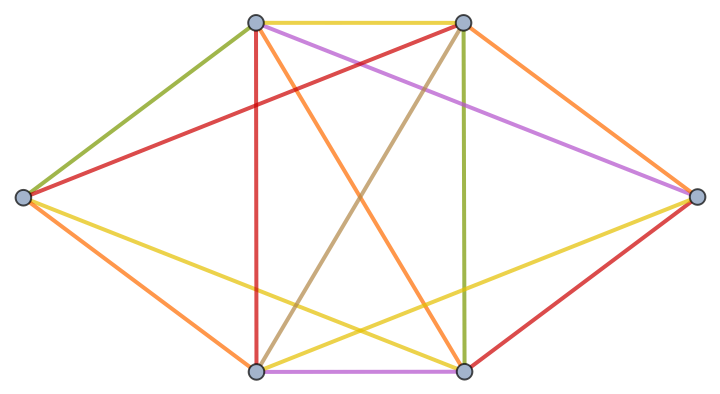 |
Use EdgeTaggedGraph to verify an edge coloring of a multigraph by inspection:
| In[22]:= | ![ResourceFunction["EdgeColoring"][\!\(\*
GraphicsBox[
NamespaceBox["NetworkGraphics",
DynamicModuleBox[{Typeset`graph = HoldComplete[
Graph[{1, 2, 3, 4, 5}, {{{1, 2}, {2, 3}, {2, 3}, {3, 1}, {3, 4}, {4, 5}, {5, 3}},
Null}, {EdgeStyle -> {
Arrowheads[Automatic]}, FormatType -> TraditionalForm, GraphLayout -> {"Dimension" -> 2}, GridLinesStyle -> Directive[
GrayLevel[0.5, 0.4]], VertexLabels -> {"Name"}}]]},
TagBox[GraphicsGroupBox[{
{Hue[0.6, 0.7, 0.5], Opacity[0.7], Arrowheads[Automatic], ArrowBox[{{2.017540424146274, 0.00044208442469451104`}, {
2.017313638325164, 0.8021720910704471}}, 0.022753627728707843`], ArrowBox[BezierCurveBox[{{2.017313638325164, 0.8021720910704471}, {1.5786497609293124`, 0.4357165494909167}, {1.008104154360962, 0.40117133112610454`}}], 0.022753627728707843`], ArrowBox[BezierCurveBox[{{2.017313638325164, 0.8021720910704471}, {1.4467680317568175`, 0.7676268727056339}, {1.008104154360962, 0.40117133112610454`}}], 0.022753627728707843`], ArrowBox[{{1.008104154360962, 0.40117133112610454`}, {
2.017540424146274, 0.00044208442469451104`}}, 0.022753627728707843`], ArrowBox[{{1.008104154360962, 0.40117133112610454`}, {0., 0.}}, 0.022753627728707843`], ArrowBox[{{0., 0.}, {0.00022442750785334198`, 0.8026134080747779}}, 0.022753627728707843`], ArrowBox[{{0.00022442750785334198`, 0.8026134080747779}, {
1.008104154360962, 0.40117133112610454`}}, 0.022753627728707843`]},
{Hue[0.6, 0.2, 0.8], EdgeForm[{GrayLevel[0], Opacity[
0.7]}], {
DiskBox[{2.017540424146274, 0.00044208442469451104}, 0.022753627728707843], InsetBox["1", Offset[{2, 2}, {2.040294051874982, 0.023195712153402354}],
ImageScaled[{0, 0}],
BaseStyle->"Graphics"]}, {
DiskBox[{2.017313638325164, 0.8021720910704471}, 0.022753627728707843], InsetBox["2", Offset[{2, 2}, {2.040067266053872, 0.8249257187991549}], ImageScaled[{0, 0}],
BaseStyle->"Graphics"]}, {
DiskBox[{1.008104154360962, 0.40117133112610454}, 0.022753627728707843], InsetBox["3", Offset[{2, 2}, {1.0308577820896698, 0.4239249588548124}], ImageScaled[{0, 0}],
BaseStyle->"Graphics"]}, {DiskBox[{0., 0.}, 0.022753627728707843], InsetBox["4", Offset[{2, 2}, {0.022753627728707843, 0.022753627728707843}], ImageScaled[{0, 0}],
BaseStyle->"Graphics"]}, {
DiskBox[{0.00022442750785334198, 0.8026134080747779}, 0.022753627728707843], InsetBox["5", Offset[{2, 2}, {0.022978055236561185, 0.8253670358034857}], ImageScaled[{0, 0}],
BaseStyle->"Graphics"]}}}],
MouseAppearanceTag["NetworkGraphics"]],
AllowKernelInitialization->False]],
DefaultBaseStyle->{"NetworkGraphics", FrontEnd`GraphicsHighlightColor -> Hue[0.8, 1., 0.6]},
FormatType->TraditionalForm,
FrameTicks->None,
GridLinesStyle->Directive[
GrayLevel[0.5, 0.4]]]\)]](https://www.wolframcloud.com/obj/resourcesystem/images/ec3/ec391a9a-e8f2-495c-8241-a79e01b643fd/4bb085c2dc3994ac.png) |
| Out[22]= |
| In[23]:= |
| Out[23]= |
| In[24]:= |
| Out[24]= | 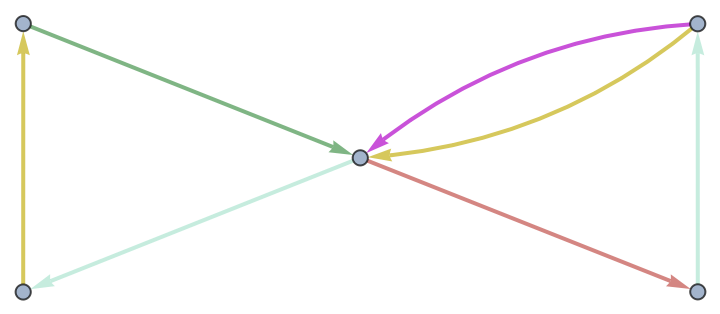 |
This work is licensed under a Creative Commons Attribution 4.0 International License