Wolfram Function Repository
Instant-use add-on functions for the Wolfram Language
Function Repository Resource:
Create a grid graph in the shape of a Klein bottle
ResourceFunction["KleinBottleGraph"][{a,b}] gives an a×b grid connected as a Graph that corresponds to the 1-skeleton of the Klein bottle. | |
ResourceFunction["KleinBottleGraph"][{a,b,n1,…,nk}] gives a graph corresponding to the product of the Klein bottle and a k-torus. |
Make a 3×3 Klein bottle graph:
| In[1]:= |
| Out[1]= | 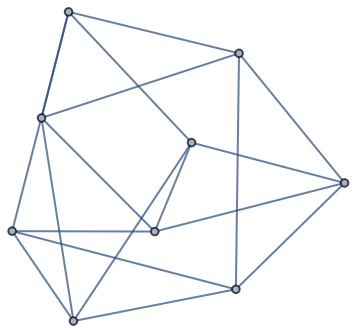 |
Compare to a torus graph:
| In[2]:= |
| Out[2]= | 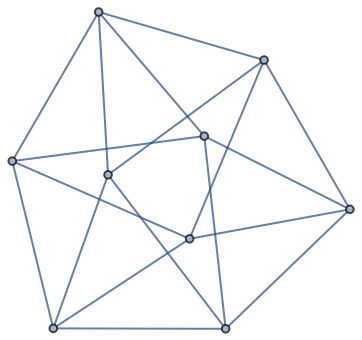 |
Make a 10×20 Klein bottle graph:
| In[3]:= |
| Out[3]= | 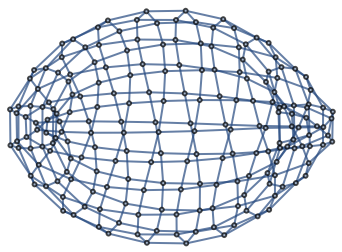 |
Compare to a torus graph:
| In[4]:= |
| Out[4]= |  |
The Klein bottle is a torus with a "twist":
| In[5]:= |
| Out[5]= | 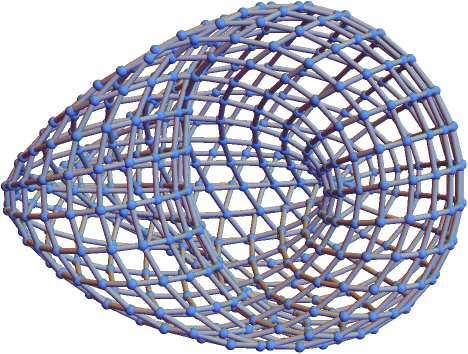 |
Compare to a torus graph:
| In[6]:= |
| Out[6]= | 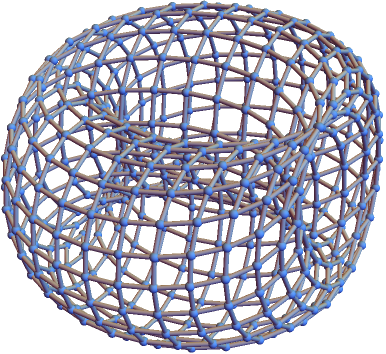 |
Make a 10×15×5 Klein bottle graph:
| In[7]:= |
| Out[7]= | 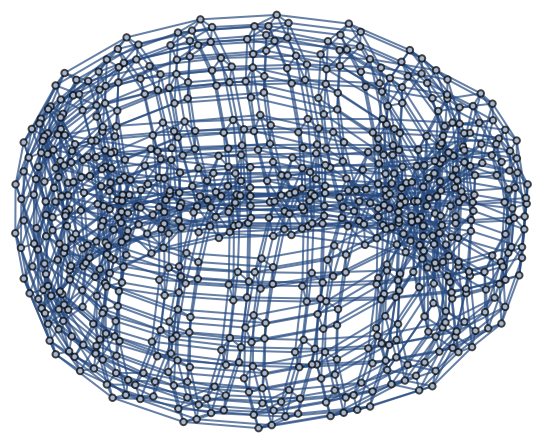 |
Define a torus graph and Klein bottle graph:
| In[8]:= | ![kleinBottle = Graph3D[ResourceFunction["KleinBottleGraph"][{30, 20}]];
torus = Graph3D[ResourceFunction["TorusGraph"][{30, 20}]];](https://www.wolframcloud.com/obj/resourcesystem/images/e98/e98dfee9-6c1c-43b6-ab8e-56cf08da4110/285c7d2616b53023.png) |
Much like the torus, cutting the Klein bottle in one direction yields a cylinder:
| In[9]:= |
| Out[9]= | 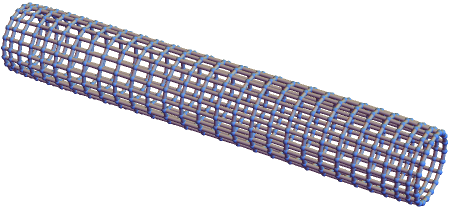 |
| In[10]:= |
| Out[10]= | 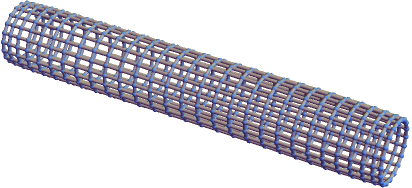 |
However, cutting the Klein bottle in the other direction yields a Möbius strip:
| In[11]:= |
| Out[11]= | 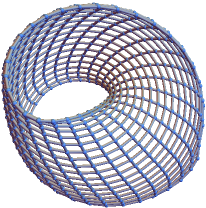 |
The torus still produces a cylinder:
| In[12]:= |
| Out[12]= | 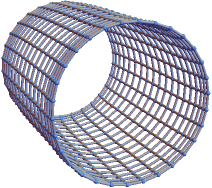 |
In one dimension, KleinBottleGraph is equivalent to TorusGraph:
| In[13]:= |
| Out[13]= | 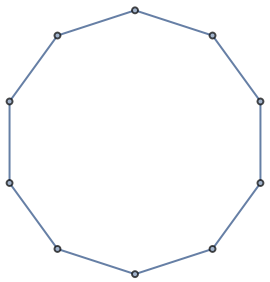 |
| In[14]:= |
| Out[14]= |
Compute the volumes of neighborhoods around a node in the Klein bottle graph:
| In[15]:= | ![Take[First[
ResourceFunction["GraphNeighborhoodVolumes"][
ResourceFunction["KleinBottleGraph"][{50, 50}], "Random" -> 1]], UpTo[25]]](https://www.wolframcloud.com/obj/resourcesystem/images/e98/e98dfee9-6c1c-43b6-ab8e-56cf08da4110/7f3e7ddf523fa5a6.png) |
| Out[15]= |
Estimate the dimension of the Klein bottle from its graph:
| In[16]:= |
| Out[16]= | 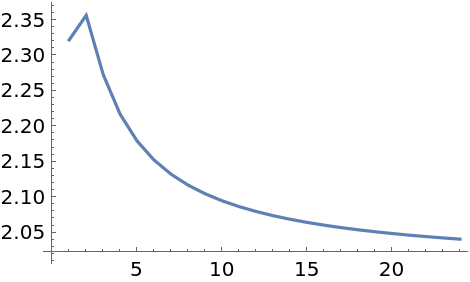 |
This yields the same estimate as the torus:
| In[17]:= |
| Out[17]= |
| In[18]:= |
| Out[18]= |  |
Perform a three-way comparison between grid graphs, toroidal grid graphs and Klein bottle graphs:
| In[19]:= |
| Out[19]= | 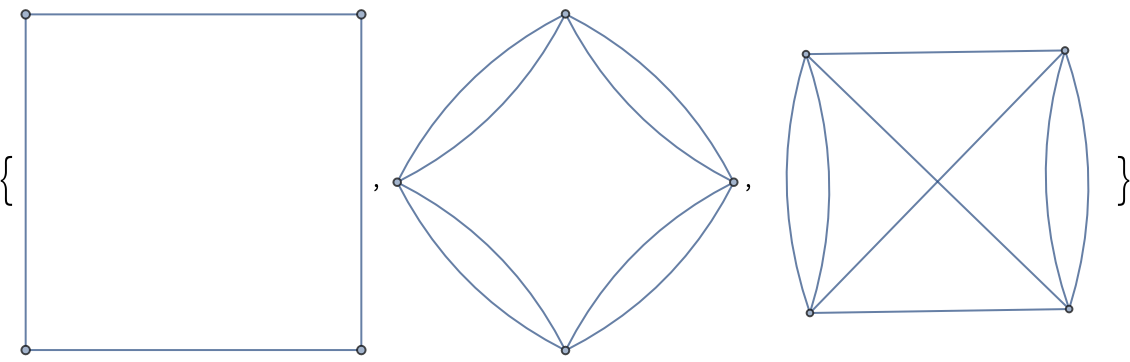 |
| In[20]:= |
| Out[20]= | 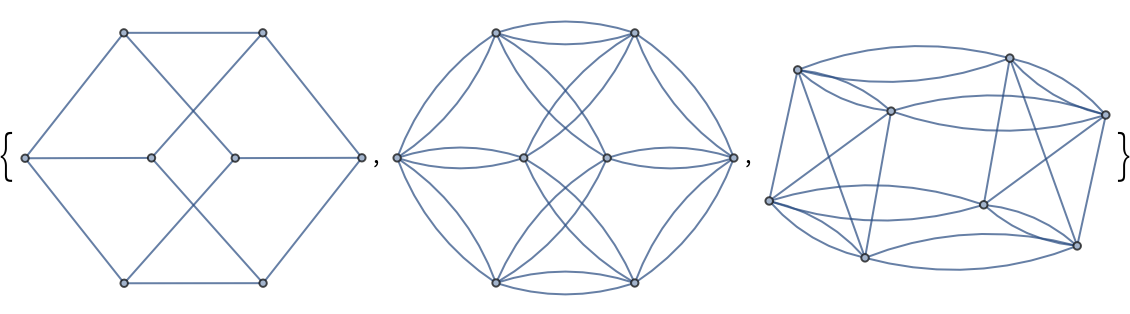 |
| In[21]:= |
| Out[21]= | 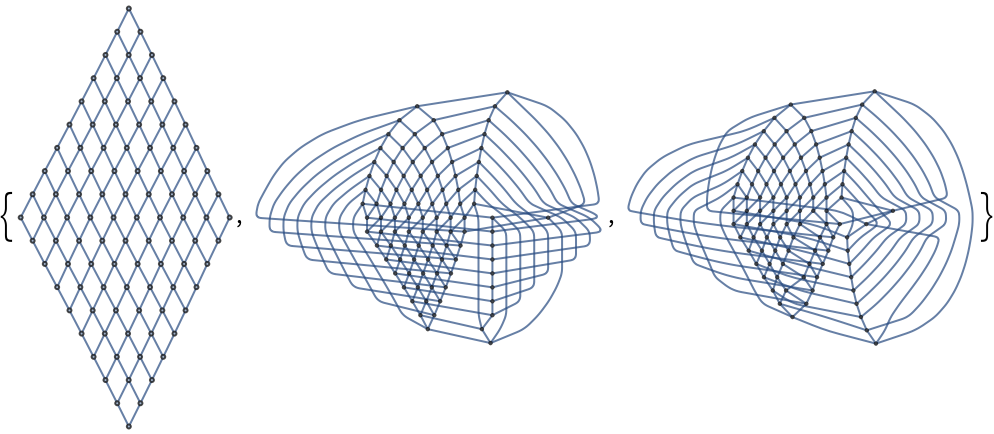 |
Show how a ball of radius r grows in the graph when represented as a flat grid (the red edge indicates where the "twist" occurs):
| In[22]:= | ![DynamicModule[{size, dims, kleinBottle, torus},
size = 20;
dims = {size, size};
kleinBottle = ResourceFunction["KleinBottleGraph"][dims];
torus = ResourceFunction["TorusGraph"][dims];
Manipulate[
Graphics[{
Cuboid /@ VertexList[NeighborhoodGraph[graph, Floor[pt], r]],
Red, Thickness[0.025],
Line[{{1, 1}, {1, size}}],
Line[{{size + 1, 1}, {size + 1, size}}]
}, PlotRange -> {{1, size + 1}, {1, size + 1}}],
{{pt, {2, 6}}, Locator},
{{r, 5}, 0, size, 1},
{graph, {kleinBottle -> "Klein Bottle", torus -> "Torus"}}
]
]](https://www.wolframcloud.com/obj/resourcesystem/images/e98/e98dfee9-6c1c-43b6-ab8e-56cf08da4110/0e9e00df0515bade.png) |
| Out[22]= | 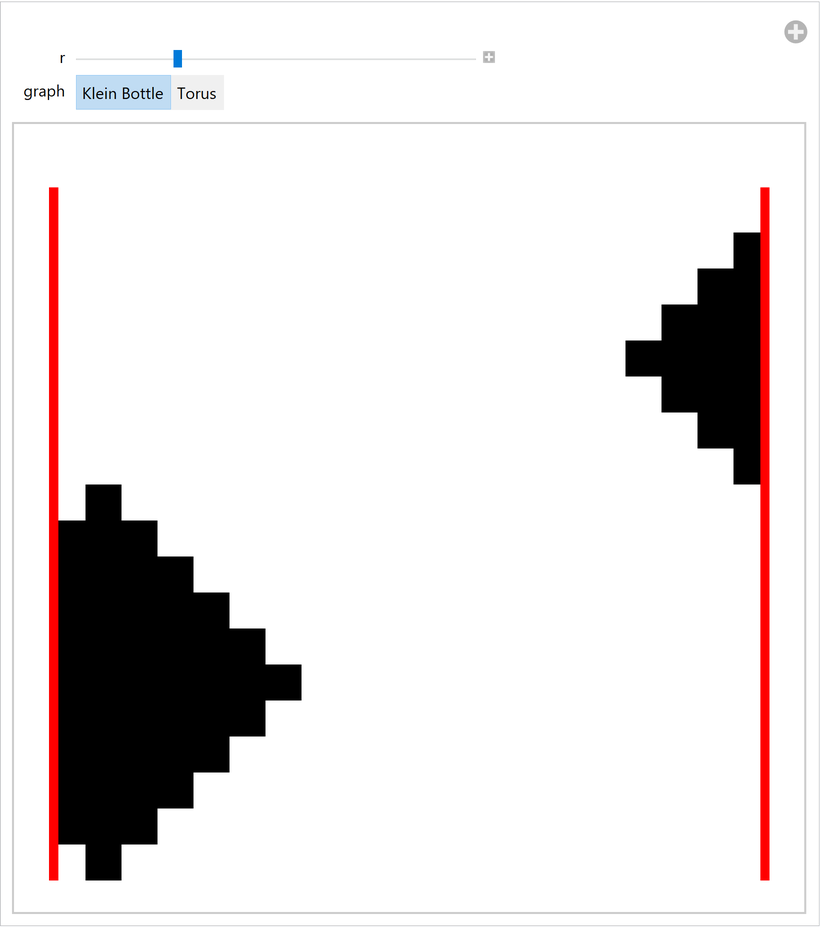 |
Visualize the 3D case:
| In[23]:= | ![DynamicModule[{s, dims, kleinBottle, torus},
s = 20;
dims = {s, s, s};
kleinBottle = ResourceFunction["KleinBottleGraph"][dims];
torus = ResourceFunction["TorusGraph"][dims];
Manipulate[
Graphics3D[{
Cuboid /@ VertexList[NeighborhoodGraph[graph, {x, y, z}, r]],
Red, Opacity[.25],
Polygon[{{1, 1, 1}, {1, s + 1, 1}, {1, s + 1, s + 1}, {1, 1, s + 1}}],
Polygon[{{s + 1, 1, 1}, {s + 1, s + 1, 1}, {s + 1, s + 1, s + 1}, {s + 1, 1, s + 1}}]
}, PlotRange -> {{1, s + 1}, {1, s + 1}, {1, s + 1}}],
{{x, 1}, 1, s, 1},
{{y, 5}, 1, s, 1},
{{z, 5}, 1, s, 1},
{{r, 4}, 0, s, 1},
{graph, {kleinBottle -> "Klein Bottle", torus -> "Torus"}}
]
]](https://www.wolframcloud.com/obj/resourcesystem/images/e98/e98dfee9-6c1c-43b6-ab8e-56cf08da4110/62a930ac31f4c6ea.png) |
| Out[23]= | 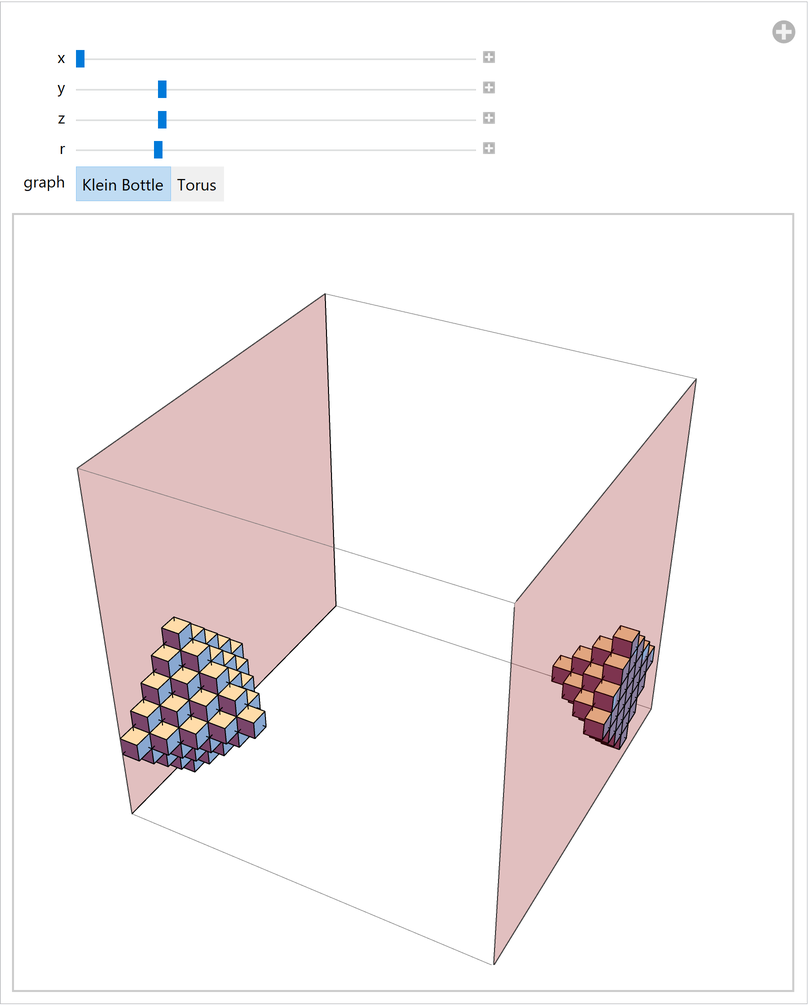 |
This work is licensed under a Creative Commons Attribution 4.0 International License