Wolfram Function Repository
Instant-use add-on functions for the Wolfram Language
Function Repository Resource:
Convert an ordinary Graphics3D object to a sketch-styled raster image
ResourceFunction["Graphics3DSketch"][expr] converts expr to a sketch-styled raster image. | |
ResourceFunction["Graphics3DSketch"][expr,f] converts expr to a sketch-styled raster image, applying f to lines that are obscured. |
| "DashStyle" | {Dashing[0.01], AbsoluteThickness[2]} | style to use for obscured lines |
Create a Graphics3D expression with various primitives (supported types include Polygon, Cuboid, Cone, Cylinder, Sphere, etc.):
| In[1]:= | ![basegraph = Graphics3D[{
RGBColor[0.5, 0.5, 1.], Cylinder[{{0, 0, -1}, {0, 0, 1}}]
, RGBColor[1, 0, 0], Sphere[{0, 0, 2}]
, GrayLevel[0], Line[{{-2, 0, 2}, {2, 0, 2}, {0, 0, 4}, {-2, 0, 2}}]
, RGBColor[1, 1, 0], Polygon[{{-3, -3, -2}, {-3, 3, -2}, {3, 3, -2}, {3, -3, -2}}]
, RGBColor[0, 1, 0], Cuboid[{-2, -2, -2}, {2, 2, -1}]
}, Boxed -> False]](https://www.wolframcloud.com/obj/resourcesystem/images/e7a/e7a1a0b0-7d43-4638-bda3-80127494afa1/442e42d9e9cd2597.png) |
| Out[1]= | 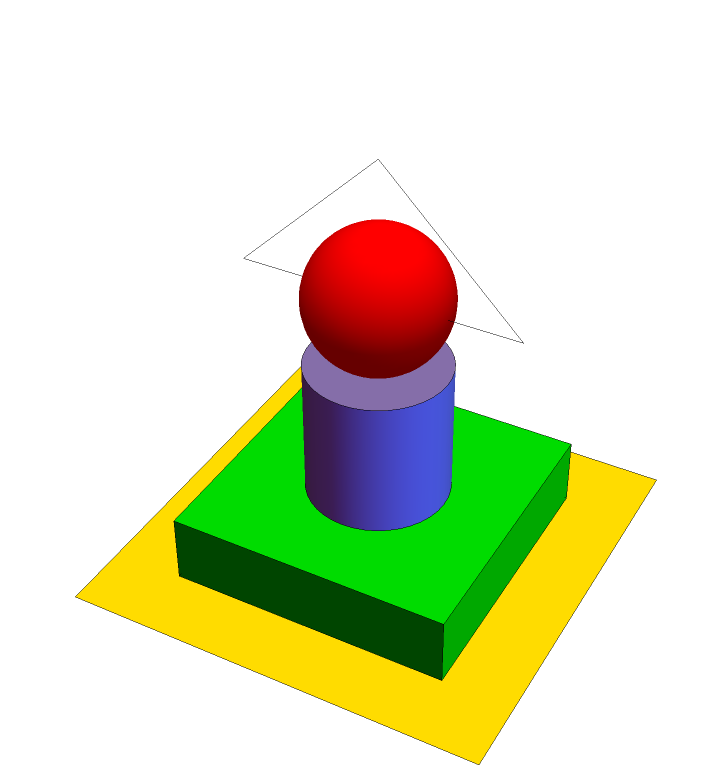 |
Graphics3DSketch will convert all obscured lines to dashed lines:
| In[2]:= |
| Out[2]= | 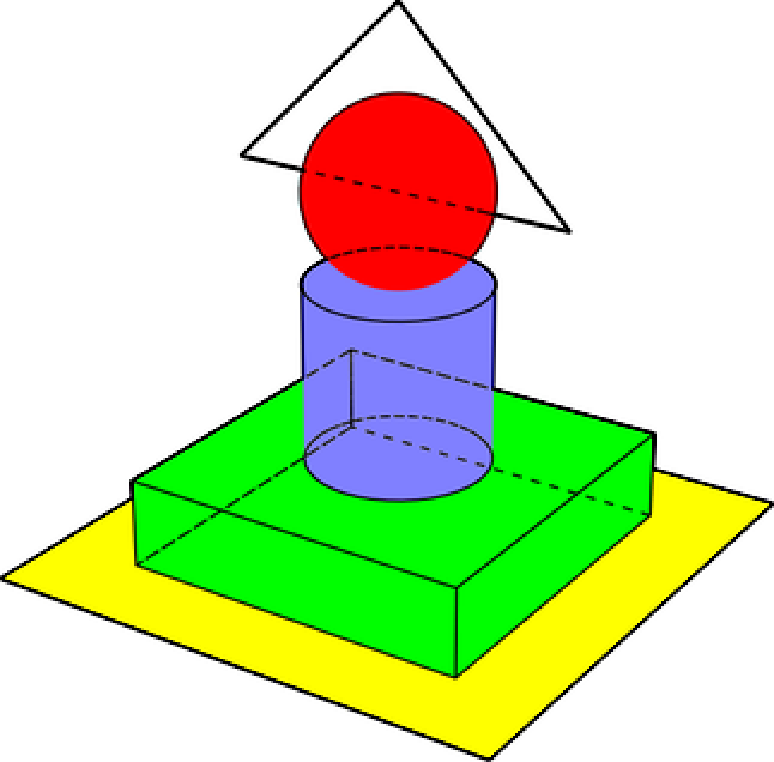 |
An additional image effect function can be used on lines in "shadow region":
| In[3]:= | ![imgFilter = RightComposition[
Blur[#, 3] &
, EdgeDetect[#, 1] &
];
ResourceFunction["Graphics3DSketch"][basegraph, imgFilter]](https://www.wolframcloud.com/obj/resourcesystem/images/e7a/e7a1a0b0-7d43-4638-bda3-80127494afa1/45a4e2cb5661d2c9.png) |
| Out[3]= | 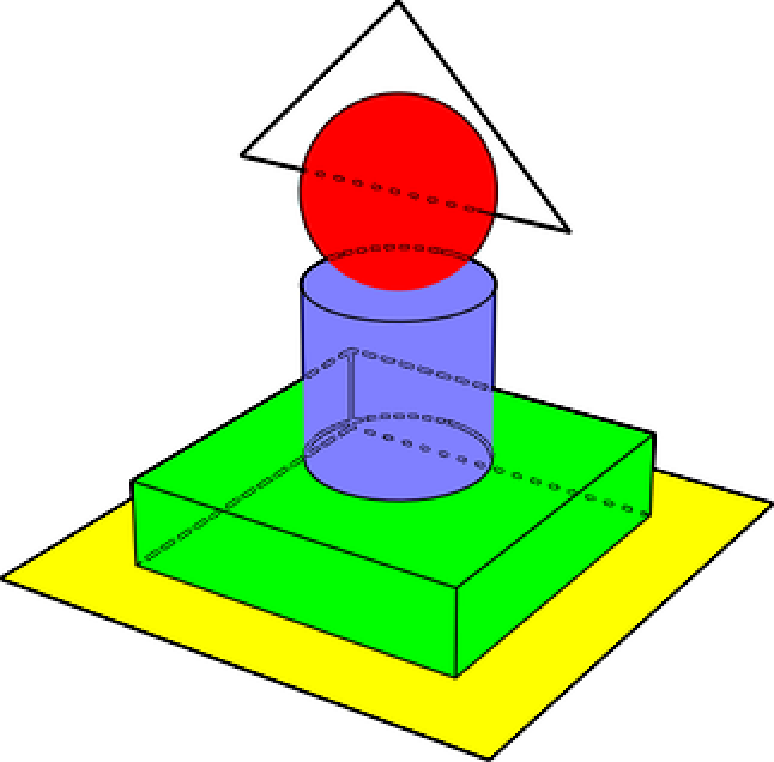 |
Graphics3D expressions generated by various 3D-plotting functions can be fed into Graphics3DSketch directly:
| In[4]:= | ![basegraph = Show[{
SphericalPlot3D[
1, {\[Theta], 0.24 \[Pi], \[Pi]/2}, {\[Phi], 0, 1.8 \[Pi]},
PlotStyle -> White,
PlotPoints -> 50, Mesh -> None, BoundaryStyle -> Black]
,
SphericalPlot3D[
1, {\[Theta], 0, \[Pi]/5}, {\[Phi], \[Pi]/4, 2.1 \[Pi]},
PlotStyle -> FaceForm[Lighter[Blue, .5], GrayLevel[.9]],
PlotPoints -> 50, Mesh -> None, BoundaryStyle -> Black]
,
Graphics3D[{FaceForm[Lighter[Pink, .8], GrayLevel[.8]], Cylinder[{{0, 0, 0}, {0, 0, .8 Cos[\[Pi]/5.]}}, Sin[\[Pi]/5.]]}]
}
,
PlotRange -> 1.2 {{-1, 1}, {-1, 1}, {0, 1}}, AxesOrigin -> {0, 0, 0}, Boxed -> False,
SphericalRegion -> True]](https://www.wolframcloud.com/obj/resourcesystem/images/e7a/e7a1a0b0-7d43-4638-bda3-80127494afa1/4bde75849c01a860.png) |
| Out[4]= | 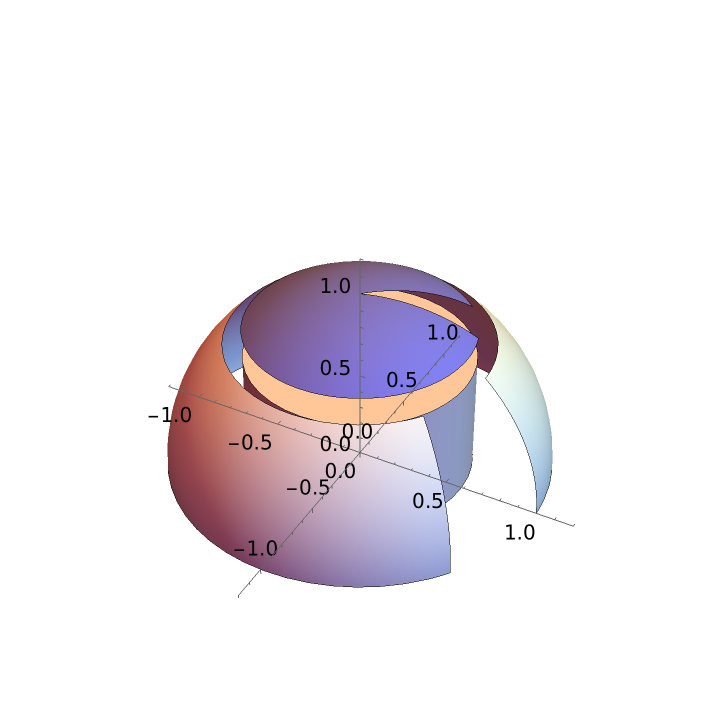 |
| In[5]:= |
| Out[5]= | 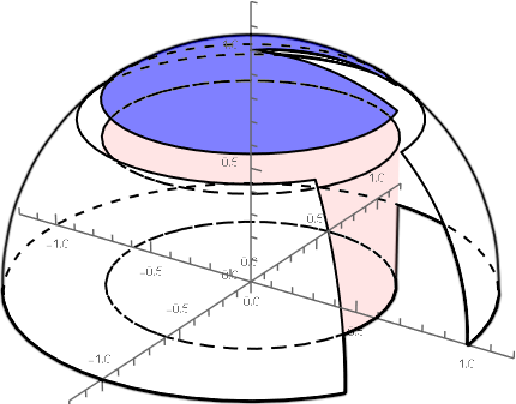 |
Any image effect can be used on the "shadow region". It will only affect the style of lines:
| In[6]:= | ![basegraph = ParametricPlot3D[
{u Cos[v], u Sin[v], Im[(u Exp[I v]^5)^(1/5)]},
{u, 0, 2}, {v, 0, 2 \[Pi]},
PlotPoints -> 100, Mesh -> {2, 5}, MeshStyle -> Red, Boxed -> False,
BoundaryStyle -> Black, ExclusionsStyle -> {None, Black},(*PlotStyle\[Rule]White,*)
Lighting -> "Neutral"
, PlotStyle -> Directive[
Texture[ImageAdd[ExampleData[{"TestImage", "Ruler"}], .5]]]
, TextureCoordinateFunction -> ({#4, 4 #5} &)
]](https://www.wolframcloud.com/obj/resourcesystem/images/e7a/e7a1a0b0-7d43-4638-bda3-80127494afa1/3edb5a29904f42a9.png) |
| Out[6]= | 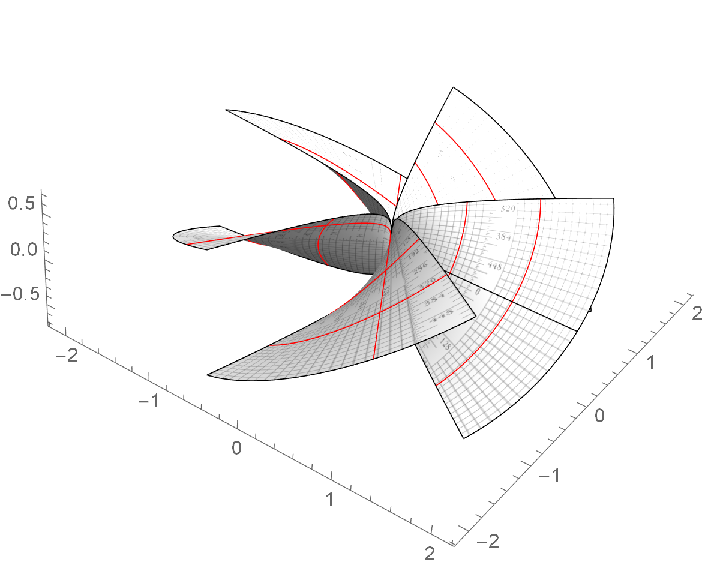 |
| In[7]:= |
| Out[7]= | 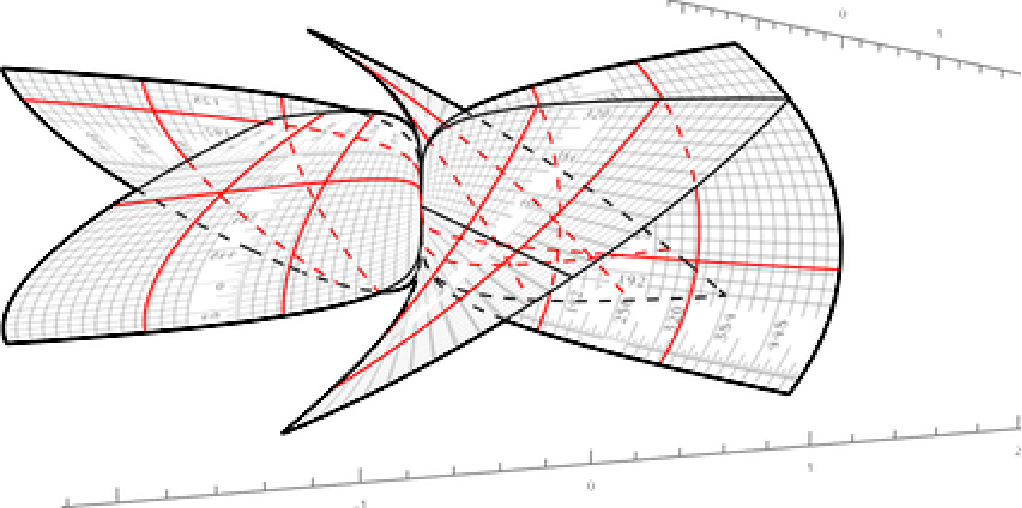 |
| In[8]:= | ![ResourceFunction["Graphics3DSketch"][basegraph
, Blur[#, 5] &
, ViewPoint -> {3, -1, 0.5}, ImageSize -> 1000
]](https://www.wolframcloud.com/obj/resourcesystem/images/e7a/e7a1a0b0-7d43-4638-bda3-80127494afa1/1563a1faede4bd1b.png) |
| Out[8]= | 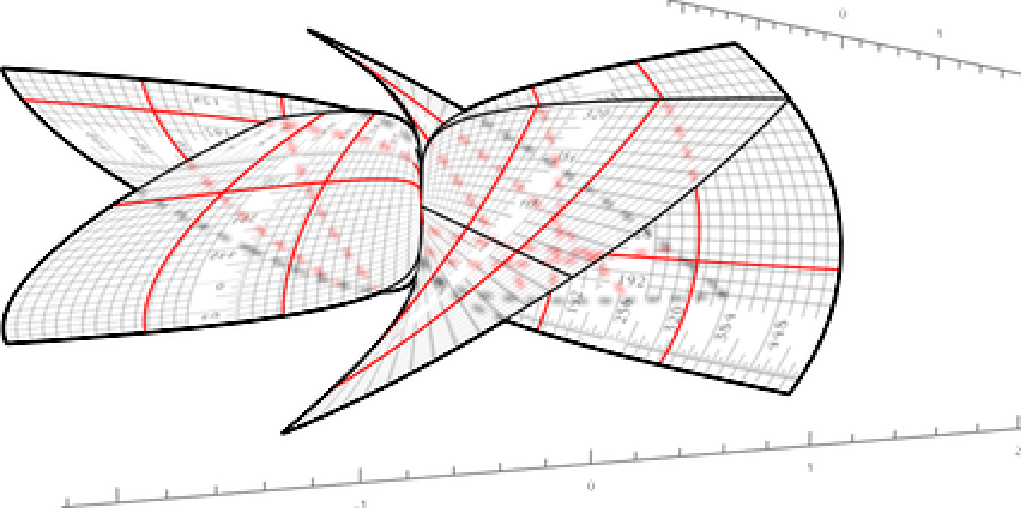 |
| In[9]:= | ![ResourceFunction["Graphics3DSketch"][basegraph
, RightComposition[
ImageEffect[Blur[#, 10], {"OilPainting", 5}] &
, ImageAdjust
, ImageAdjust[#, {0, 0, 2}] &
]
, ViewPoint -> {3, -1, 0.5}, ImageSize -> 1000
]](https://www.wolframcloud.com/obj/resourcesystem/images/e7a/e7a1a0b0-7d43-4638-bda3-80127494afa1/4342a691230845d6.png) |
| Out[9]= | 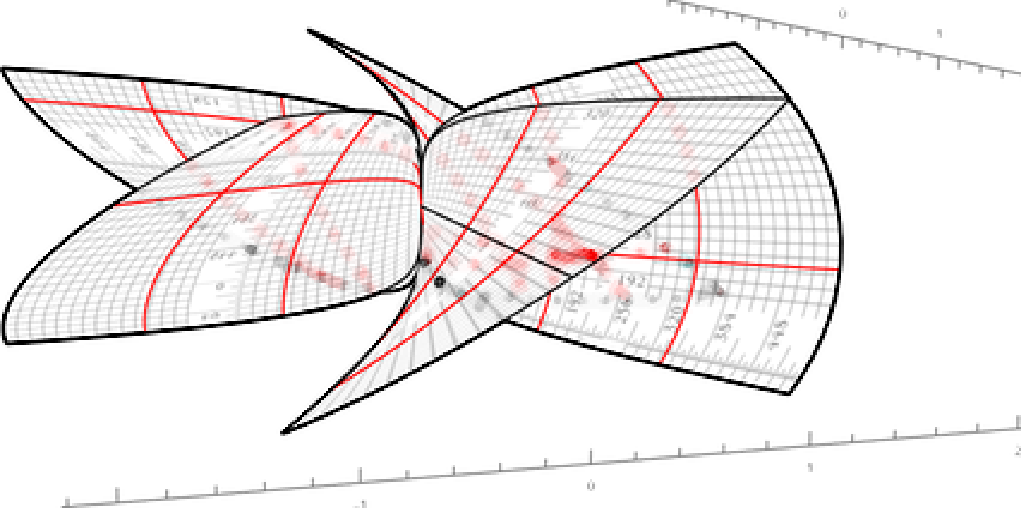 |
Create a base graphic:
| In[10]:= | ![basegraph = Show[{
SphericalPlot3D[
1, {\[Theta], 0.24 \[Pi], \[Pi]/2}, {\[Phi], 0, 1.8 \[Pi]},
PlotStyle -> White,
PlotPoints -> 50, Mesh -> None, BoundaryStyle -> Black]
,
SphericalPlot3D[
1, {\[Theta], 0, \[Pi]/5}, {\[Phi], \[Pi]/4, 2.1 \[Pi]},
PlotStyle -> FaceForm[Lighter[Blue, .5], GrayLevel[.9]],
PlotPoints -> 50, Mesh -> None, BoundaryStyle -> Black]
,
Graphics3D[{FaceForm[Lighter[Pink, .8], GrayLevel[.8]], Cylinder[{{0, 0, 0}, {0, 0, .8 Cos[\[Pi]/5.]}}, Sin[\[Pi]/5.]]}]
}
,
PlotRange -> 1.2 {{-1, 1}, {-1, 1}, {0, 1}}, AxesOrigin -> {0, 0, 0}, Boxed -> False,
SphericalRegion -> True];](https://www.wolframcloud.com/obj/resourcesystem/images/e7a/e7a1a0b0-7d43-4638-bda3-80127494afa1/2962825030a1172c.png) |
The option "DashStyle"→{style1,style2,…} can be given to alter the style of the lines in the "shadow region":
| In[11]:= |
| Out[11]= | 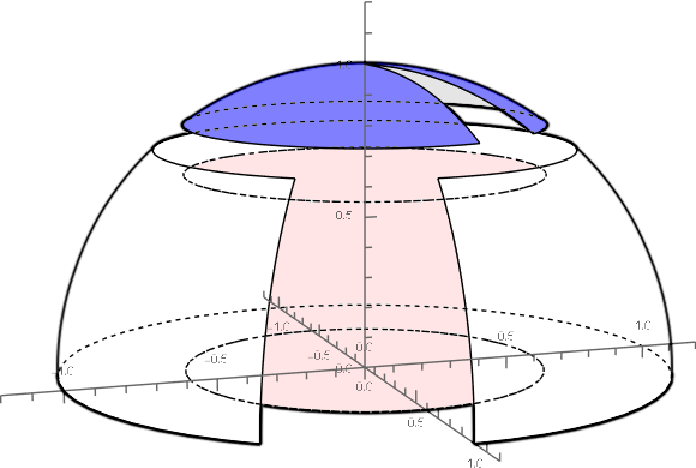 |
| In[12]:= |
| Out[12]= | 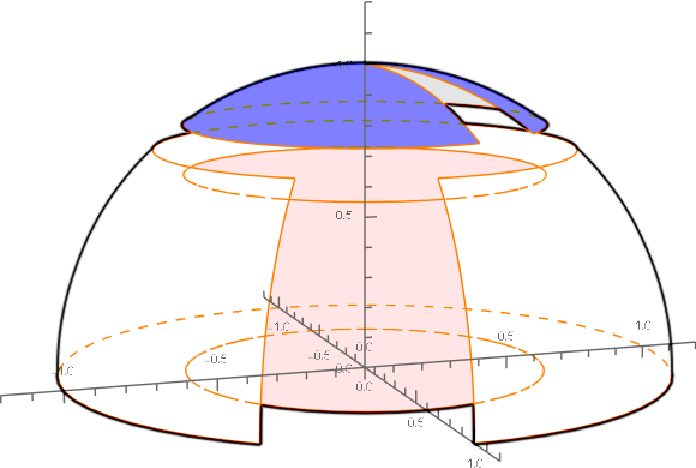 |
The option Lighting can be given to alter the simulated lighting used for coloring the 3D surfaces:
| In[13]:= |
| Out[13]= | 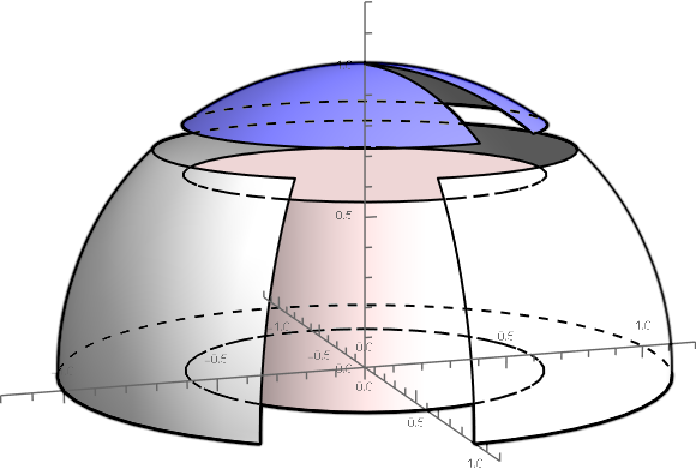 |
| In[14]:= |
| Out[14]= | 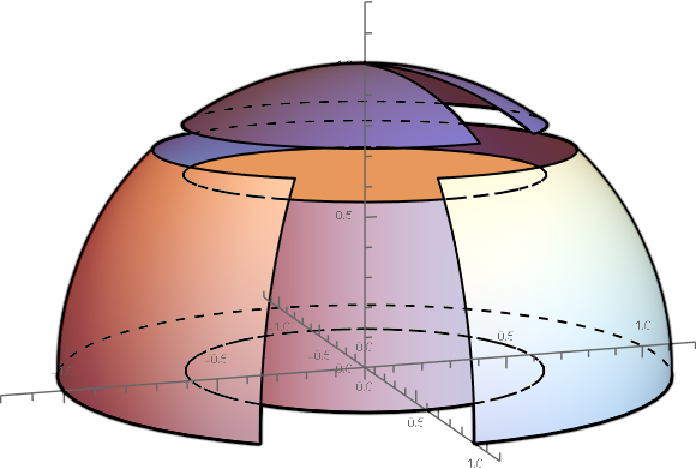 |
The result of Graphics3DSketch is a raster image rather than an interactive 3D object:
| In[15]:= |
| Out[15]= |
Due to the image-processing-based working principle of Graphics3DSketch, lines in the "shadow region" are not necessarily hidden in the 3D rendering sense:
| In[16]:= | ![ResourceFunction["Graphics3DSketch"][Show[{
SphericalPlot3D[
1, {\[Theta], 0.24 \[Pi], \[Pi]/2}, {\[Phi], 0, 1.8 \[Pi]},
PlotStyle -> White,
PlotPoints -> 50, Mesh -> None, BoundaryStyle -> Black]
,
SphericalPlot3D[
1, {\[Theta], 0, \[Pi]/5}, {\[Phi], \[Pi]/4, 2.1 \[Pi]},
PlotStyle -> FaceForm[Lighter[Blue, .5], GrayLevel[.9]],
PlotPoints -> 50, Mesh -> None, BoundaryStyle -> Black]
,
Graphics3D[{FaceForm[Lighter[Pink, .8], GrayLevel[.8]], Cylinder[{{0, 0, 0}, {0, 0, .8 Cos[\[Pi]/5.]}}, Sin[\[Pi]/5.]]}]
}
,
PlotRange -> 1.2 {{-1, 1}, {-1, 1}, {0, 1}}, AxesOrigin -> {0, 0, 0}, Boxed -> False,
SphericalRegion -> True], "DashStyle" -> {Dashing[.01], Red, AbsoluteThickness[3]}]](https://www.wolframcloud.com/obj/resourcesystem/images/e7a/e7a1a0b0-7d43-4638-bda3-80127494afa1/0dcce92173e051c5.png) |
| Out[16]= | 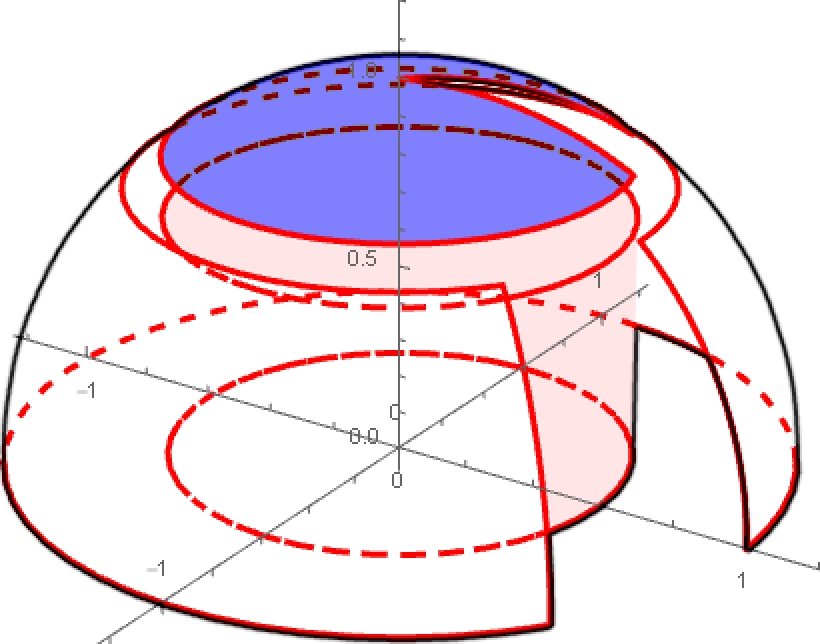 |
This work is licensed under a Creative Commons Attribution 4.0 International License