Wolfram Function Repository
Instant-use add-on functions for the Wolfram Language
Function Repository Resource:
Plot a quadric surface, automatically determining the regions of interest, view direction and scaling
ResourceFunction["QuadricPlot3D"][poly] plots the quadric surface given by poly==0. | |
ResourceFunction["QuadricPlot3D"][poly1==poly2] plots the quadric surface given by poly1==poly2. | |
ResourceFunction["QuadricPlot3D"][poly,"ShowCode"] returns the code used to create the plot, wrapped in Hold. |
A hyperboloid of one sheet:
| In[1]:= |
| Out[1]= | 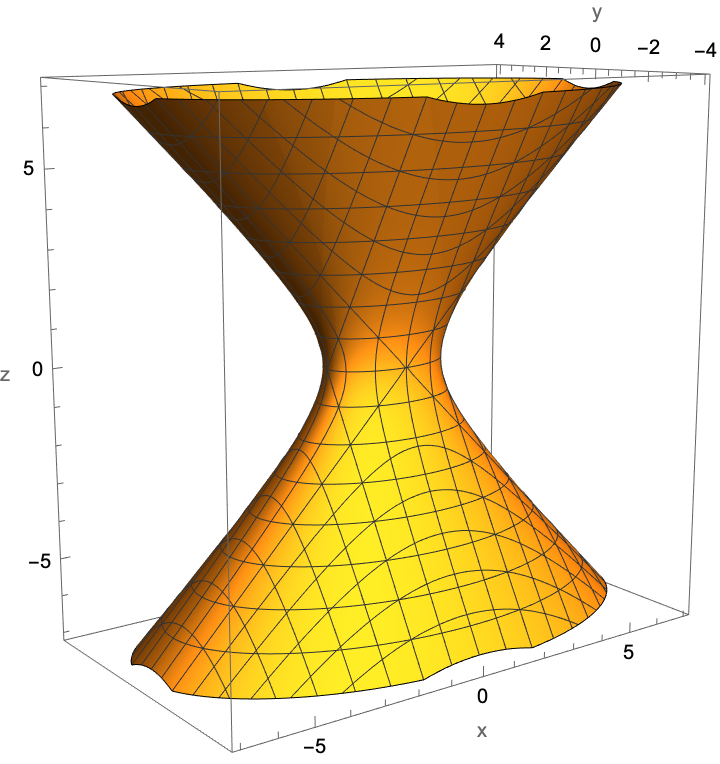 |
A hyperboloid of two sheets, entered in equation form:
| In[2]:= |
| Out[2]= | 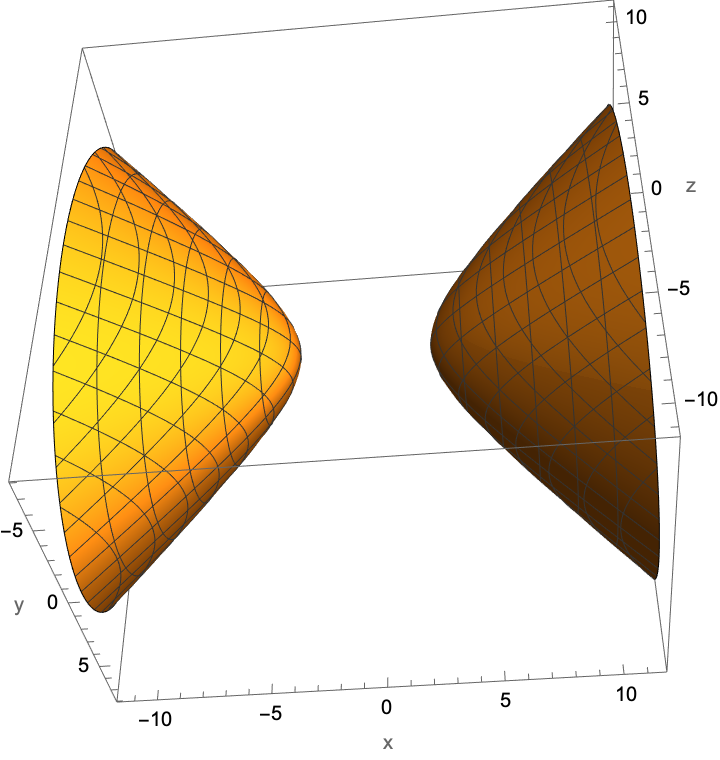 |
Return the code used to create an ellipsoid plot:
| In[3]:= |
| Out[3]= |  |
Now deploy that code:
| In[4]:= |
| Out[4]= | 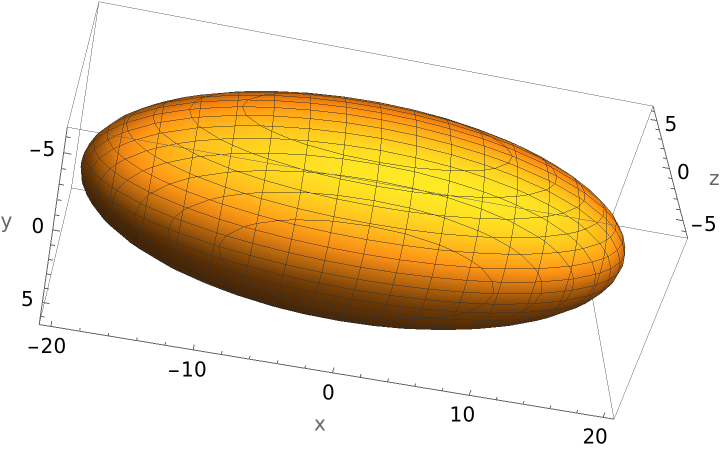 |
Plot a paraboloid:
| In[5]:= |
| Out[5]= | 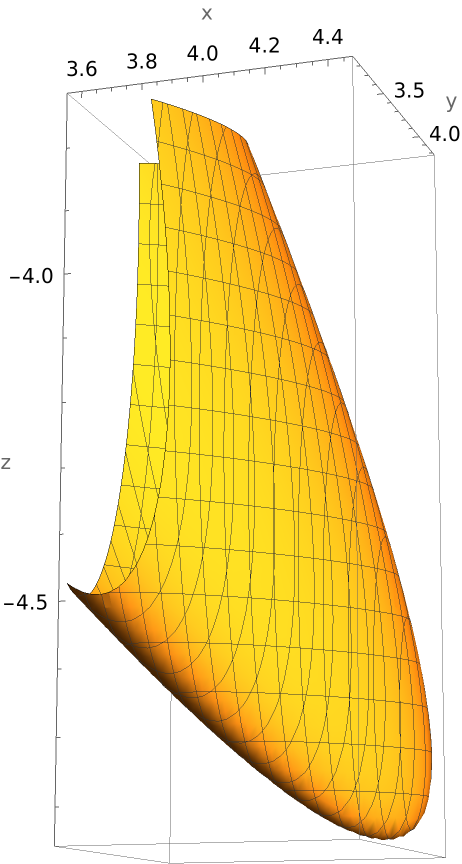 |
QuadricPlot3D handles degenerate quadrics.
Plot a cone:
| In[6]:= |
| Out[6]= | 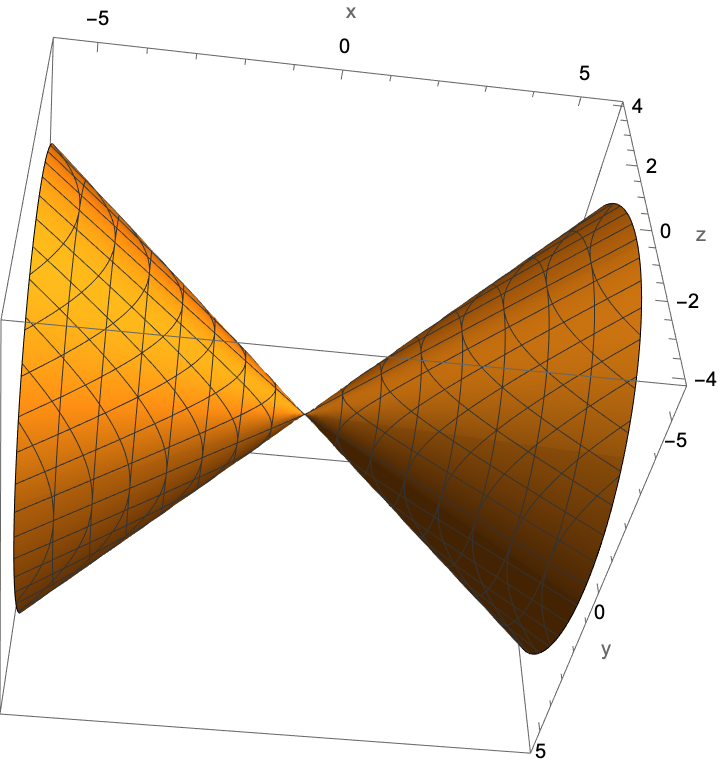 |
Plot a pair of intersecting planes:
| In[7]:= |
| Out[7]= | 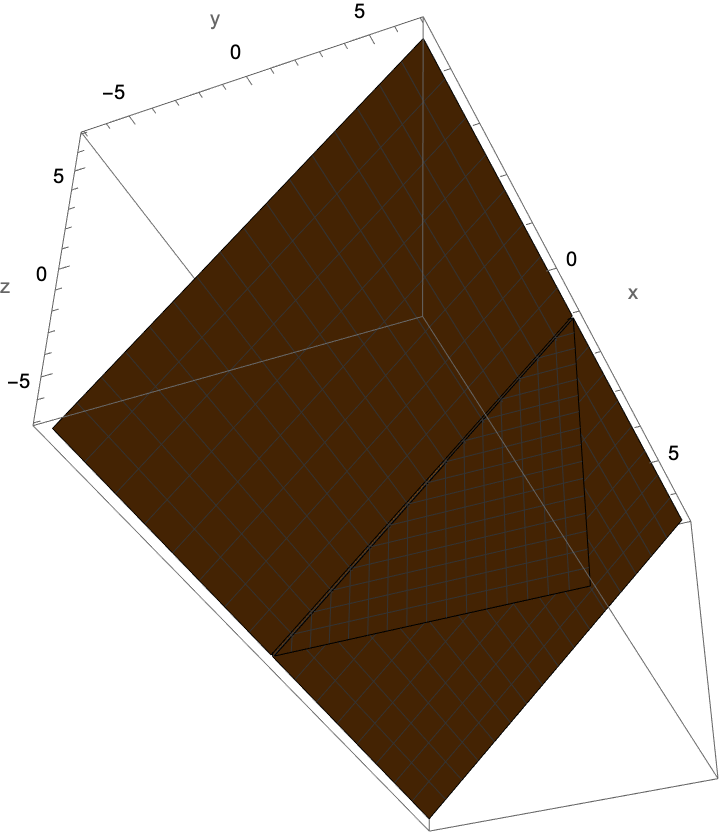 |
These are intersecting planes because the polynomial factors:
| In[8]:= |
| Out[8]= |
Plot a parabolic cylinder:
| In[9]:= |
| Out[9]= | 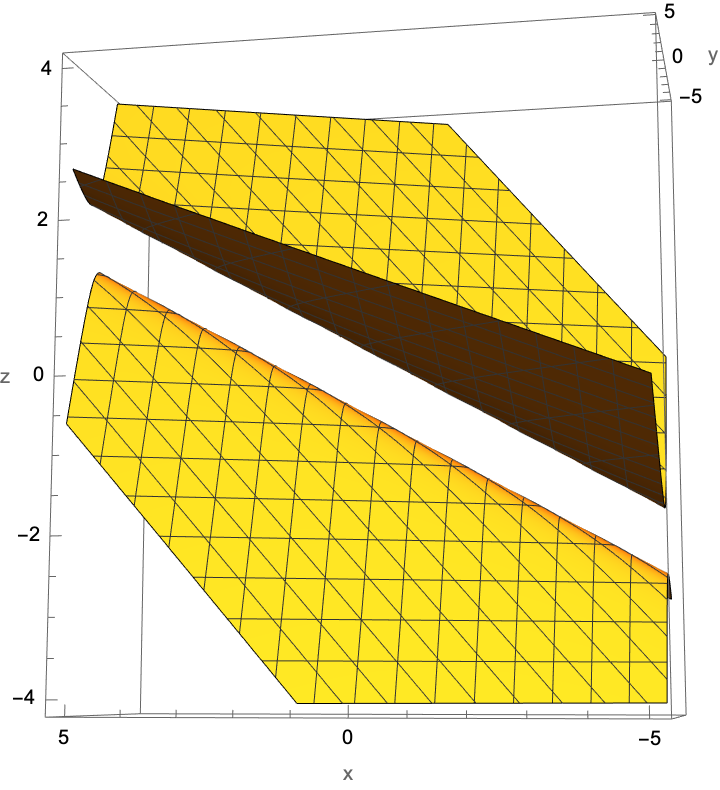 |
Plot some "random" quadrics:
| In[10]:= |
| In[11]:= |
| In[12]:= |
| Out[12]= | 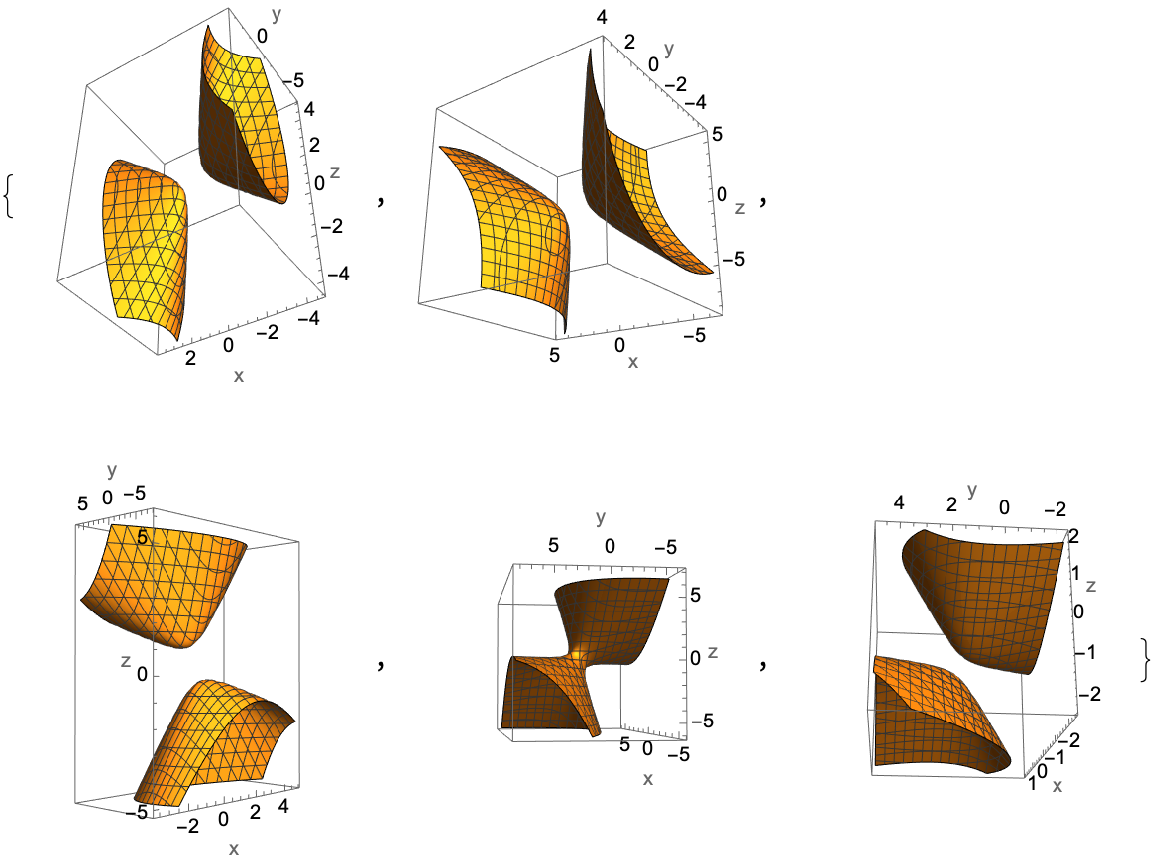 |
QuadricPlot3D will return unevaluated if the argument is not discernibly a polynomial of total degree 2 in three variables:
| In[13]:= |
| Out[13]= |
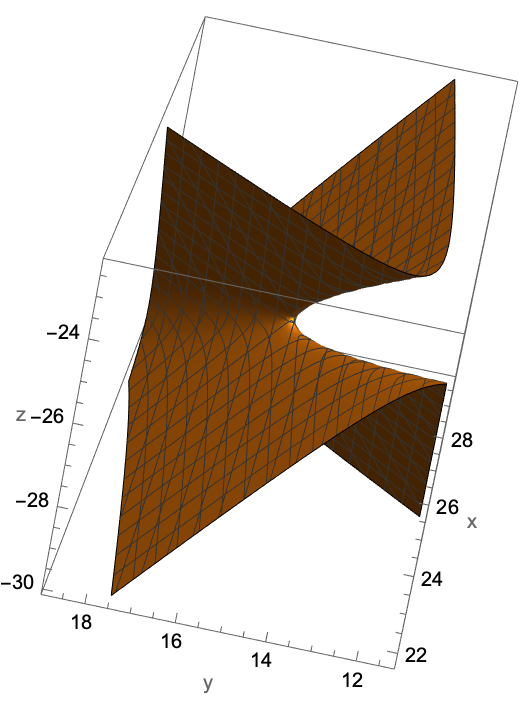
For some quadrics, e.g. "thin" hyperboloids of one sheet, QuadricPlot3D may show a view that obscures a part of the saddle:
| In[14]:= |
| Out[14]= |  |
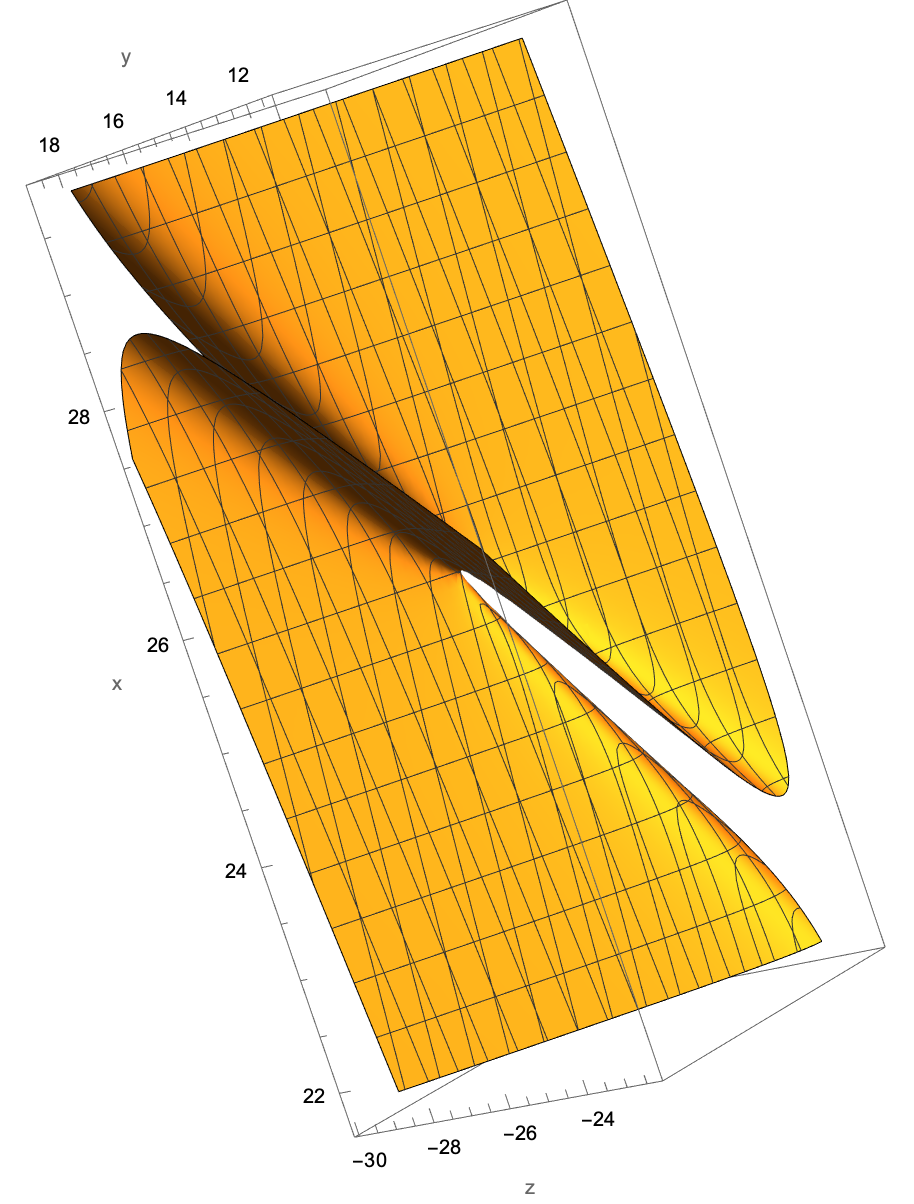
One can get different views simply by rotating using the mouse:
3D graphic objects can be large:
| In[15]:= |
| Out[15]= |  |
| In[16]:= |
| Out[16]= |
One can reduce this considerably by rasterizing the 3D graphic object:
| In[17]:= |
| Out[17]= |
There is good fidelity in the rasterized image (though it can no longer be rotated):
| In[18]:= |
| Out[18]= | 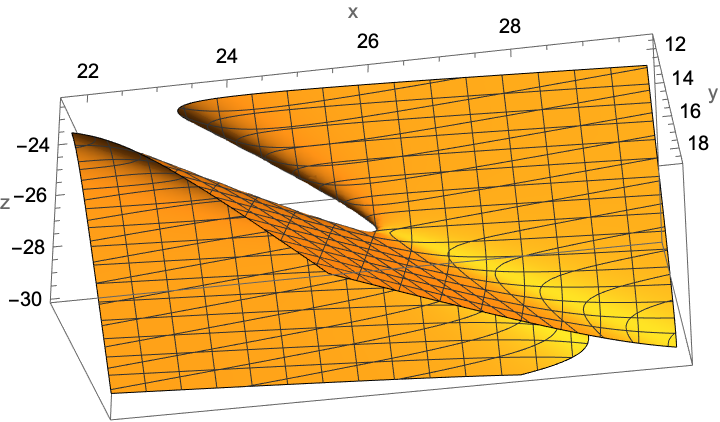 |
| In[19]:= |
| Out[19]= | 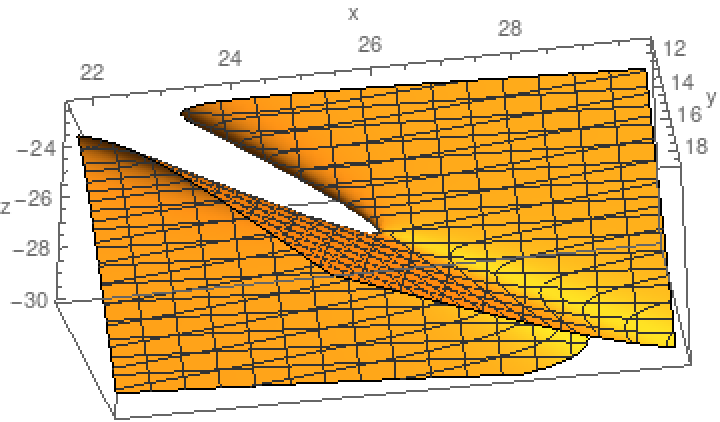 |
Wolfram Language 11.3 (March 2018) or above
This work is licensed under a Creative Commons Attribution 4.0 International License