Wolfram Function Repository
Instant-use add-on functions for the Wolfram Language
Function Repository Resource:
Give a contour plot of a function together with the projections onto the xy-plane of the given sections of the plot
ResourceFunction["SectionContourPlot"][f,{x,xmin,xmax},{y,ymin,ymax},opts] plots the projections onto the xy-plane of the sections of the surface specified with the options "XSection","YSection","ZSection","VSection" and "OSection". | |
ResourceFunction["SectionContourPlot"][f,{x,xmin,xmax},{y,ymin,ymax},{{gx,gy},…},{t,tmin,tmax}] plots the projections onto the xy-plane of the sections of the surface determined by the cylinders described parametrically by {{gx,gy},…},{t,tmin,tmax}, together with the projections onto the xy-plane of the other sections specified with the options "XSection","YSection","ZSection","VSection" and "OSection". |
| "DrawPoint" | {} | a list of points to be included in the plot |
| "DrawPointStyle" | {{Red,PointSize[Large]}} | styles to be applied to the points specified with the option "DrawPoint" |
| "DrawGradient" | {} | a list of points at which to draw the gradient |
| "GradientStyle | {{Black,PointSize[Medium]}} | styles to be applied to the gradient vectors |
| "OSection" | {} | draws the projection onto the xy-plane of an oblique section determined by functions of the form z=f[x],z=g[y] or z=h[x,y] |
| "OSectionStyle" | {{Red,Thickness[.01]}} | styles to be applied to the oblique sections |
| "PlotPointsSection" | 75 | specifies how many initial sample points to use in plotting sections |
| "SectionStyle" | {Red,Thickness[.01]} | styles to be applied to sections defined parametrically by {gx,gy} |
| "VSection" | {} | draws the projection onto the xy-plane of vertical sections for a function or list of functions of the form y=f[x] or x=g[y] |
| "VSectionStyle" | {Red,Thickness[.01]} | styles to be applied to the vertical sections |
| "XSection" | {} | draws the projection onto the xy-plane of vertical sections parallel to the yz-plane determined by the value or list of values of x |
| "XSectionStyle" | {Red,Thickness[.01]} | styles to be applied to the x-sections |
| "YSection" | {} | draws the projection onto the xy-plane of vertical sections parallel to the xz-plane determined by the value or list of values of y |
| "YSectionStyle" | {Red,Thickness[.01]} | styles to be applied to the y-sections |
| "ZSection" | {} | draws the projection onto the xy-plane of horizontal sections parallel to the xy-plane determined by the value or list of values of z |
| "ZSectionStyle" | {Red,Thickness[.01]} | styles to be applied to the z-sections |
A contour plot with projections of an x-section and an oblique section:
| In[1]:= |
| Out[1]= | 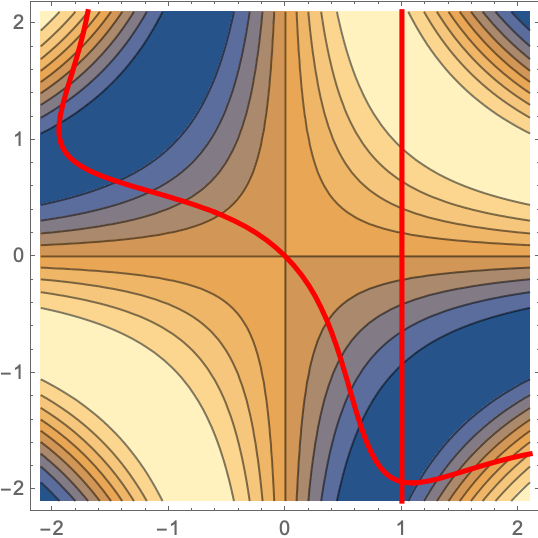 |
Display the resource function SectionPlot3D and SectionContourPlot as a row:
| In[2]:= | ![GraphicsRow[{ResourceFunction["SectionPlot3D"][
Sin[x y], {x, -2, 2}, {y, -2, 2}, "XSection" -> 1, "OSection" -> x + y, "OSectionStyle" -> Tube[.03]], ResourceFunction["SectionContourPlot"][
Sin[x y], {x, -2, 2}, {y, -2, 2}, "XSection" -> 1, "OSection" -> x + y]}, ImageSize -> Large]](https://www.wolframcloud.com/obj/resourcesystem/images/e00/e008b926-7725-4761-b7a1-044d11fa9046/0c5f28e339473361.png) |
| Out[2]= | 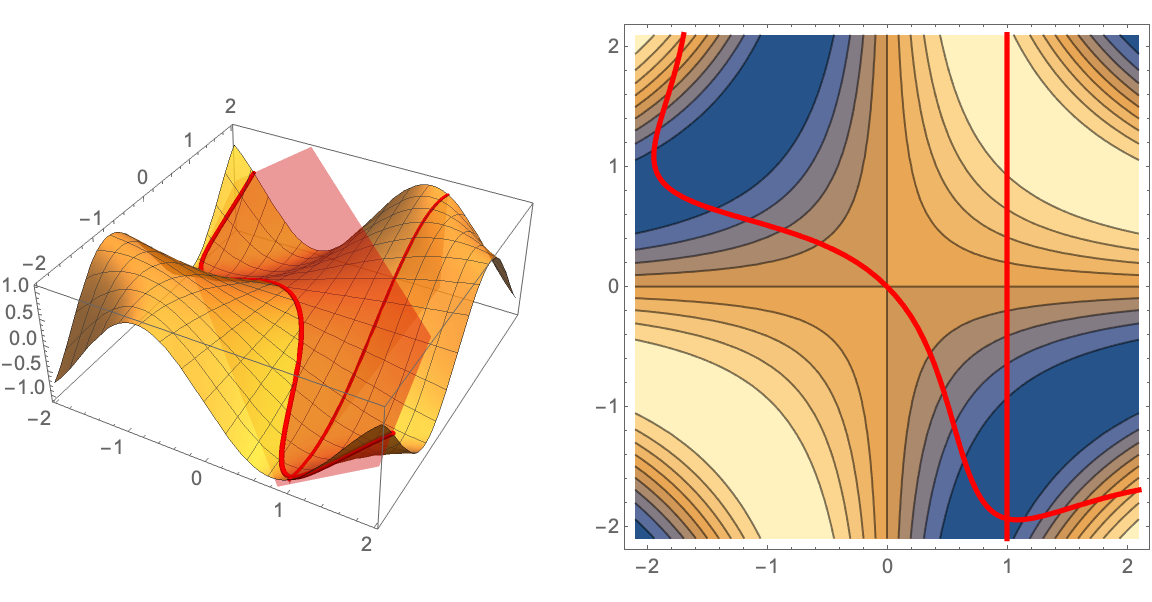 |
A contour plot with the projection onto the xy-plane of a cylinder and a z-section:
| In[3]:= |
| Out[3]= | 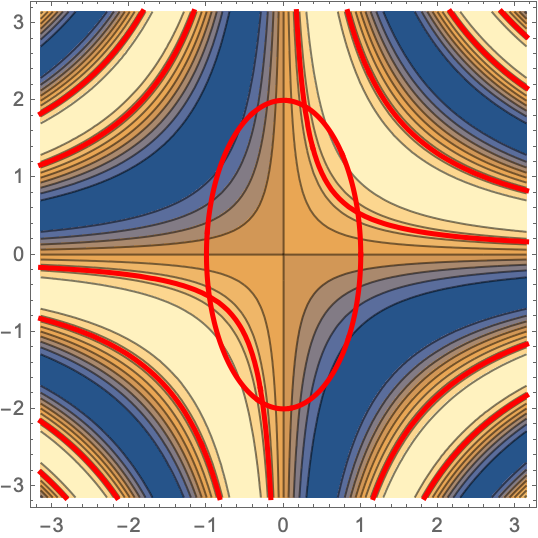 |
Display the resource function SectionPlot3D and SectionContourPlot as a row:
| In[4]:= | ![GraphicsRow[{ResourceFunction["SectionPlot3D"][
Sin[x y], {x, -3, 3}, {y, -3, 3}, {Cos[t], 2 Sin[t]}, {t, 0, 2 \[Pi]}, "ZSection" -> 1/2, "SectionStyle" -> {{Blue, Tube[.04]}}, Mesh -> None, PlotStyle -> Opacity[.6]], ResourceFunction["SectionContourPlot"][
Sin[x y], {x, -3, 3}, {y, -3, 3}, {Cos[t], 2 Sin[t]}, {t, 0, 2 \[Pi]}, "ZSection" -> 1/2, "SectionStyle" -> Blue]}, ImageSize -> Large]](https://www.wolframcloud.com/obj/resourcesystem/images/e00/e008b926-7725-4761-b7a1-044d11fa9046/28a1d0f39b9d432a.png) |
| Out[4]= | 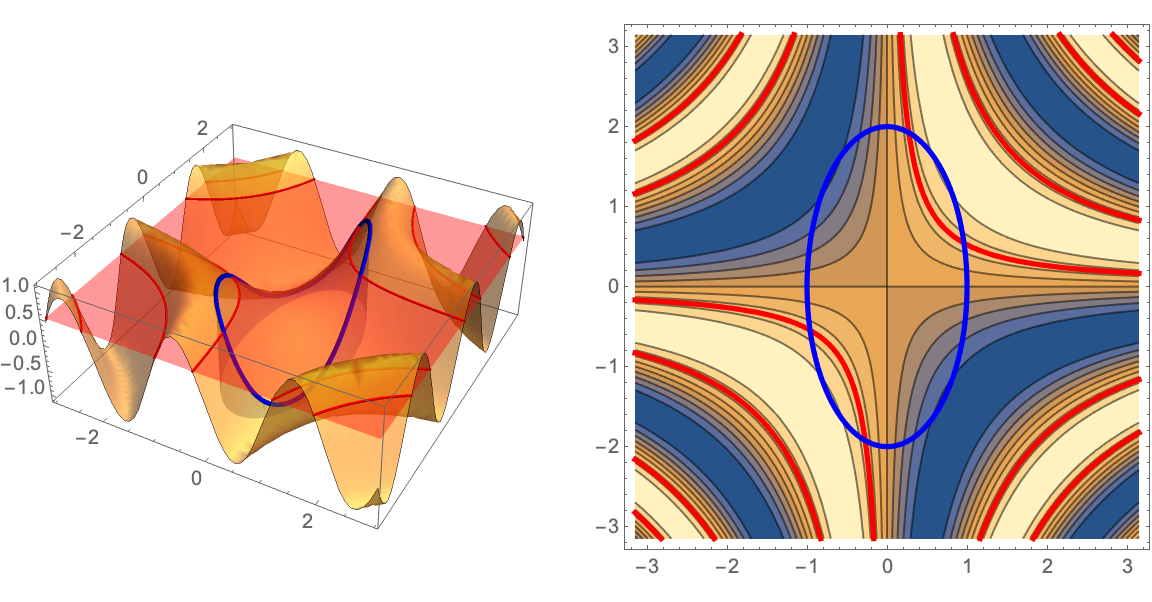 |
View the resource function SectionPlot3D directly from above to illustrate the projection of the sections onto the xy-plane:
| In[5]:= | ![GraphicsRow[{ResourceFunction["SectionPlot3D"][
Sin[x y], {x, -3, 3}, {y, -3, 3}, {Cos[t], 2 Sin[t]}, {t, 0, 2 \[Pi]}, "ZSection" -> 1/2, "ZSectionStyle" -> Tube[.05], "SectionStyle" -> {{Blue, Tube[.05]}}, Mesh -> None, PlotStyle -> Opacity[.6], ViewPoint -> {0, 0, 5}], ResourceFunction["SectionContourPlot"][
Sin[x y], {x, -3, 3}, {y, -3, 3}, {Cos[t], 2 Sin[t]}, {t, 0, 2 \[Pi]}, "ZSection" -> 1/2, "ZSectionStyle" -> AbsoluteThickness[2.5], "SectionStyle" -> {{AbsoluteThickness[2.5], Blue}}]}, ImageSize -> Large]](https://www.wolframcloud.com/obj/resourcesystem/images/e00/e008b926-7725-4761-b7a1-044d11fa9046/0c9ea8295a9b5510.png) |
| Out[5]= | 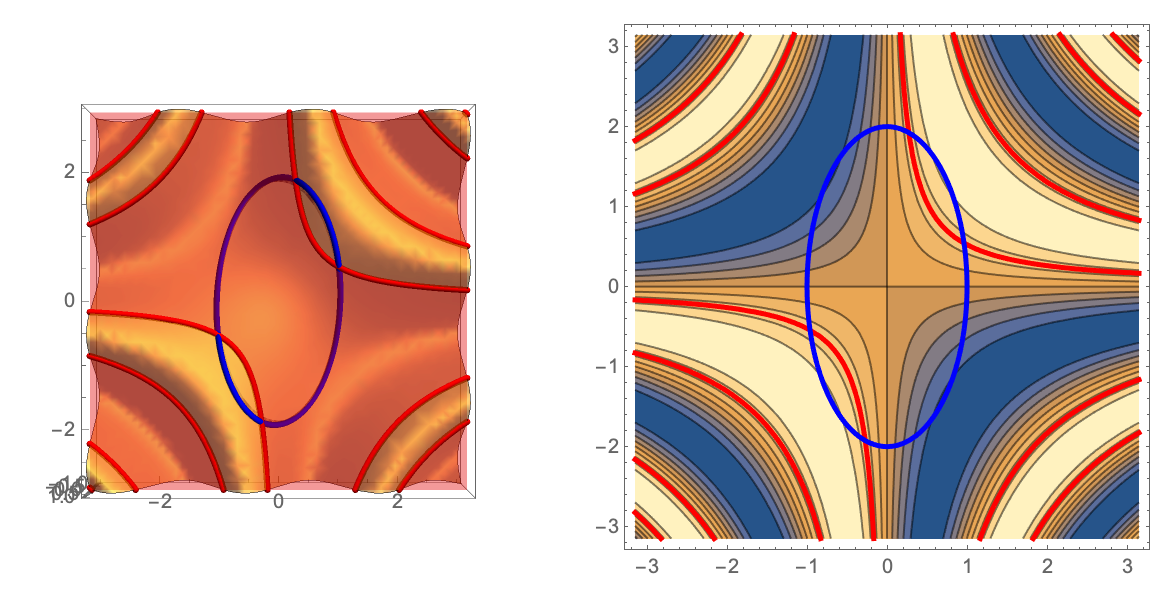 |
Add points to the contour plot and add styles to the points:
| In[6]:= | ![GraphicsRow[{ResourceFunction["SectionContourPlot"][
Sin[x y], {x, -\[Pi], \[Pi]}, {y, -\[Pi], \[Pi]}, "DrawPoint" -> {{1, 0}, {-1, 0}, {-2, \[Pi]/2}, {2, -\[Pi]/2}}], ResourceFunction["SectionContourPlot"][
Sin[x y], {x, -\[Pi], \[Pi]}, {y, -\[Pi], \[Pi]}, "DrawPoint" -> {{1, 0}, {-1, 0}, {-2, \[Pi]/2}, {2, -\[Pi]/2}}, "DrawPointStyle" -> {Black, Green, Blue, {PointSize[.08], Yellow}}]}]](https://www.wolframcloud.com/obj/resourcesystem/images/e00/e008b926-7725-4761-b7a1-044d11fa9046/513a39f3c4d80e20.png) |
| Out[6]= | 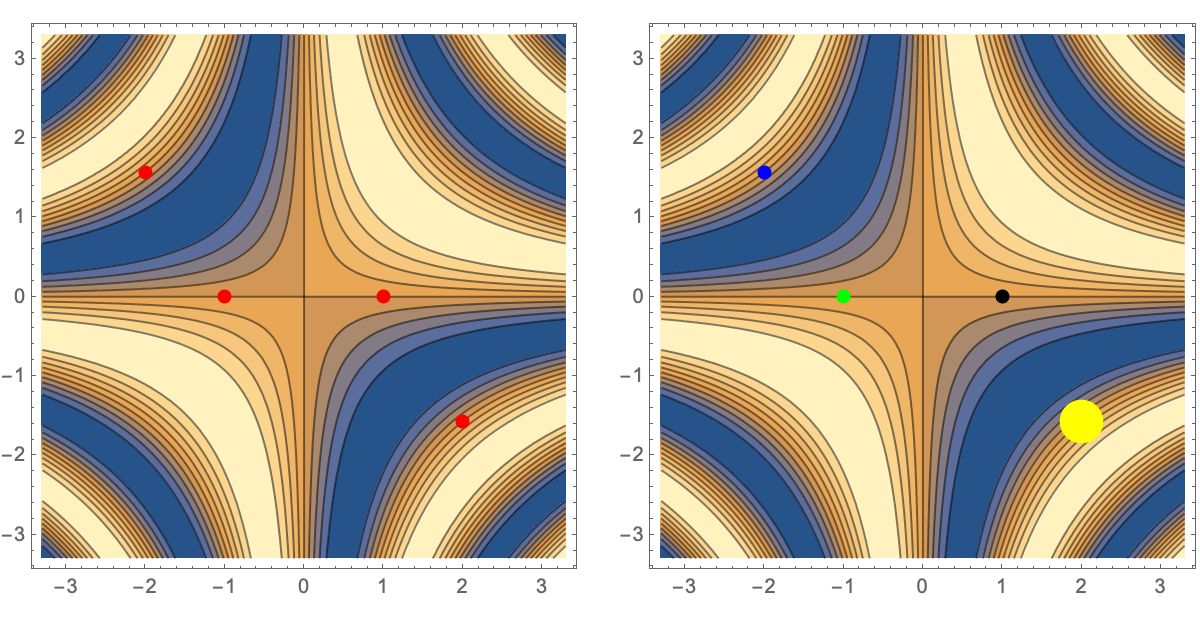 |
Plot the gradient of the function at several points and apply styles to the gradients:
| In[7]:= | ![GraphicsRow[{ResourceFunction["SectionContourPlot"][
Sin[x y], {x, -2, 2}, {y, -2, 2}, "DrawGradient" -> {{1.5, 0}, {-1, 1}, {1, -1}, {-1, 0}}] , ResourceFunction["SectionContourPlot"][
Sin[x y], {x, -2, 2}, {y, -2, 2}, "DrawGradient" -> {{1.5, 0}, {-1, 1}, {1, -1}, {-1, 0}}, "GradientStyle" -> {{Blue, PointSize[.05]}, {Red, Dashed, PointSize[Large]}, {Green, Dashed, PointSize[Large]}, {Purple, Dashed, PointSize[Large]}}]}]](https://www.wolframcloud.com/obj/resourcesystem/images/e00/e008b926-7725-4761-b7a1-044d11fa9046/253a47d47d81861b.png) |
| Out[7]= | 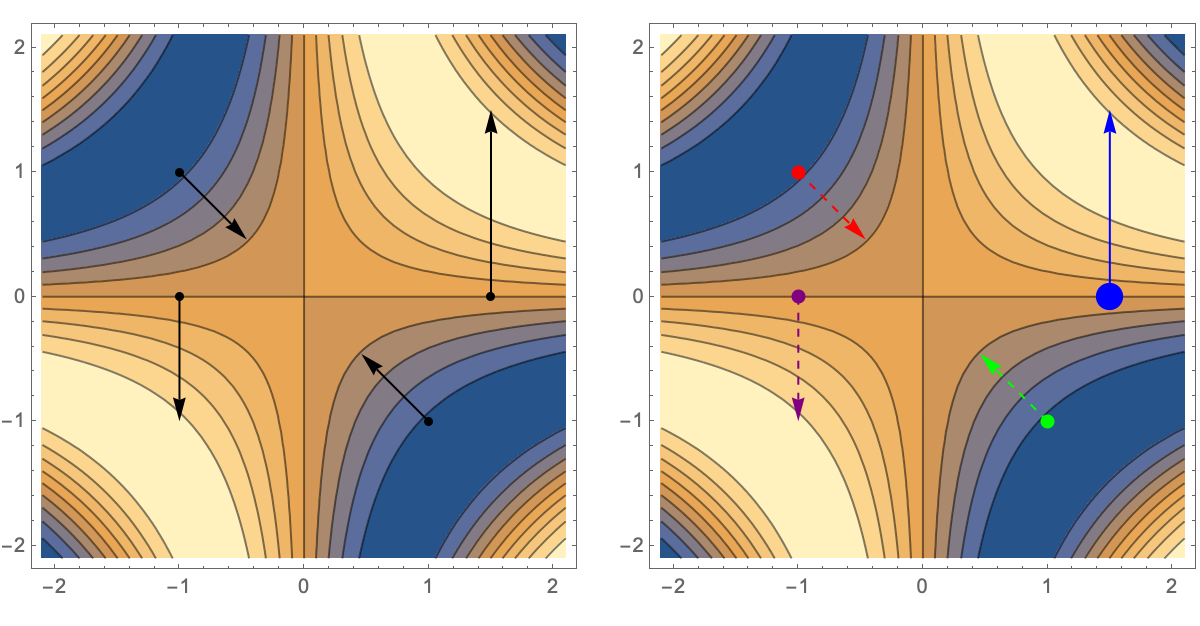 |
Oblique sections with a style set for each:
| In[8]:= |
| Out[8]= | 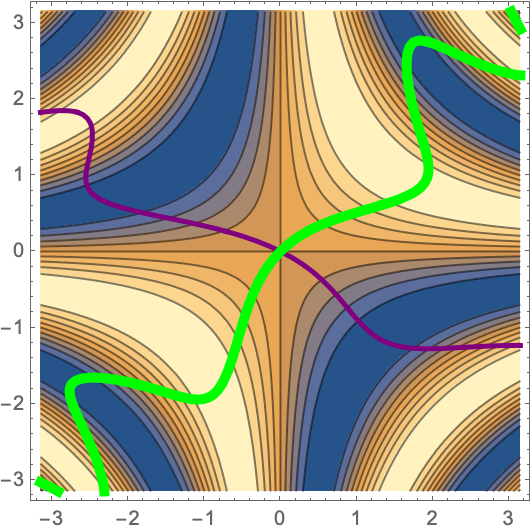 |
Setting the number of points used to plot the sections:
| In[9]:= | ![GraphicsGrid[{{ResourceFunction["SectionContourPlot"][
Sin[x^2 y], {x, -2, 2}, {y, -2, 2}, "OSection" -> x^2 + y, "PlotPointsSection" -> 7, MaxRecursion -> 0], ResourceFunction["SectionContourPlot"][
Sin[x^2 y], {x, -2, 2}, {y, -2, 2}, "OSection" -> x^2 + y, "PlotPointsSection" -> Automatic]}}, ImageSize -> Medium]](https://www.wolframcloud.com/obj/resourcesystem/images/e00/e008b926-7725-4761-b7a1-044d11fa9046/4a14ecfce179e6d8.png) |
| Out[9]= | 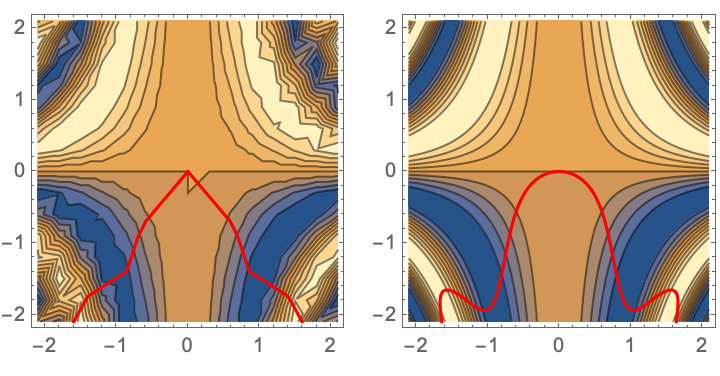 |
Parametrically defined sections with a style set for each:
| In[10]:= |
| Out[10]= | 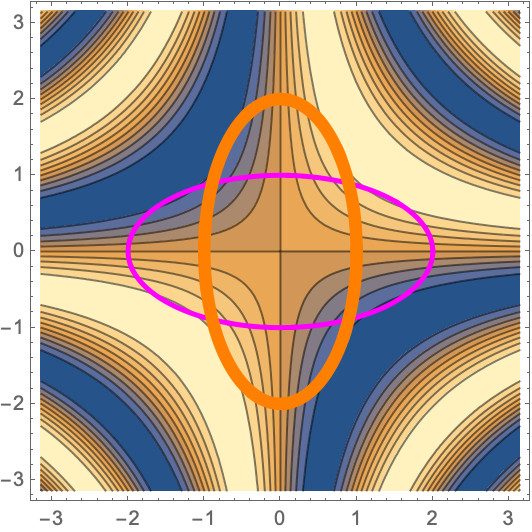 |
Vertical sections with a style set for each:
| In[11]:= |
| Out[11]= | 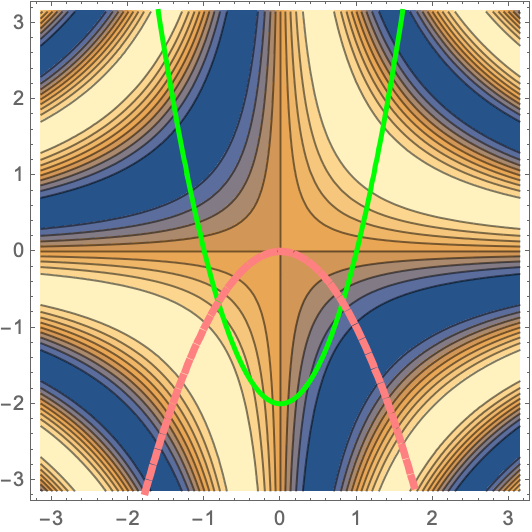 |
X sections with a style set for each:
| In[12]:= |
| Out[12]= | 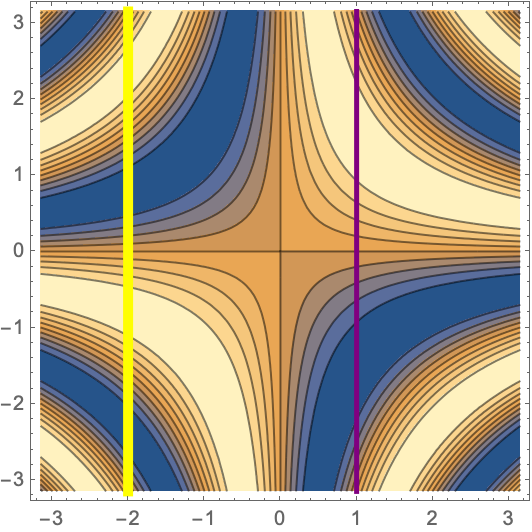 |
Y sections with a style set for each:
| In[13]:= |
| Out[13]= | 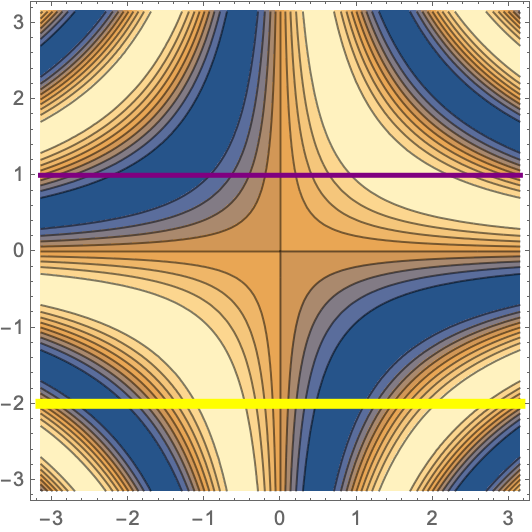 |
Z sections with a style set for each:
| In[14]:= |
| Out[14]= | 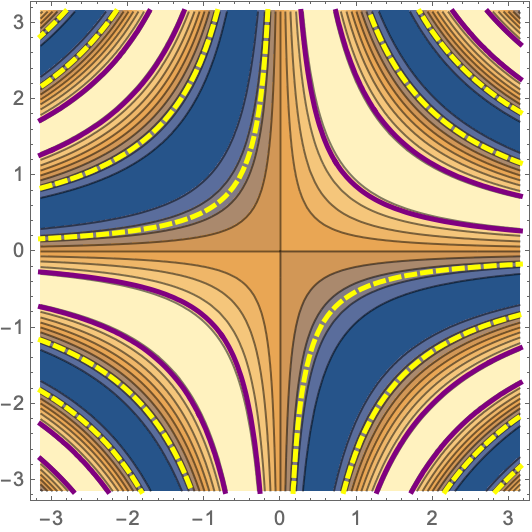 |
This work is licensed under a Creative Commons Attribution 4.0 International License