Wolfram Function Repository
Instant-use add-on functions for the Wolfram Language
Function Repository Resource:
Plot a surface together with various types of sections of the surface
ResourceFunction["SectionPlot3D"][f,{x,xmin,xmax},{y,ymin,ymax},opts] generate a three-dimensional plot of f as a function of x and y highlighting sections specified by opts. | |
ResourceFunction["SectionPlot3D"][f,{x,xmin,xmax},{y,ymin,ymax},{{gx,gy},…},{t,tmin,tmax}}] plots the section of the surface determined by the generalized cylinders described parametrically by {{gx,gy},…},{t,tmin,tmax}. |
| "ColorFunctionSection" | Automatic | specifies the color function(s) for the section |
| "ColorFunctionSurface" | Automatic | specifies the color function(s) for the surface |
| "CylinderBase" | Automatic | determines the z-value to which cylinders are projected |
| "CylinderRange" | Automatic | determines the range of the cylinder |
| "CylinderStyle" | Opacity[0.4] | specifies style for the cylinder; it ignores color specifications. |
| "DrawCylinder" | True | whether to draw the cylinder |
| "DrawPoint" | {} | a list of points to be included in the plot |
| "DrawPointStyle" | {{Red,PointSize[Large]}} | styles to be applied to the points specified with the option "DrawPoint" |
| "OSection" | {} | draws an oblique section determined by functions of the form z=f[x],z=g[y], or z=h[x,y] |
| "OSectionStyle" | {{Red,Tube[.02]}} | styles to be applied to the oblique sections |
| "PlotPointsSection" | 75 | specifies how many initial sample points to use in plotting sections |
| PlotStyle | Opacity[0.7] | graphics directive for the style for each surface |
| "SectionStyle" | {{Red,Tube[.02]}} | styles to be applied to sections defined parametrically by {gx,gy} |
| "Surface" | True | whether to return the surface in the plot |
| "VSection" | {} | draws vertical section(s) for a function or list of functions of the form y=f[x] or x=g[y] |
| "VSectionStyle" | {{Red,Tube[.02]}} | styles to be applied to the vertical sections |
| "XSection" | {} | draws vertical sections parallel to the yz-plane determined by the value or list of values of x |
| "XSectionStyle" | {{Red,Tube[.02]}} | styles to be applied to the x-sections |
| "YSection" | {} | draws vertical sections parallel to the xz-plane determined by the value or list of values of y |
| "YSectionStyle" | {{Red,Tube[.02]}} | styles to be applied to the y-sections |
| "ZSection" | {} | draws horizontal sections parallel to the xy-plane determined by the value or list of values of z |
| "ZSectionStyle" | {{Red,Tube[.02]}} | styles to be applied to the z-sections |
Plot a surface with a circular section:
| In[1]:= |
| Out[1]= | 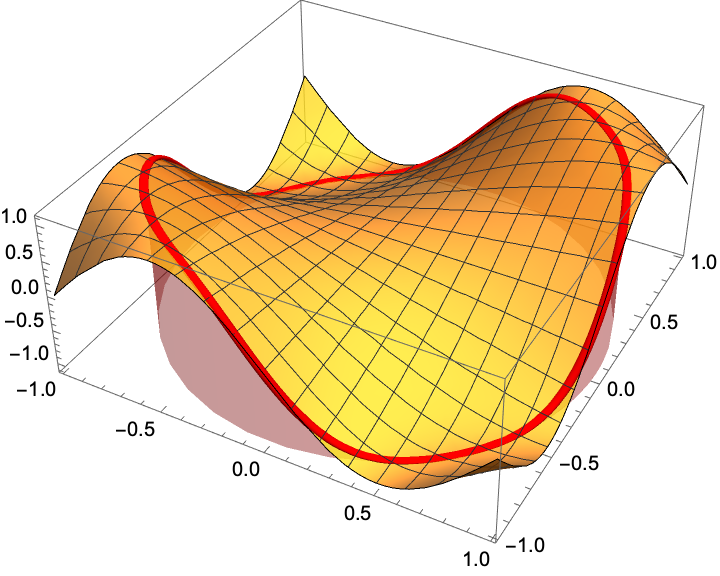 |
Plot a surface with all possible plane sections:
| In[2]:= | ![(* Evaluate this cell to get the example input *) CloudGet["https://www.wolframcloud.com/obj/4b23abc9-4e34-4e3e-90db-375a3f3d7598"]](https://www.wolframcloud.com/obj/resourcesystem/images/2b0/2b053273-f5b8-40e4-b2f4-637e17a82568/58fdfd36fedb08b1.png) |
| Out[2]= | 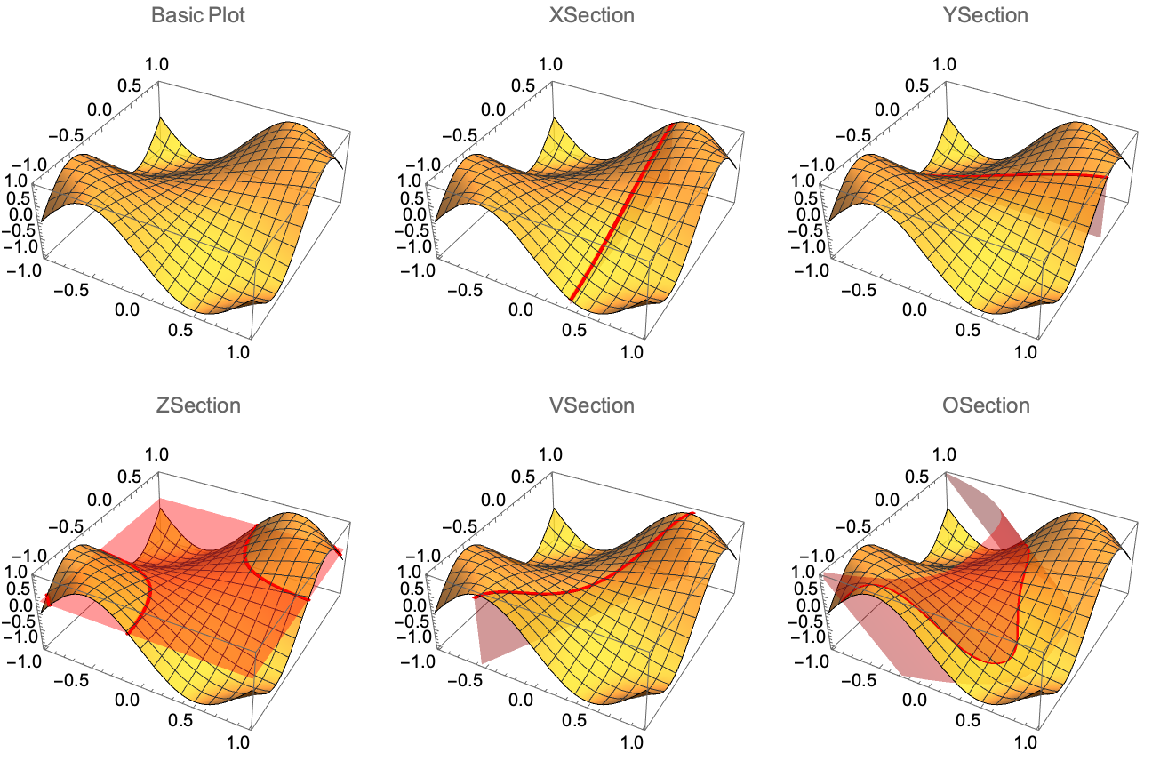 |
Plot a surface with both a plane section and a parametrically-defined section:
| In[3]:= |
| Out[3]= | 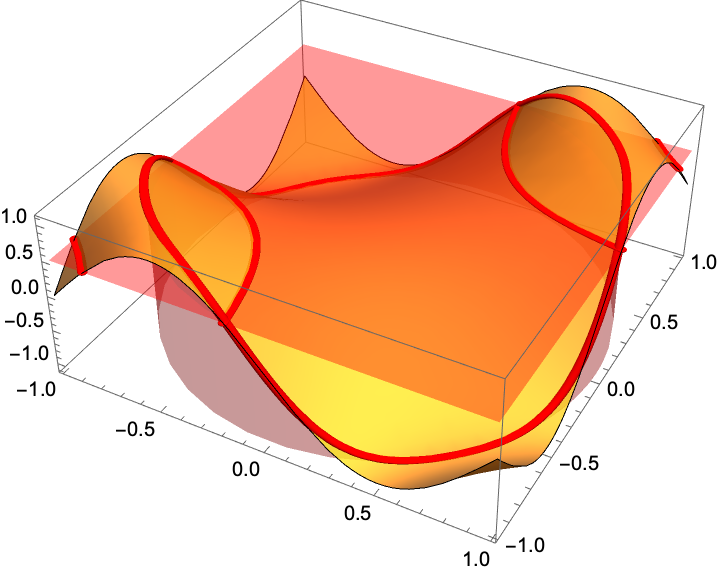 |
Plot two surfaces with their intersection illustrated with sections:
| In[4]:= | ![ResourceFunction[
"SectionPlot3D"][{1 - x^2 - y^2, x^2 - y^2}, {x, -1, 1}, {y, -1, 1}, "CylinderStyle" -> Opacity[.9], BoxRatios -> Automatic, "XSection" -> {-1/Sqrt[2], 1/Sqrt[2]}, PlotStyle -> {Opacity[.8], Opacity[1]}]](https://www.wolframcloud.com/obj/resourcesystem/images/2b0/2b053273-f5b8-40e4-b2f4-637e17a82568/163f18005cd86454.png) |
| Out[4]= | 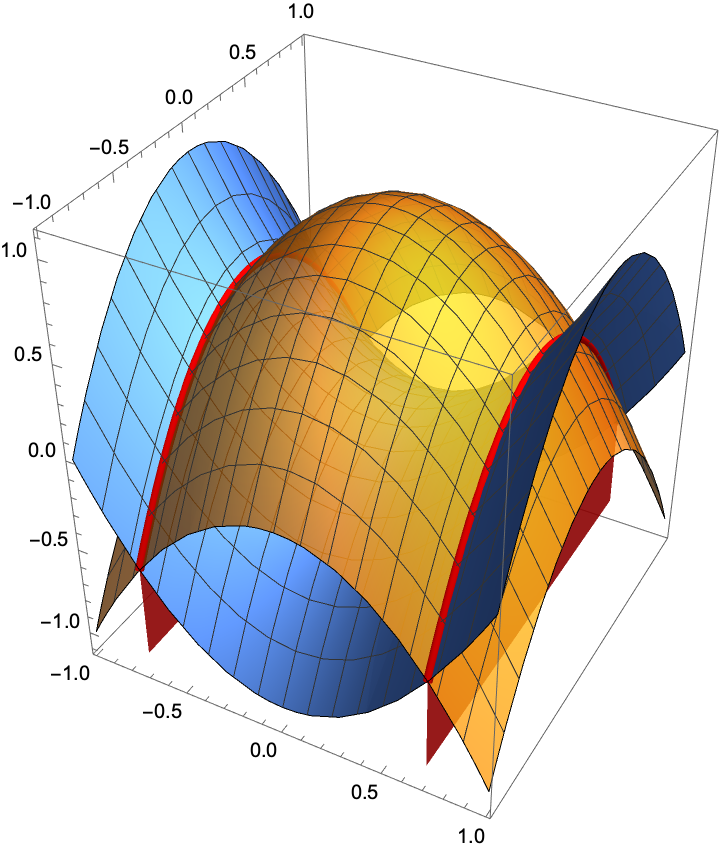 |
Set a style for the sections:
| In[5]:= | ![ResourceFunction["SectionPlot3D"][
x^2 - y^2, {x, -1, 1}, {y, -1, 1}, {{Cos[t], Sin[t]}, 1/2 {Cos[t], Sin[t]}}, {t, 0, 2 \[Pi]}, "ColorFunctionSection" -> Function[{x, y, z, t}, GrayLevel[t]], BoxRatios -> Automatic]](https://www.wolframcloud.com/obj/resourcesystem/images/2b0/2b053273-f5b8-40e4-b2f4-637e17a82568/08ef856d0cf3861e.png) |
| Out[5]= | 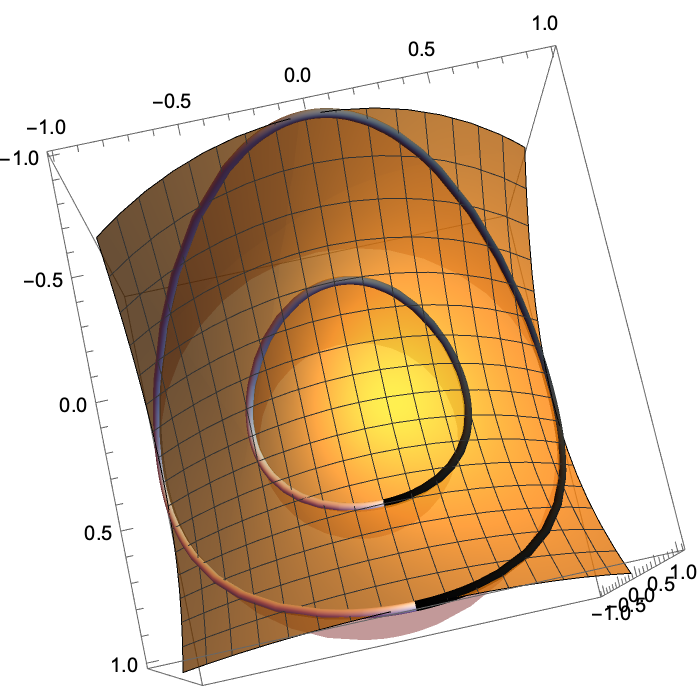 |
Set a different style for each section:
| In[6]:= | ![ResourceFunction["SectionPlot3D"][
x^2 - y^2, {x, -1, 1}, {y, -1, 1}, {{Cos[t], Sin[t]}, 1/2 {Cos[t], Sin[t]}}, {t, 0, 2 \[Pi]}, "ColorFunctionSection" -> {Function[{x, y, z, t}, Hue[t/2]], Function[{x, y, z, t}, Hue[t]]}, BoxRatios -> Automatic]](https://www.wolframcloud.com/obj/resourcesystem/images/2b0/2b053273-f5b8-40e4-b2f4-637e17a82568/1b5e4689b2964679.png) |
| Out[6]= | 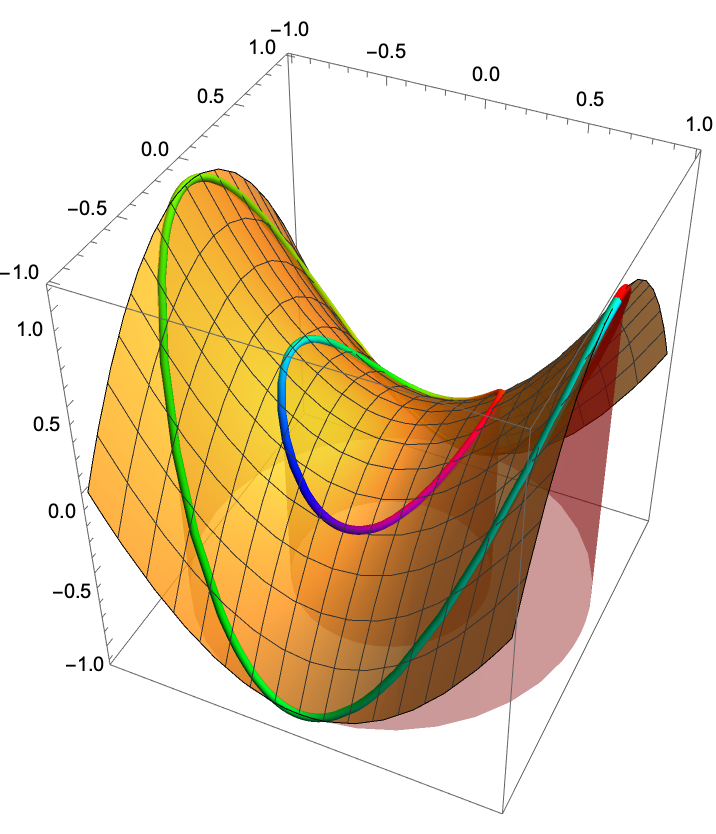 |
Set a style for the surface:
| In[7]:= | ![ResourceFunction["SectionPlot3D"][
x^2 - y^2, {x, -1, 1}, {y, -1, 1}, {{Cos[t], Sin[t]}, 1/4 {Cos[t], Sin[t]}}, {t, 0, 2 \[Pi]}, "ColorFunctionSurface" -> Function[{x, y, z}, Hue[z]]]](https://www.wolframcloud.com/obj/resourcesystem/images/2b0/2b053273-f5b8-40e4-b2f4-637e17a82568/670edc37bf83fc76.png) |
| Out[7]= | 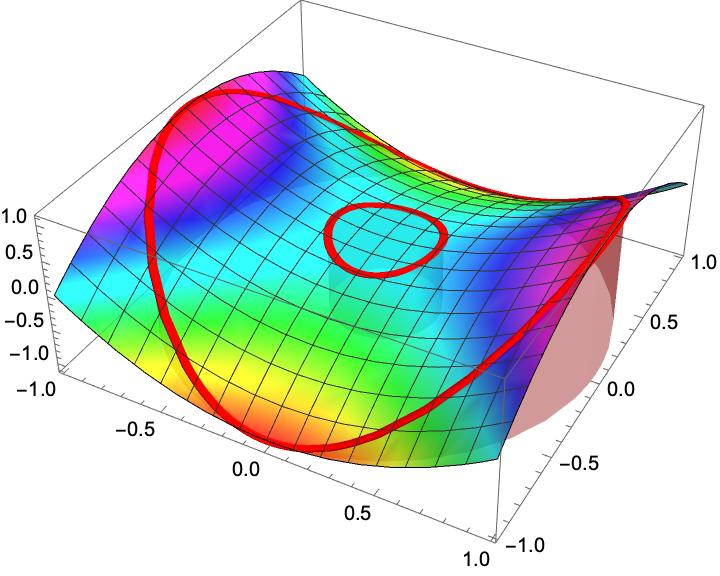 |
Set a color function for both the surface and the sections:
| In[8]:= | ![ResourceFunction["SectionPlot3D"][
x^2 - y^2, {x, -1, 1}, {y, -1, 1}, {{Cos[t], Sin[t]}, 1/4 {Cos[t], Sin[t]}}, {t, 0, 2 \[Pi]},
"ColorFunctionSurface" -> Function[{x, y, z}, Hue[z]], "ColorFunctionSection" -> Function[{x, y, z}, GrayLevel[z]]]](https://www.wolframcloud.com/obj/resourcesystem/images/2b0/2b053273-f5b8-40e4-b2f4-637e17a82568/3c864f79c568e4e1.png) |
| Out[8]= | 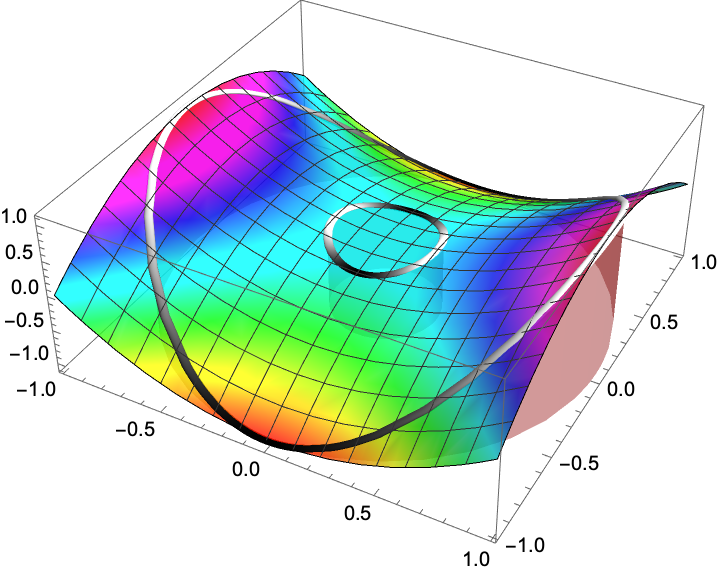 |
Set where to place the base of the cylinder:
| In[9]:= |
| Out[9]= | 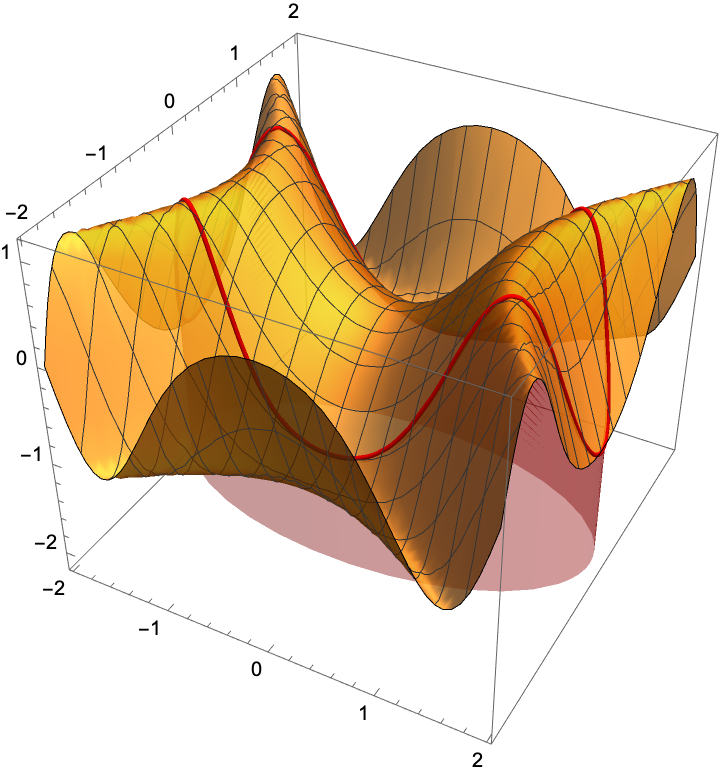 |
Set the cylinder to be drawn from the top of the bounding box down to the surface:
| In[10]:= |
| Out[10]= | 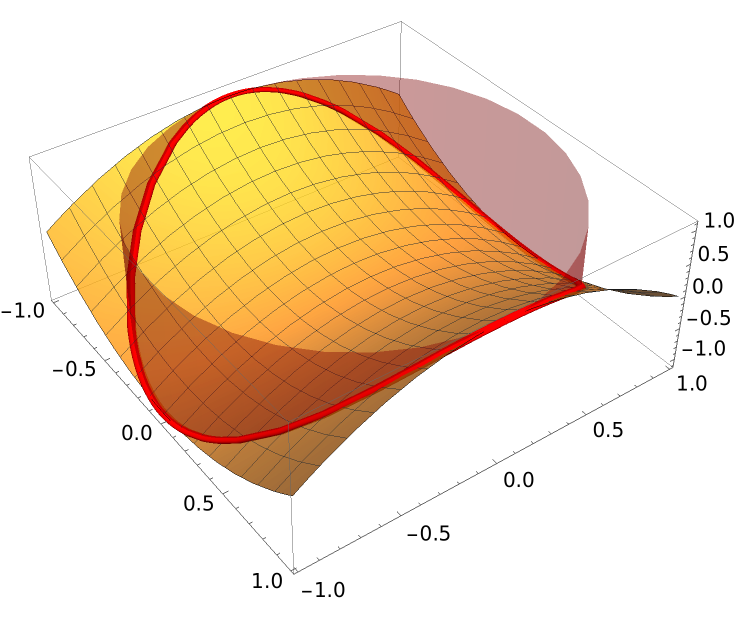 |
Draw the cylinder both above and below the surface:
| In[11]:= | ![ResourceFunction["SectionPlot3D"][
x^2 - y^2, {x, -1, 1}, {y, -1, 1}, {Cos[t], Sin[t]}, {t, 0, 2 \[Pi]},
"CylinderRange" -> {-2, 2}, BoxRatios -> Automatic]](https://www.wolframcloud.com/obj/resourcesystem/images/2b0/2b053273-f5b8-40e4-b2f4-637e17a82568/56128ed5ef35617d.png) |
| Out[11]= | 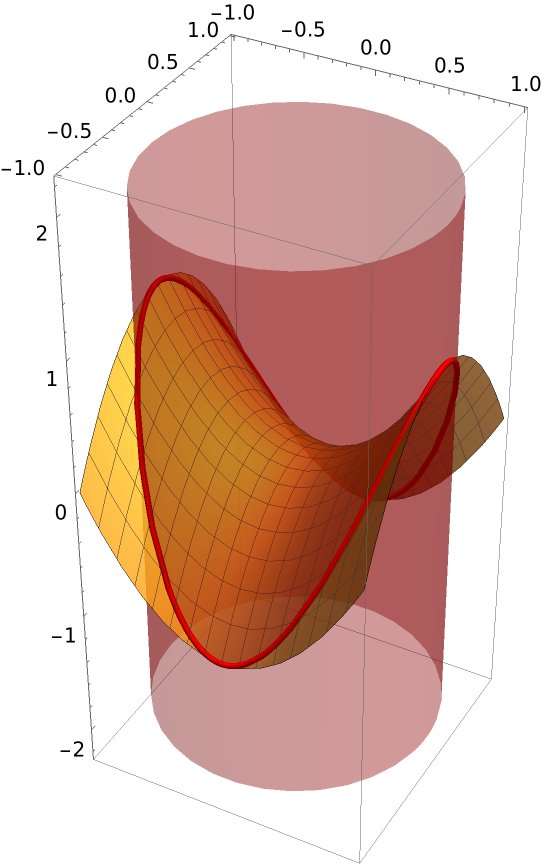 |
Draw the cylinder to full height:
| In[12]:= |
| Out[12]= |  |
Draw a cylinder from a base of -2 to the surface (this is the same as setting "CylinderBase" →-2):
| In[13]:= |
| Out[13]= | 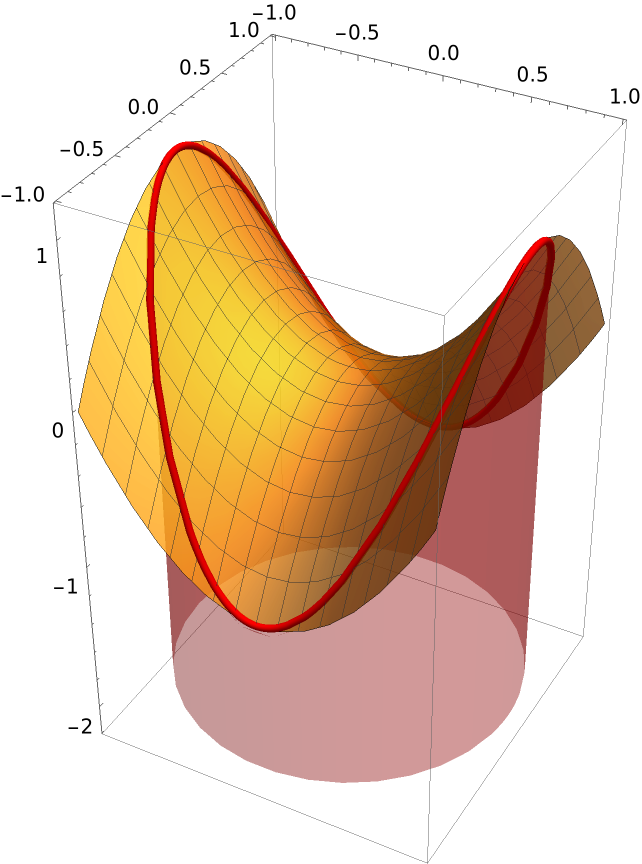 |
"CylinderRange" takes precedence over "CylinderBase":
| In[14]:= |
| Out[14]= | 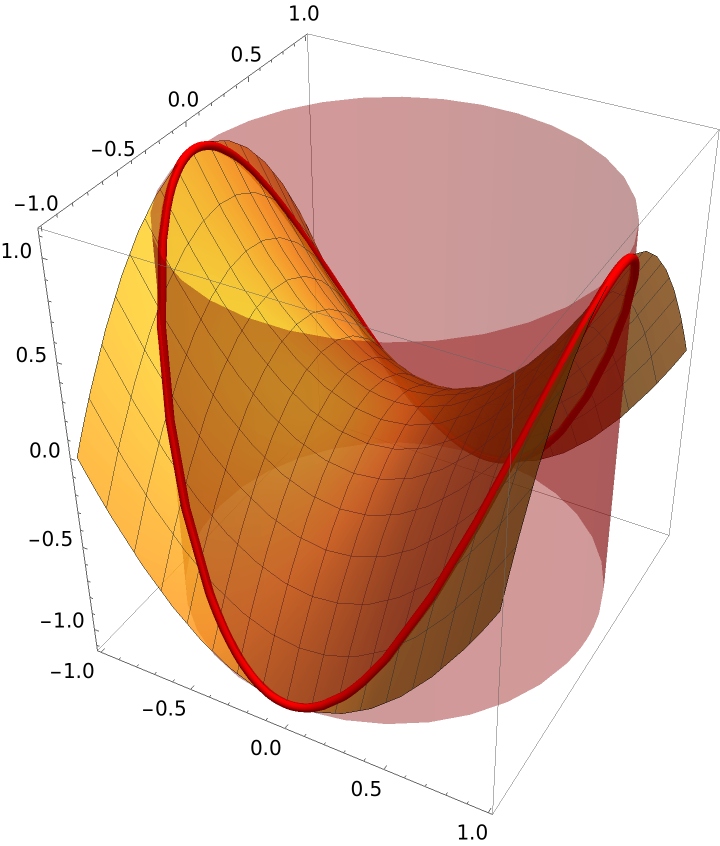 |
Apply a style to the cylinder:
| In[15]:= |
| Out[15]= | 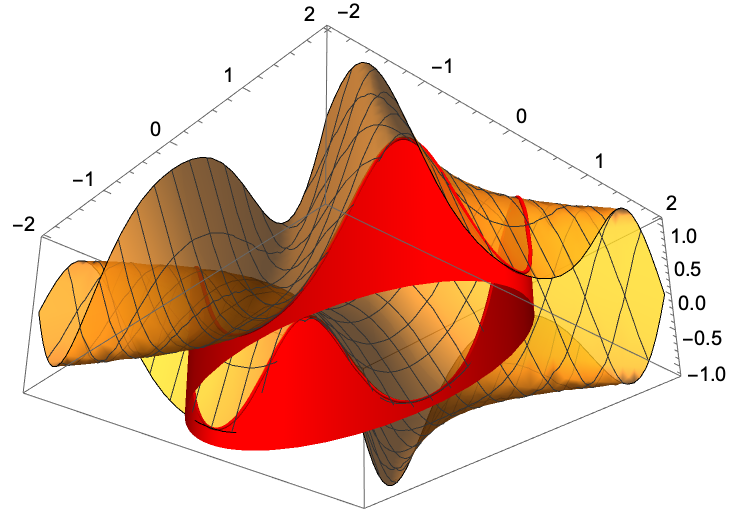 |
Suppress the plot of the cylinder:
| In[16]:= |
| Out[16]= | 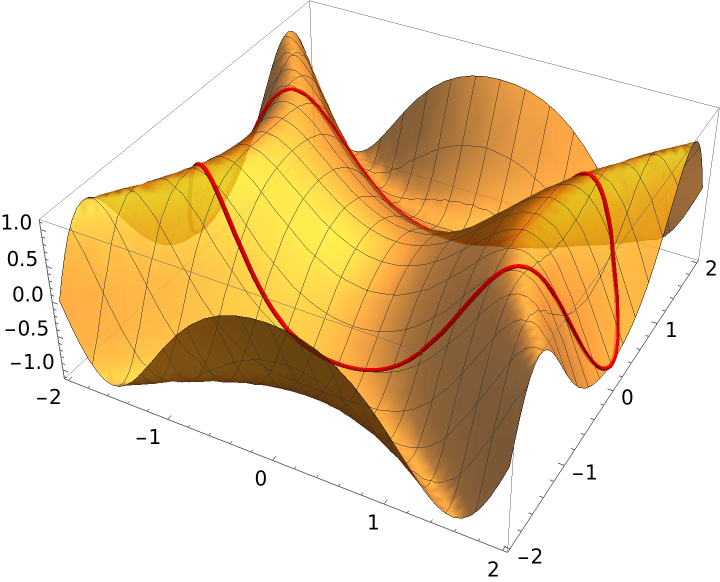 |
Add points and styles to the points:
| In[17]:= | ![ResourceFunction["SectionPlot3D"][
x^2 - y^2, {x, -1, 1}, {y, -1, 1}, {Cos[t], Sin[t]}, {t, 0, 2 \[Pi]},
"DrawPoint" -> {{1, 0}, {-1, 0}, {0, 1}, {0, -1}, {1/2, 1/2, 3}}, "DrawPointStyle" -> {{PointSize[.05], Red}, {PointSize[.05], Orange}, {PointSize[.06], Green}, {PointSize[.06], Blue}, {PointSize[.08], Magenta}}]](https://www.wolframcloud.com/obj/resourcesystem/images/2b0/2b053273-f5b8-40e4-b2f4-637e17a82568/16e77b7f399d3ba6.png) |
| Out[17]= | 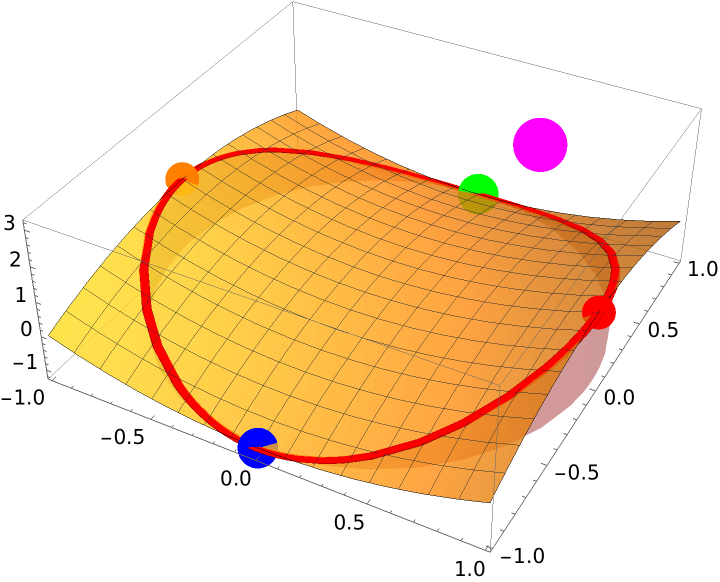 |
Add oblique sections:
| In[18]:= | ![ResourceFunction["SectionPlot3D"][-x^2 - y^2, {x, -1, 1}, {y, -1, 1}, "OSection" -> {-(x/3), -(x/4) + y/8 - 1/2}, BoxRatios -> Automatic, PlotRange -> All]](https://www.wolframcloud.com/obj/resourcesystem/images/2b0/2b053273-f5b8-40e4-b2f4-637e17a82568/073b7d3c8a8d388c.png) |
| Out[18]= | 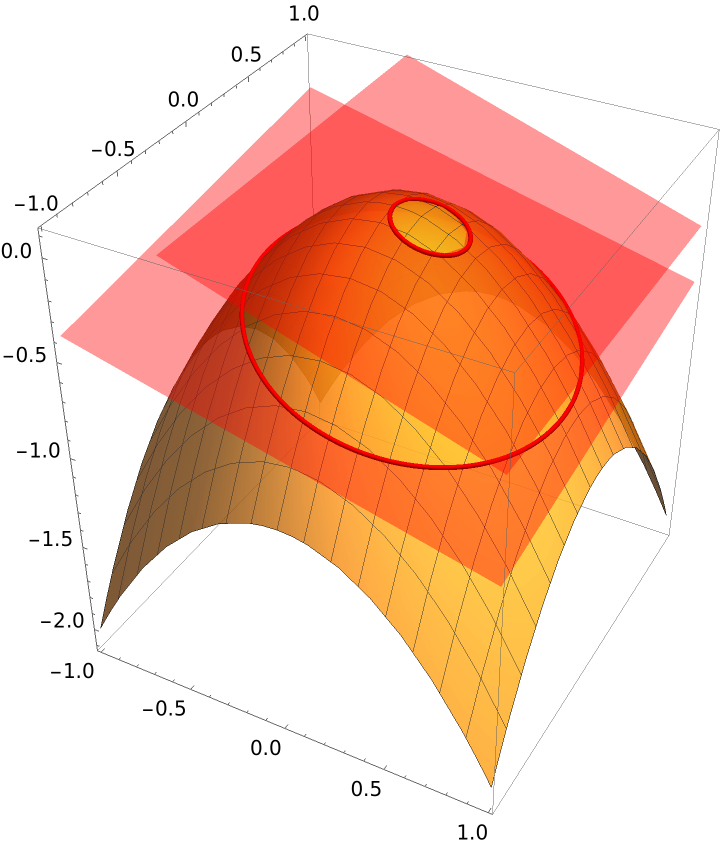 |
Add styles:
| In[19]:= | ![ResourceFunction["SectionPlot3D"][-x^2 - y^2, {x, -1, 1}, {y, -1, 1}, "OSection" -> {-(x/3), -(x/4) + y/8 - 1/2}, "OSectionStyle" -> {Red, {Tube[.03], Blue}}, BoxRatios -> Automatic, PlotRange -> All]](https://www.wolframcloud.com/obj/resourcesystem/images/2b0/2b053273-f5b8-40e4-b2f4-637e17a82568/3b45a8019904270b.png) |
| Out[19]= | 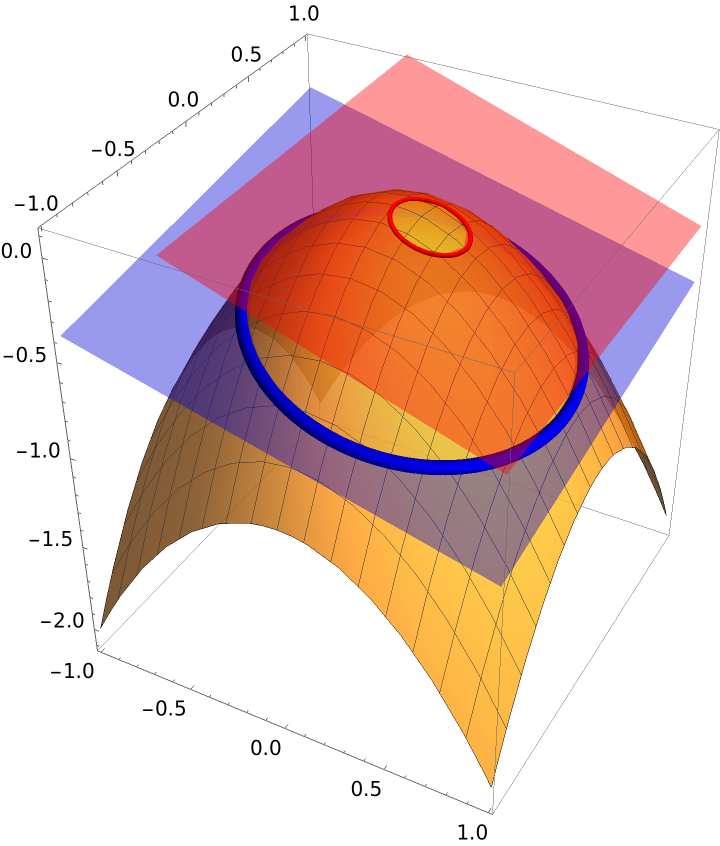 |
Change the number of points used to plot the section(s). Since the Wolfram Language’s plotting commands use adaptive procedures to determine how many points to actually plot, we must turn off this feature by setting the option MaxRecursion:
| In[20]:= | ![ResourceFunction["SectionPlot3D"][
x^2 - y^4, {x, -1, 1}, {y, -1, 1}, {1/(1 + t^2) Cos[5 t], 1/(1 + t^2) Sin[5 t]}, {t, 0, 2 \[Pi]}, BoxRatios -> Automatic, PlotStyle -> Opacity[.3], Mesh -> None, "PlotPointsSection" -> 25, MaxRecursion -> 0]](https://www.wolframcloud.com/obj/resourcesystem/images/2b0/2b053273-f5b8-40e4-b2f4-637e17a82568/2ff485f0ca76d3d6.png) |
| Out[20]= | 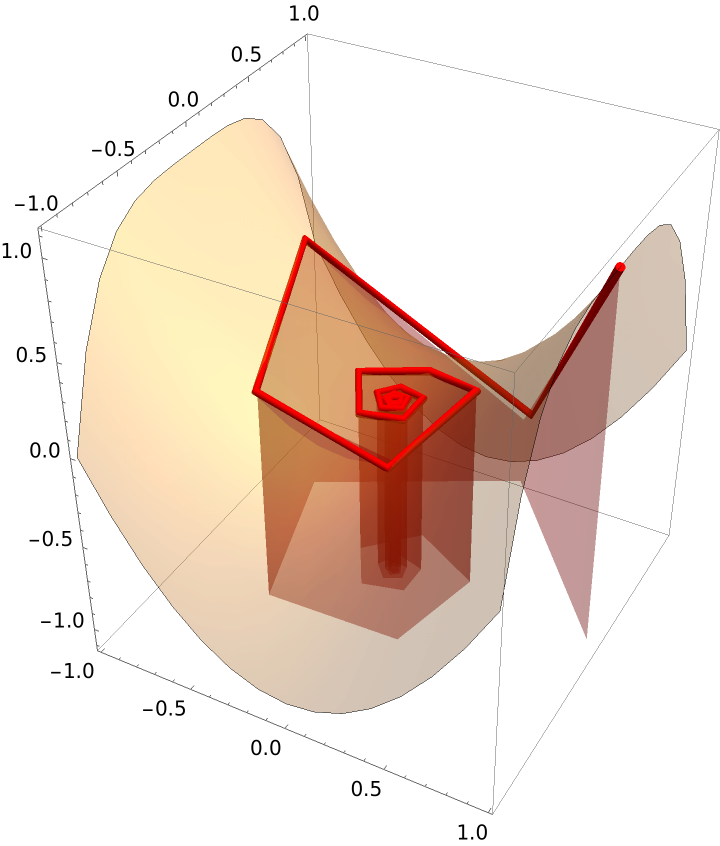 |
Apply a style to the surface:
| In[21]:= |
| Out[21]= | 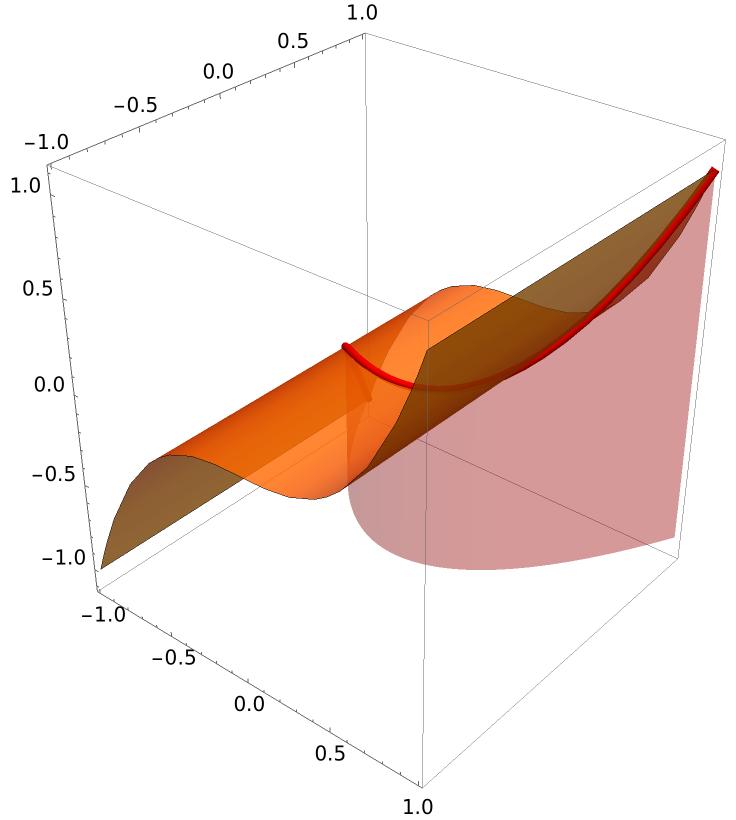 |
Apply a style to the section:
| In[22]:= |
| Out[22]= | 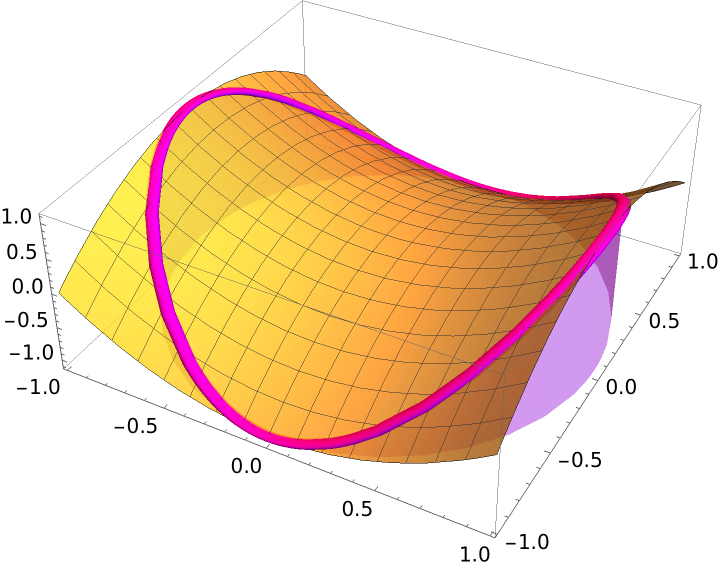 |
Suppress the plot of the surface:
| In[23]:= | ![GraphicsRow[{ResourceFunction["SectionPlot3D"][
Sin[x^2 - y^2], {x, -2, 2}, {y, -2, 2}, {2 Cos[t], Sin[t]}, {t, 0, 2 \[Pi]}, "CylinderStyle" -> Opacity[1]], ResourceFunction["SectionPlot3D"][
Sin[x^2 - y^2], {x, -2, 2}, {y, -2, 2}, {2 Cos[t], Sin[t]}, {t, 0, 2 \[Pi]}, "CylinderStyle" -> Opacity[1], "Surface" -> False]}, ImageSize -> Full]](https://www.wolframcloud.com/obj/resourcesystem/images/2b0/2b053273-f5b8-40e4-b2f4-637e17a82568/52391521af9efc8f.png) |
| Out[23]= | 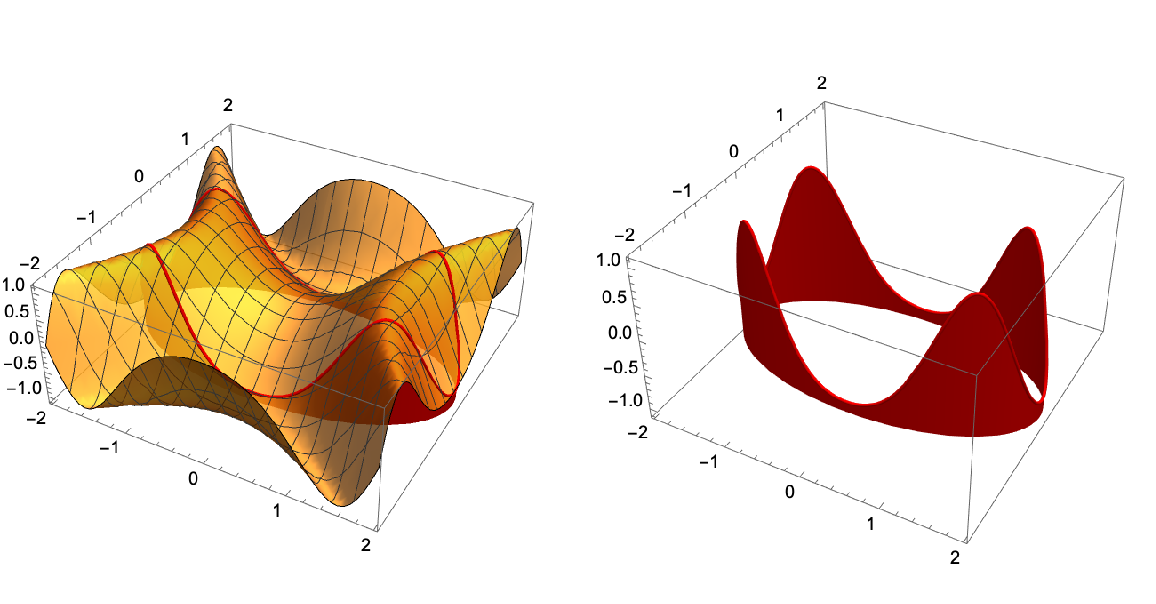 |
Add vertical sections:
| In[24]:= |
| Out[24]= | 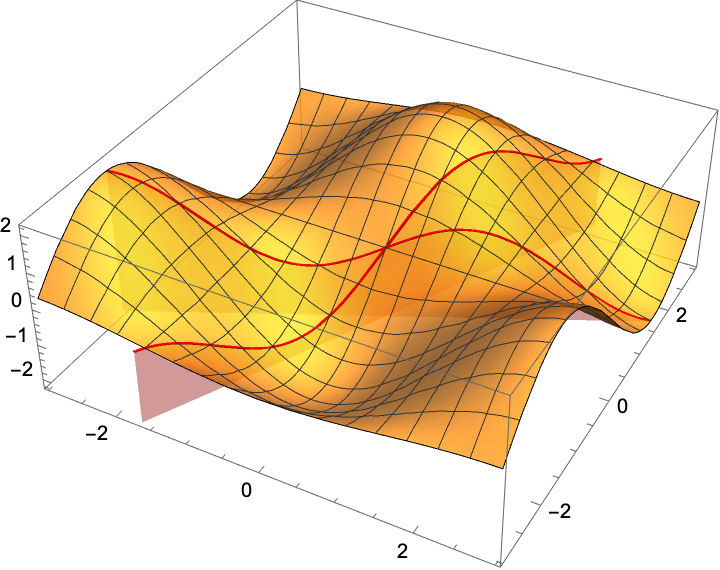 |
VSections can be any function of x or y:
| In[25]:= |
| Out[25]= | 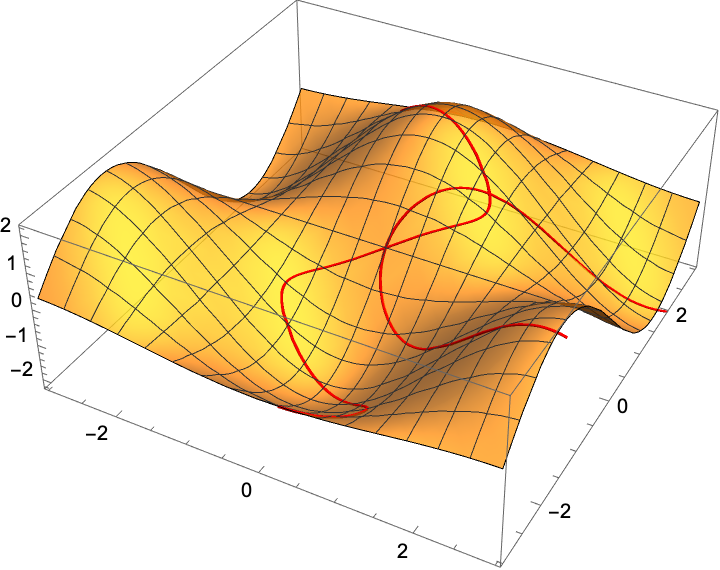 |
Set a style:
| In[26]:= |
| Out[26]= | 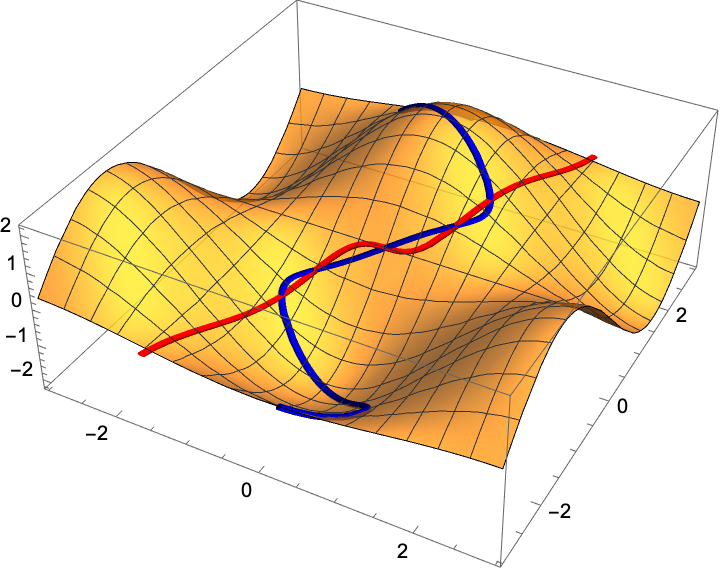 |
Add x-sections:
| In[27]:= |
| Out[27]= | 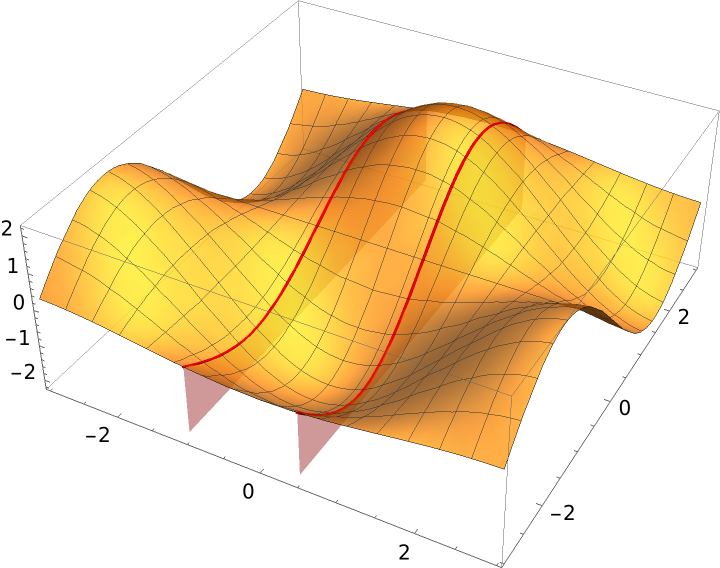 |
Assign a style to the x-sections:
| In[28]:= | ![ResourceFunction["SectionPlot3D"][
2 Sin[y] Cos[x], {x, -3, 3}, {y, -3, 3}, "XSection" -> {-1, 1/2}, "XSectionStyle" -> {{Tube[.03], Blue}, {Tube[.06], Red}}]](https://www.wolframcloud.com/obj/resourcesystem/images/2b0/2b053273-f5b8-40e4-b2f4-637e17a82568/3ee42edb5a84380e.png) |
| Out[28]= | 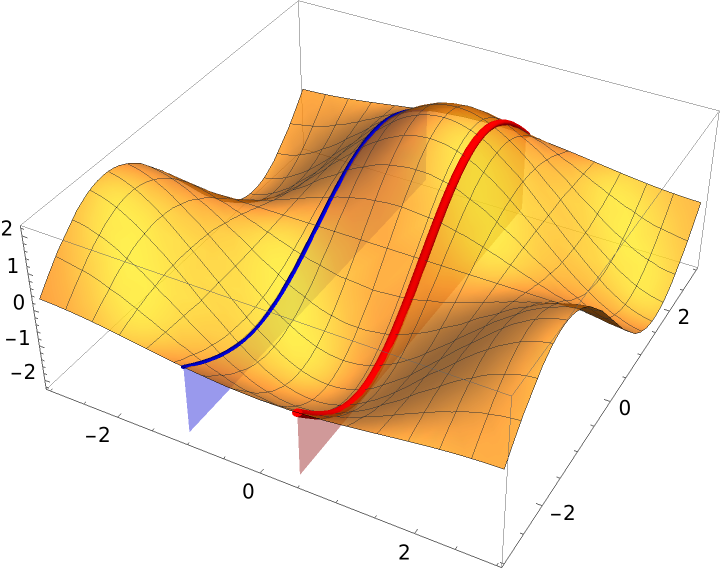 |
Plot several sections and suppress the plot of the surface:
| In[29]:= | ![ResourceFunction["SectionPlot3D"][-x^2 - y^2, {x, -1, 1}, {y, -1, 1}, "XSection" -> {-1, -(1/2), 0, 1/2, 1}, "Surface" -> False, "XSectionStyle" -> Table[Hue[j], {j, 0, 1, 1/5}]]](https://www.wolframcloud.com/obj/resourcesystem/images/2b0/2b053273-f5b8-40e4-b2f4-637e17a82568/630bdb5219010064.png) |
| Out[29]= | 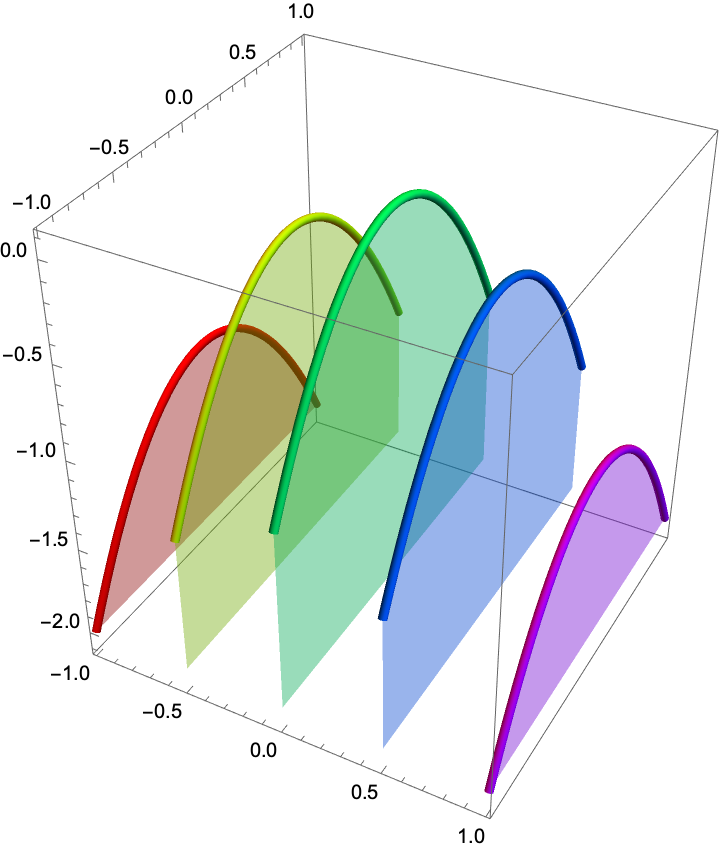 |
Add y-sections:
| In[30]:= |
| Out[30]= | 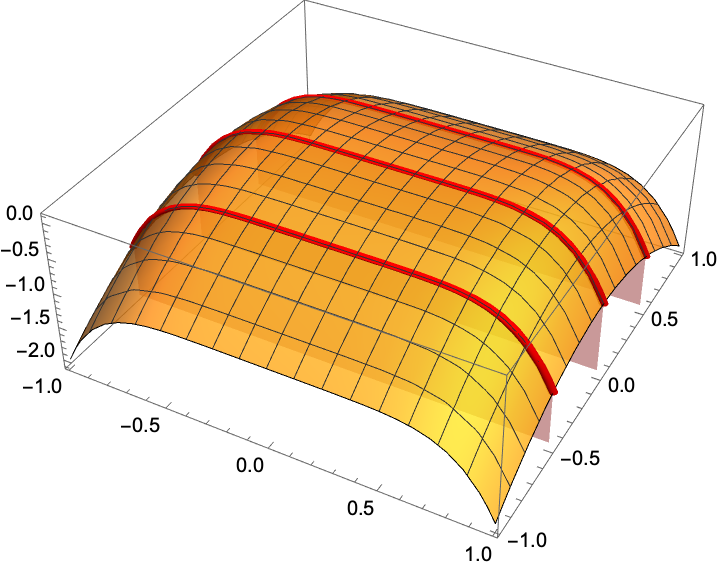 |
Set a style for the y-sections:
| In[31]:= |
| Out[31]= | 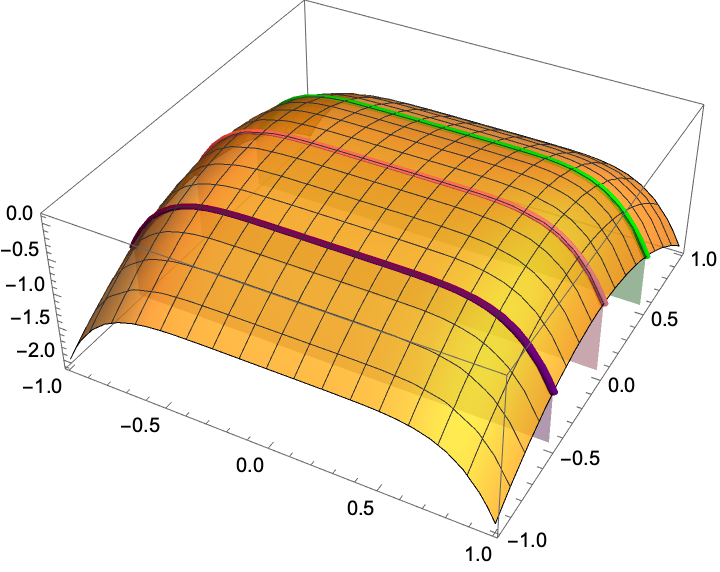 |
Add z-sections:
| In[32]:= | ![ResourceFunction["SectionPlot3D"][-x^2 - y^2, {x, -1, 1}, {y, -1, 1}, "ZSection" -> {-(1/2), -1}, Mesh -> False, BoxRatios -> Automatic]](https://www.wolframcloud.com/obj/resourcesystem/images/2b0/2b053273-f5b8-40e4-b2f4-637e17a82568/5eaf44466fa1a499.png) |
| Out[32]= | 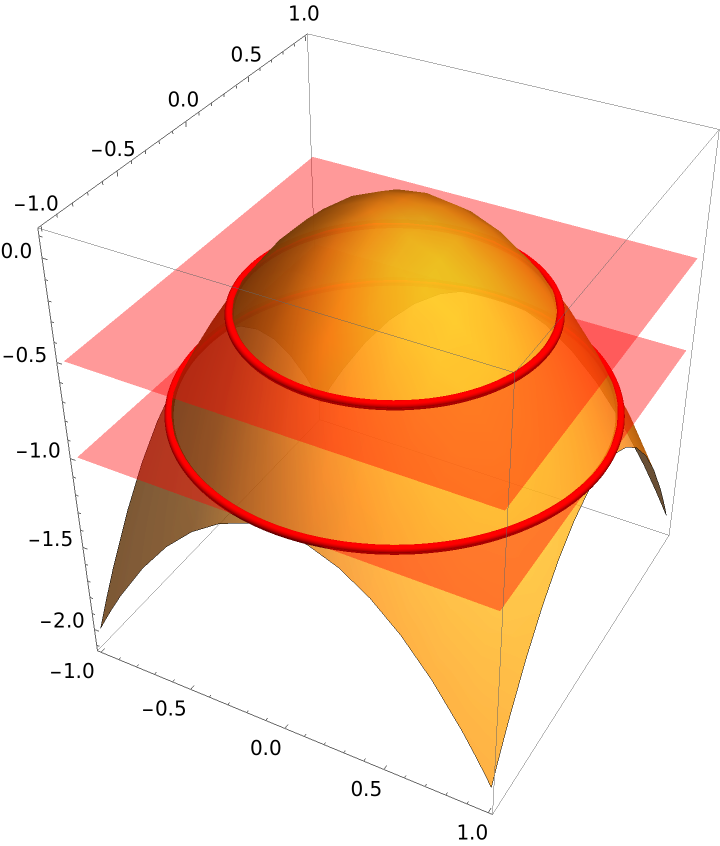 |
Set a style for z-sections:
| In[33]:= | ![ResourceFunction["SectionPlot3D"][-x^2 - y^2, {x, -1, 1}, {y, -1, 1}, "ZSection" -> {-(1/2), -1}, "ZSectionStyle" -> {{Green, Tube[.02]}, {Blue, Tube[.04]}}, BoxRatios -> Automatic]](https://www.wolframcloud.com/obj/resourcesystem/images/2b0/2b053273-f5b8-40e4-b2f4-637e17a82568/3dbe47ede5c8de75.png) |
| Out[33]= | 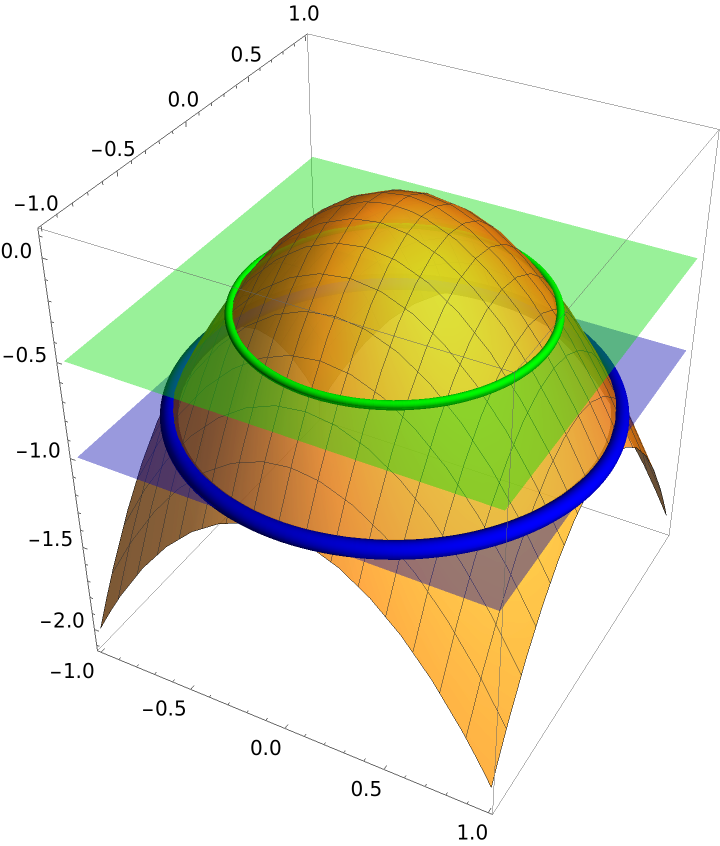 |
SectionPlot3D only allows one color function:
| In[34]:= |
| Out[34]= | 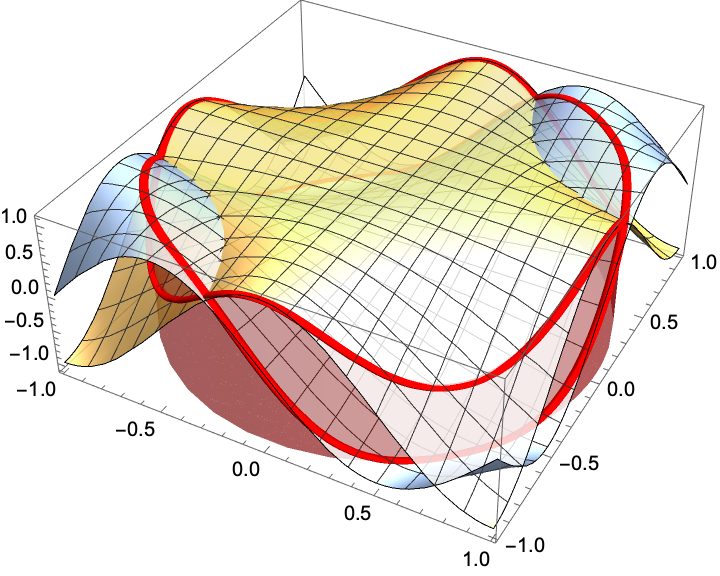 |
If one of the sections is outside the plot range, it is removed and a warning message is given:
| In[35]:= |
| Out[35]= | 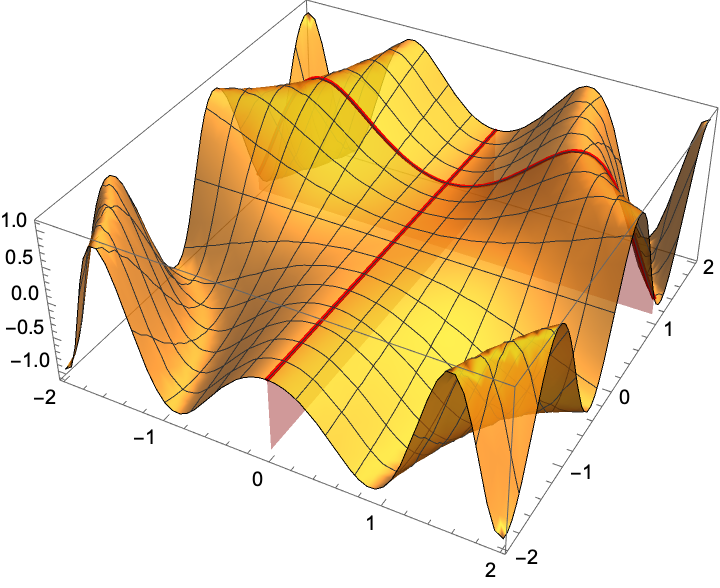 |
"CylinderStyle" does not allow a color directive:
| In[36]:= |
| Out[36]= | 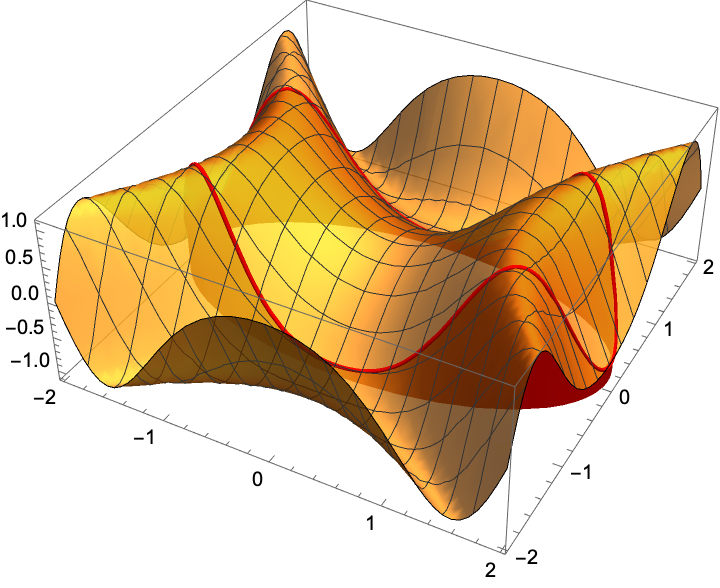 |
"SectionStyle" does not allow a opacity, dashing, or thickness directives. Opacity and dashing are dropped, and thickness is replaced by Tube:
| In[37]:= |
| Out[37]= | 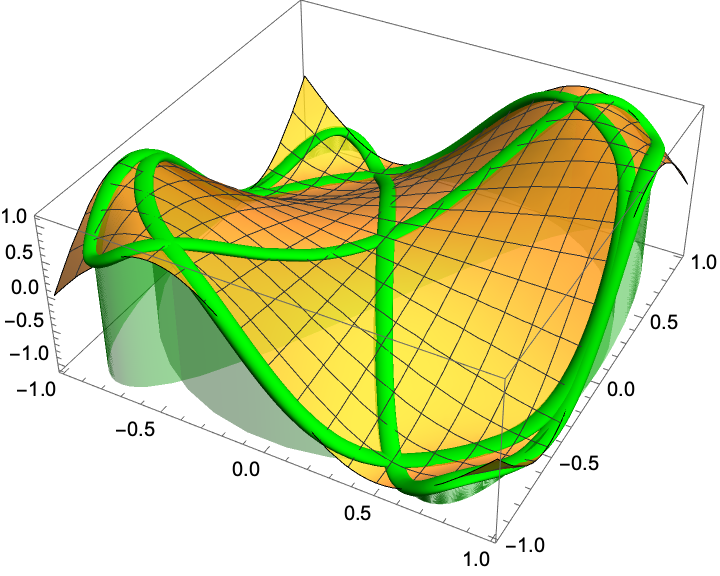 |
"XSectionStyle", "YSectionStyle", "ZSectionStyle", "VSectionStyle", "OSectionStyle" do not accept opacity directives:
| In[38]:= |
| Out[38]= | 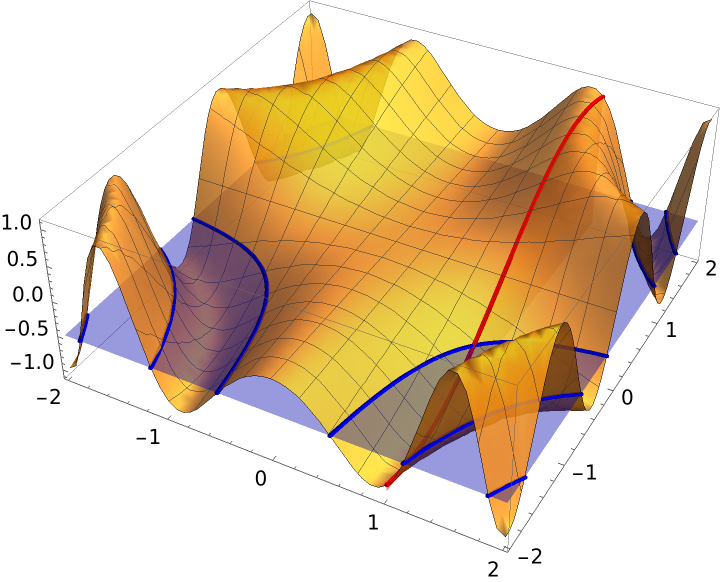 |
"VSection" must be set to one or more functions of x or y, but not both:
| In[39]:= |
| Out[39]= | 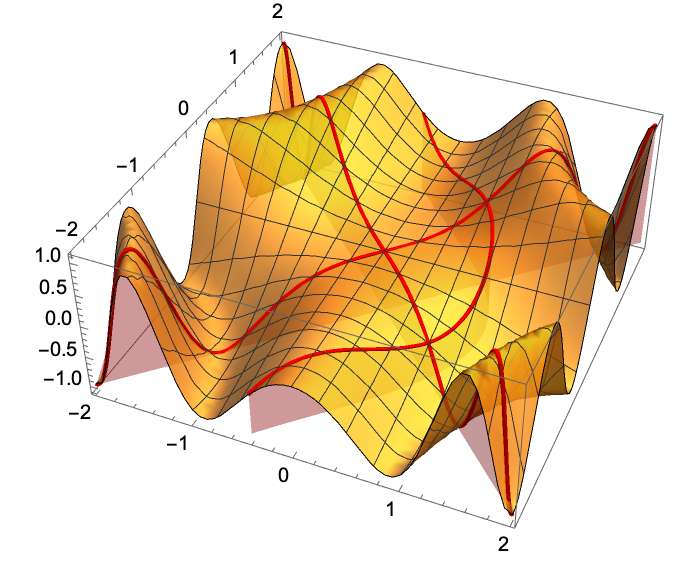 |
This work is licensed under a Creative Commons Attribution 4.0 International License