Wolfram Function Repository
Instant-use add-on functions for the Wolfram Language
Function Repository Resource:
Explore single-cell atlases by tissue type
ResourceFunction["DISCOSingleCellAtlas"][tissue, "CellData"] gives the dataset of cells for a specified tissue. | |
ResourceFunction["DISCOSingleCellAtlas"][tissue,"GeneExpressionData"] gives the dataset of gene expressions for a specified tissue. |
| Index | unique identifier |
| CellType | type of a cell |
| RNACount | total number of RNA transcripts |
| FeatureRNACount | total number of feature RNA transcripts |
| Tissue | name of a tissue |
| AnatomicalSite | more specific anatomical site, if available |
| UMAP | values to construct Uniform Manifold Approximation and Projection (UMAP) graphs |
| CellType | type of a cell |
| Gene | name of a gene |
| Values | pairs of gene expression and unique molecular identifiers (UMI) values |
Retrieve a cell dataset for adrenal glands:
| In[1]:= |
| Out[1]= | 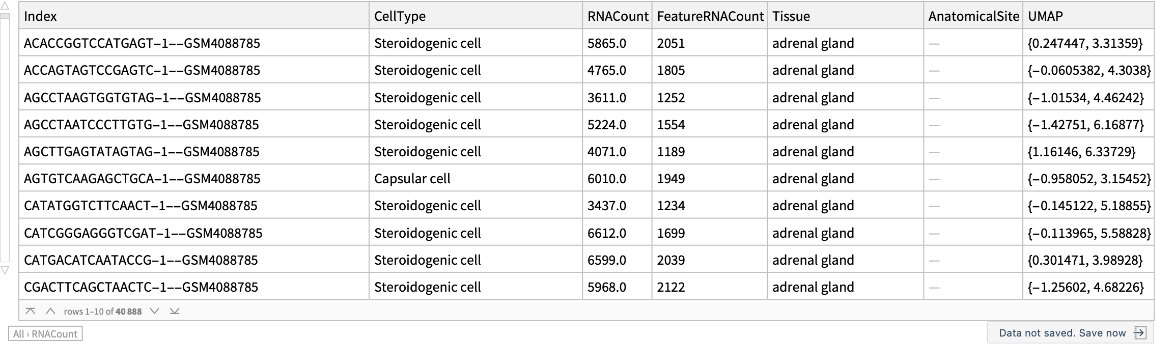 |
Get a gene expression dataset for the adrenal gland. The dataset is large and will take time to download:
| In[2]:= |
| Out[2]= |
View a sample of the data:
| In[3]:= |
| Out[3]= | 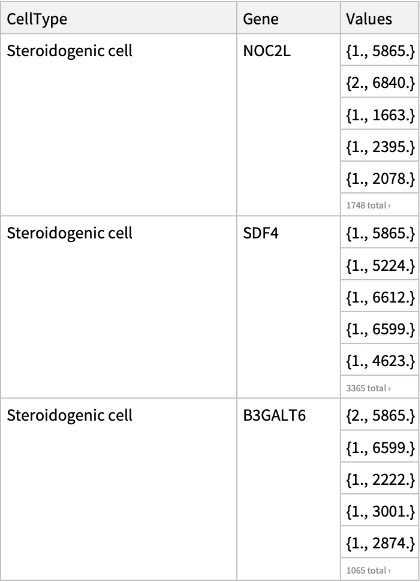 |
Retrieve a cell dataset for adrenal glands:
| In[4]:= |
| Out[4]= | 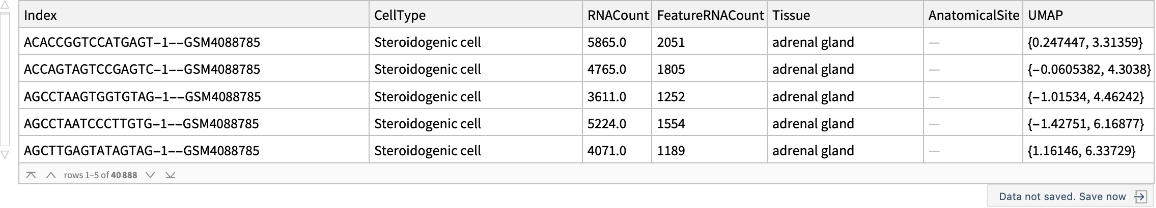 |
Compare the total number of recorded genes across cells:
| In[5]:= | ![expressedGeneCount = ReverseSort[
GroupBy[Normal@celldata[All, {"CellType", "RNACount"}], First -> Last, N@Median@# &]];
BarChart[expressedGeneCount, ChartLabels -> Keys@expressedGeneCount]](https://www.wolframcloud.com/obj/resourcesystem/images/d38/d38c7c51-c02a-4c94-9372-1bc97fb87f4b/20aaf62f2e0820bc.png) |
| Out[6]= | 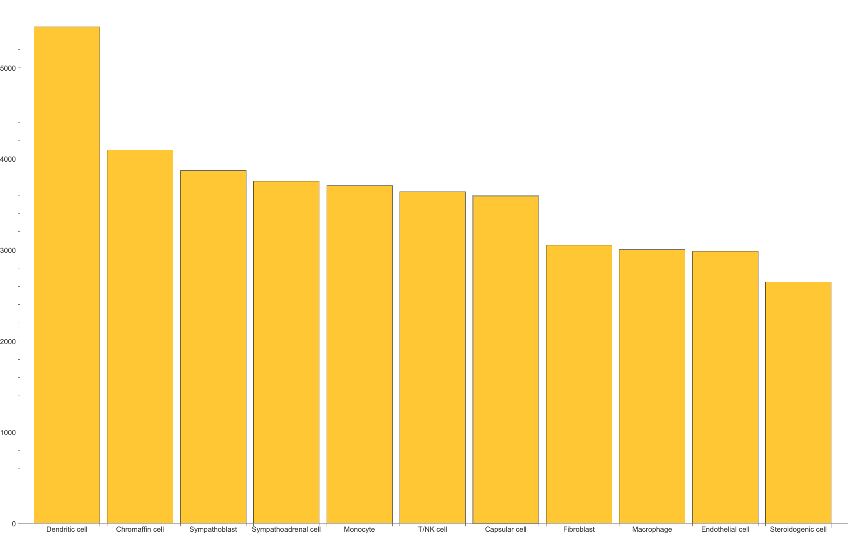 |
Construct a cell overview atlas using Uniform manifold approximation and projection (UMAP):
| In[7]:= | ![umap = GroupBy[Normal@celldata[All, {"CellType", "UMAP"}], First -> Last];
ListPlot[Values@umap, PlotLegends -> Keys@umap, AxesOrigin -> {-15, -15}, AxesLabel -> {"UMAP_1", "UMAP_2"}]](https://www.wolframcloud.com/obj/resourcesystem/images/d38/d38c7c51-c02a-4c94-9372-1bc97fb87f4b/3e593d9f6ada8443.png) |
| Out[8]= | 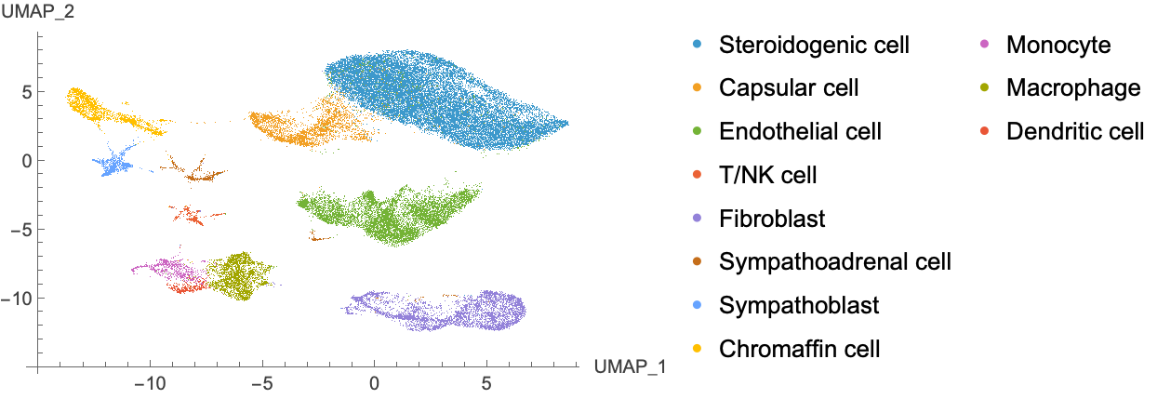 |
Get a gene expression dataset for the adrenal gland. The dataset is large and will take time to download:
| In[9]:= |
| In[10]:= |
| Out[10]= | 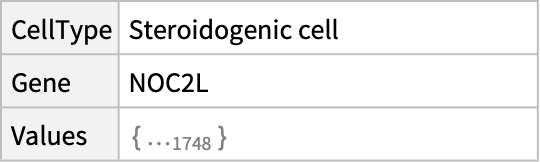 |
Compare gene expressions across cells:
| In[11]:= |
| Out[12]= | 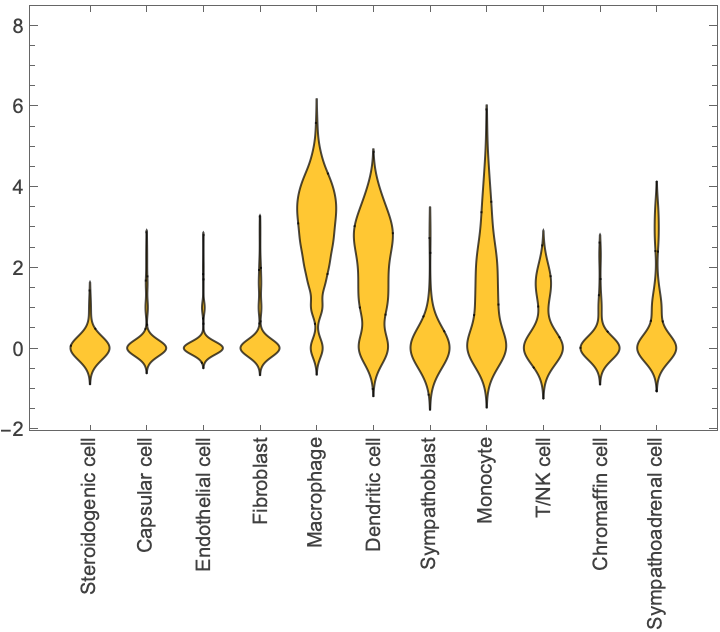 |
Make gene expression matrix for specified genes:
| In[13]:= | 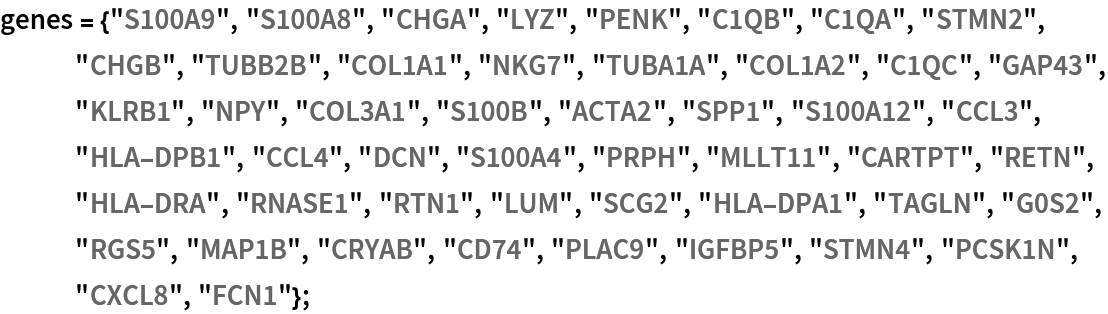 |
| In[14]:= | ![geneexp = KeyUnion[
Association @@@ (Normal@
geneexpdata[Select[MemberQ[genes, #"Gene"] &]][
All, {#"CellType", #"Gene", Log2[(Total@#"Values"[[All, 1]])/(Total[#"Values"[[All, 2]]/
Median[#"Values"[[All, 2]]]])]} &][GroupBy[#[[2]] &]][
genes][Values] /. {cl_String, _, v_} :> Rule[cl, v])];](https://www.wolframcloud.com/obj/resourcesystem/images/d38/d38c7c51-c02a-4c94-9372-1bc97fb87f4b/5b66a845da4bc9b4.png) |
| In[15]:= | ![MatrixPlot[Transpose[Values@geneexp] /. _Missing :> None, FrameTicks -> {MapIndexed[List[#2[[1]], #1] &, Keys@geneexp[[1]]], MapIndexed[List[#2[[1]], Rotate[#1, Pi/2]] &, genes]}, PlotRangePadding -> .5, PlotLegends -> Automatic, Mesh -> All, PlotRange -> All, ClippingStyle -> None]](https://www.wolframcloud.com/obj/resourcesystem/images/d38/d38c7c51-c02a-4c94-9372-1bc97fb87f4b/407e2704606c4a1b.png) |
| Out[15]= | 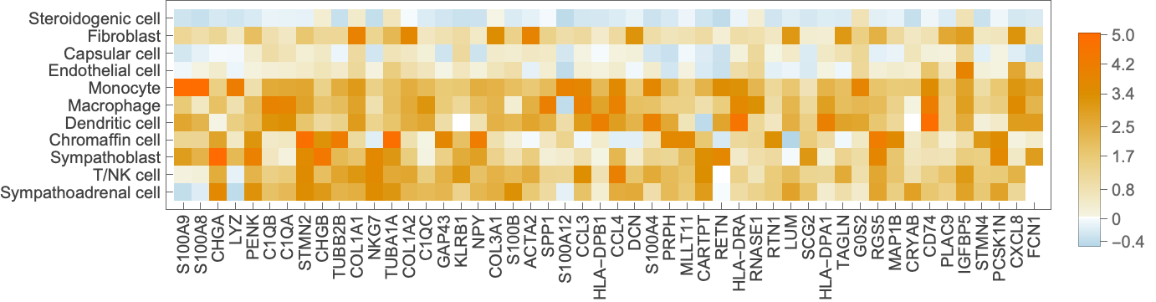 |
Create a plot with bubbles illustrating % expressed in cells:
| In[16]:= | ![cellct = Association[
Rule @@@ Normal@Tally[celldata[All, "CellType"]]]; geneexpct = KeyUnion[
Association @@@ (Normal@
geneexpdata[Select[MemberQ[genes, #"Gene"] &]][
All, {#"CellType", #"Gene", Length[#"Values"]*100/cellct[#"CellType"] // N, Log2[(Total@#"Values"[[All, 1]])/(Total[#"Values"[[All, 2]]/
Median[#"Values"[[All, 2]]]])]} &][GroupBy[#[[2]] &]][
genes][Values] /. {cl_String, _, c_, v_} :> Rule[cl, {c, v}])];](https://www.wolframcloud.com/obj/resourcesystem/images/d38/d38c7c51-c02a-4c94-9372-1bc97fb87f4b/2e76eb4baac16a7e.png) |
| In[17]:= | ![Legended[
BubbleChart[
MapThread[
Style[Flatten@{#1, #3}, ColorData[{"BeachColors", "Reverse"}][#2]] &, {#[[All, 1 ;; 2]],
Rescale[#[[All, 4]], MinMax@#[[All, 4]]], #[[All, 3]]}] &@
Flatten[MapIndexed[Flatten /@ Thread[List[#2[[1]], #1]] &, MapIndexed[List[#2[[1]], #1] &, #] & /@ Values@geneexpct] /. _Missing :> Sequence[0, 0], 1], BubbleSizes -> {.01, .02}, FrameTicks -> {{MapIndexed[List[#2[[1]], #1] &, Keys@geneexpct[[1]]],
Automatic}, {MapIndexed[List[#2[[1]], Rotate[#1, Pi/2]] &, genes], Automatic}}, GridLines -> {Function[{min, max}, Range[Floor[min], Ceiling[max]]],
None}, PlotRangePadding -> Scaled[.01], ImageSize -> 500], Column[{BarLegend[{"BeachColors", "Reverse"}, LegendLayout -> "Row", LegendLabel -> "scaled gene expression"], SwatchLegend[Table[Blue, 5], {0, 25, 50, 75, 100}, LegendMarkers -> Graphics[{Gray, Circle[]}], LegendMarkerSize -> {.01, .0125, .015, .0175, .02}*700, LegendLayout -> "Row", LegendLabel -> "expressed in cells (%)"]}]]](https://www.wolframcloud.com/obj/resourcesystem/images/d38/d38c7c51-c02a-4c94-9372-1bc97fb87f4b/768dff159c79e482.png) |
| Out[17]= | 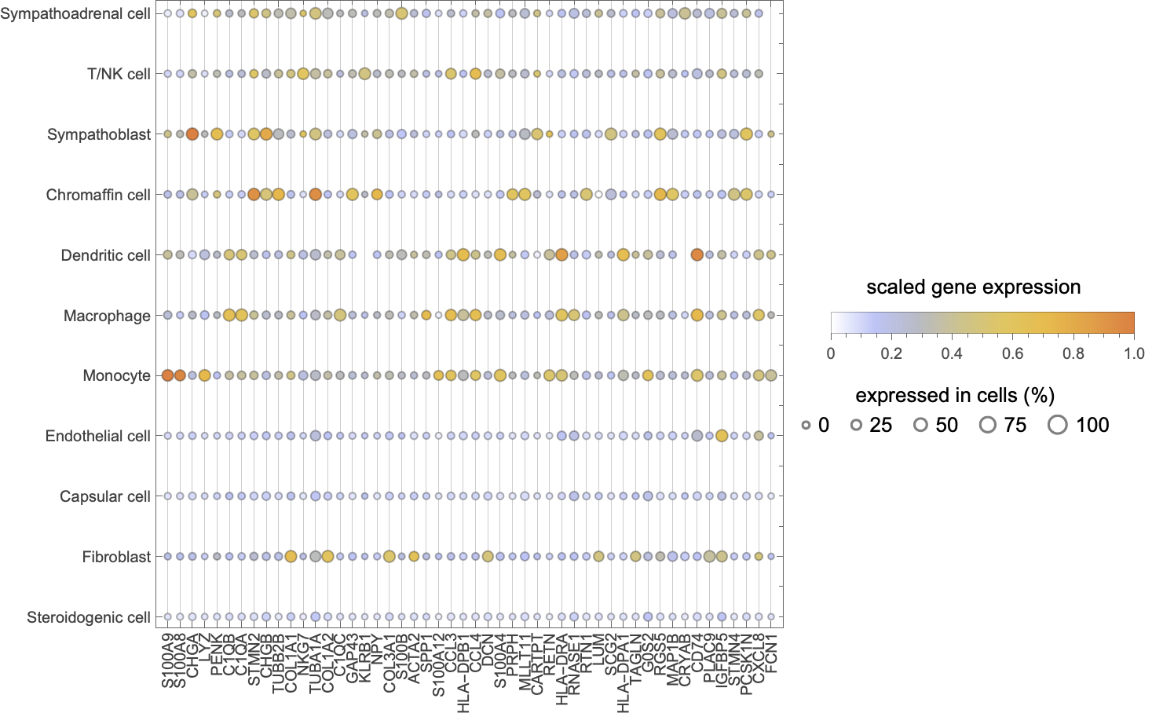 |
Wolfram Language 13.0 (December 2021) or above
This work is licensed under a Creative Commons Attribution 4.0 International License