Wolfram Function Repository
Instant-use add-on functions for the Wolfram Language
Function Repository Resource:
Plot data as bubbles on polar axes
ResourceFunction["PolarBubblePlot"][{{angle1,r1,size1},…}] plots bubbles at positions anglei,ri with sizes sizei in a polar plot.. |
Create a simple polar bubble plot for increasing angles, radii and size:
| In[1]:= |
| Out[1]= | 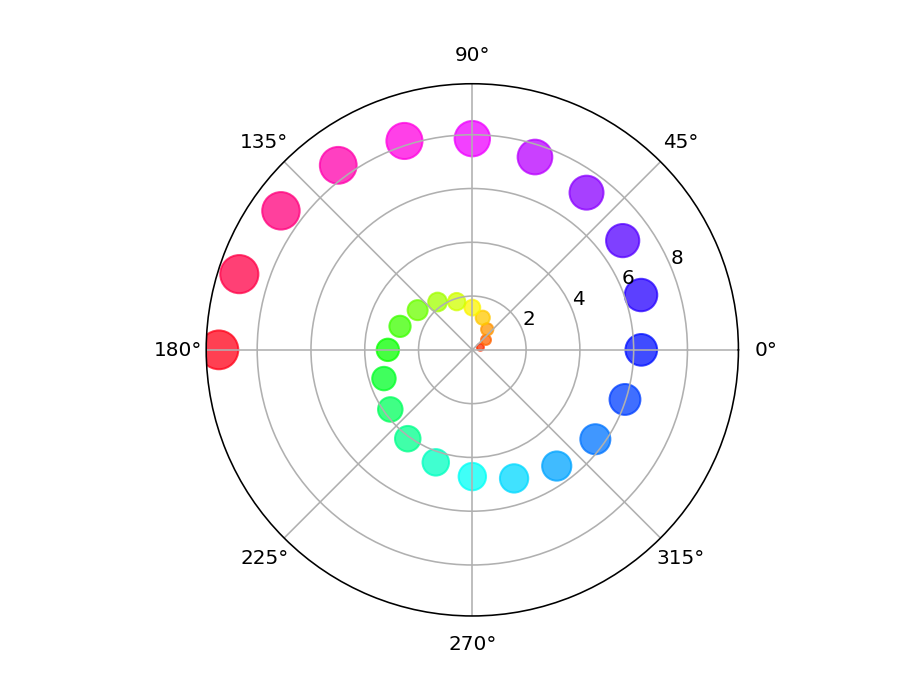 |
Create a polar bubble plot with random data:
| In[2]:= |
| In[3]:= | ![data = Transpose[{
RandomReal[{0, 2 \[Pi]}, n],
RandomReal[{0, 1}, n],
RandomReal[{10, 800}, n]
}];](https://www.wolframcloud.com/obj/resourcesystem/images/a25/a258a531-2220-4bad-9262-13ff9d7d4e20/5c98cb07d816e872.png) |
| In[4]:= |
| Out[4]= | 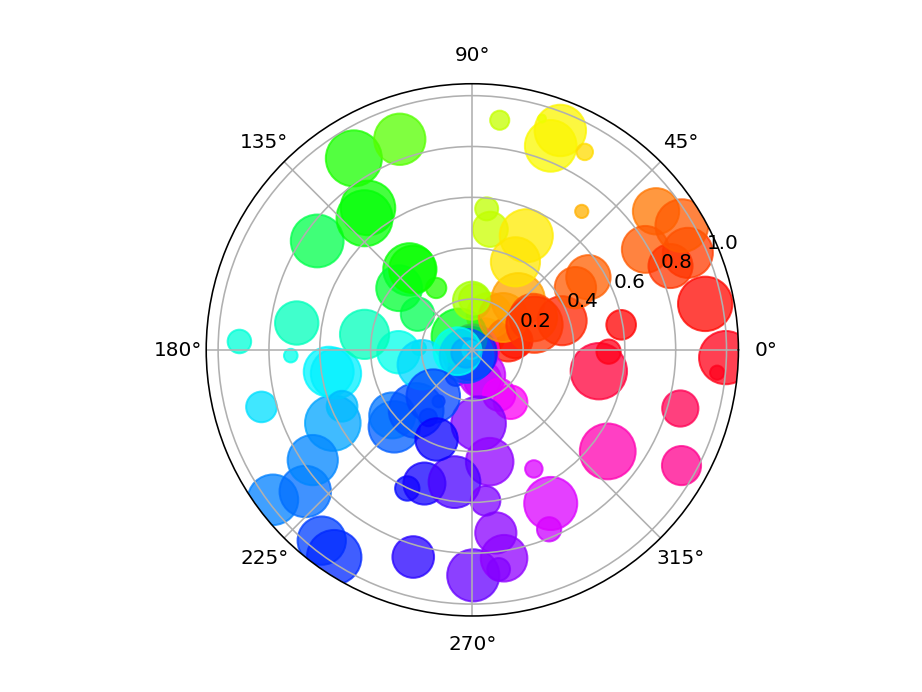 |
This work is licensed under a Creative Commons Attribution 4.0 International License