Wolfram Function Repository
Instant-use add-on functions for the Wolfram Language
Function Repository Resource:
Create a bar chart comparing the content of the nine essential amino acids in a list of foods
ResourceFunction["EssentialAminoAcidsChart"][foods] returns essential amino acid information in a BarChart for a list of foods. |
| ChartLabels | Before | food names |
| ChartLegends | Below | nutrient properties |
| BarOrigin | Left | origin placement for bars |
| FontSize | 10 | font size of chart labels and legends |
| PlotLabel | "" | optional overall label for chart |
| ImageSize | 600 | overall image size expressed in points |
| ImageMargins | Automatic | absolute margins around image |
| Background | Automatic | background color for chart |
Compare the essential amino acids in these fish, which also are good sources of omega-3 fatty acids:
| In[1]:= |
| Out[1]= | 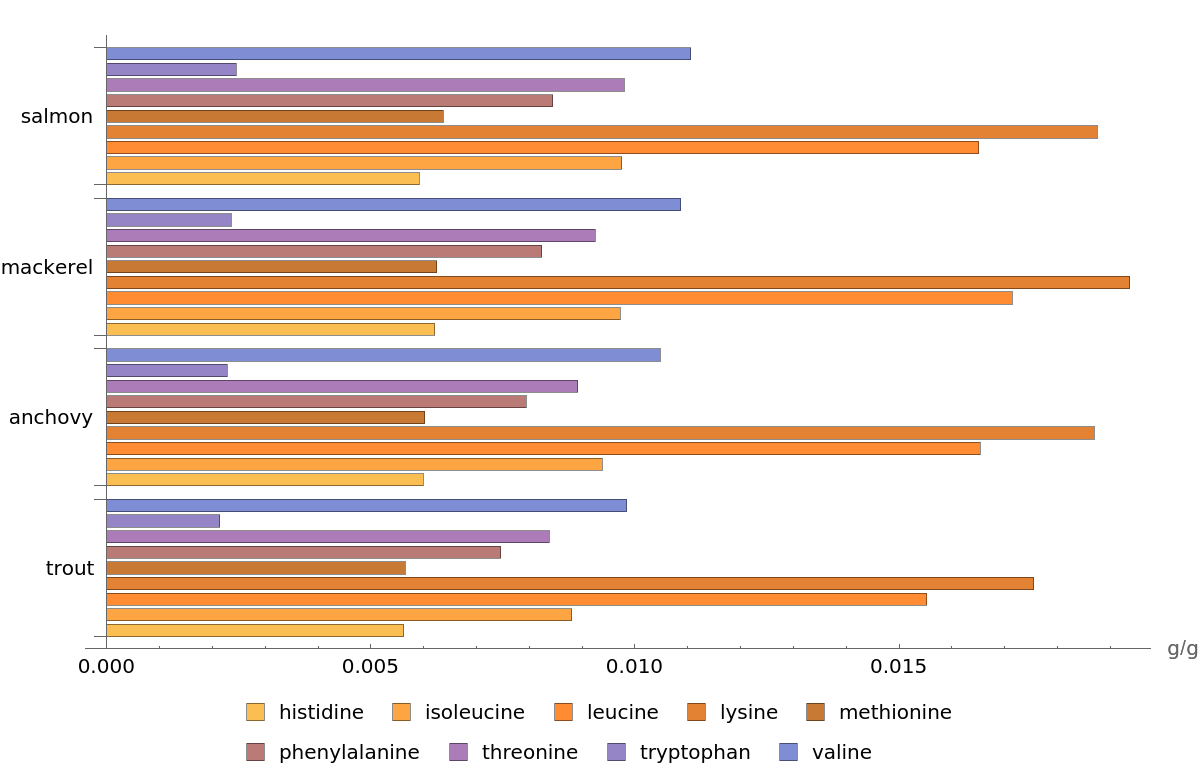 |
Visualize the essential amino acids with a customized chart design:
| In[2]:= | ![ResourceFunction[
"EssentialAminoAcidsChart"][{"trout", "anchovy", "mackerel", "salmon"}, BarOrigin -> Bottom, ChartLabels -> Below, ChartLegends -> Right, ChartStyle -> "DarkBands", PlotLabel -> "Comparison of Essential Amino Acids"]](https://www.wolframcloud.com/obj/resourcesystem/images/a1b/a1bb44c3-98b4-4fef-9d8a-a3c182f90e16/7bf5e295146fe127.png) |
| Out[2]= | 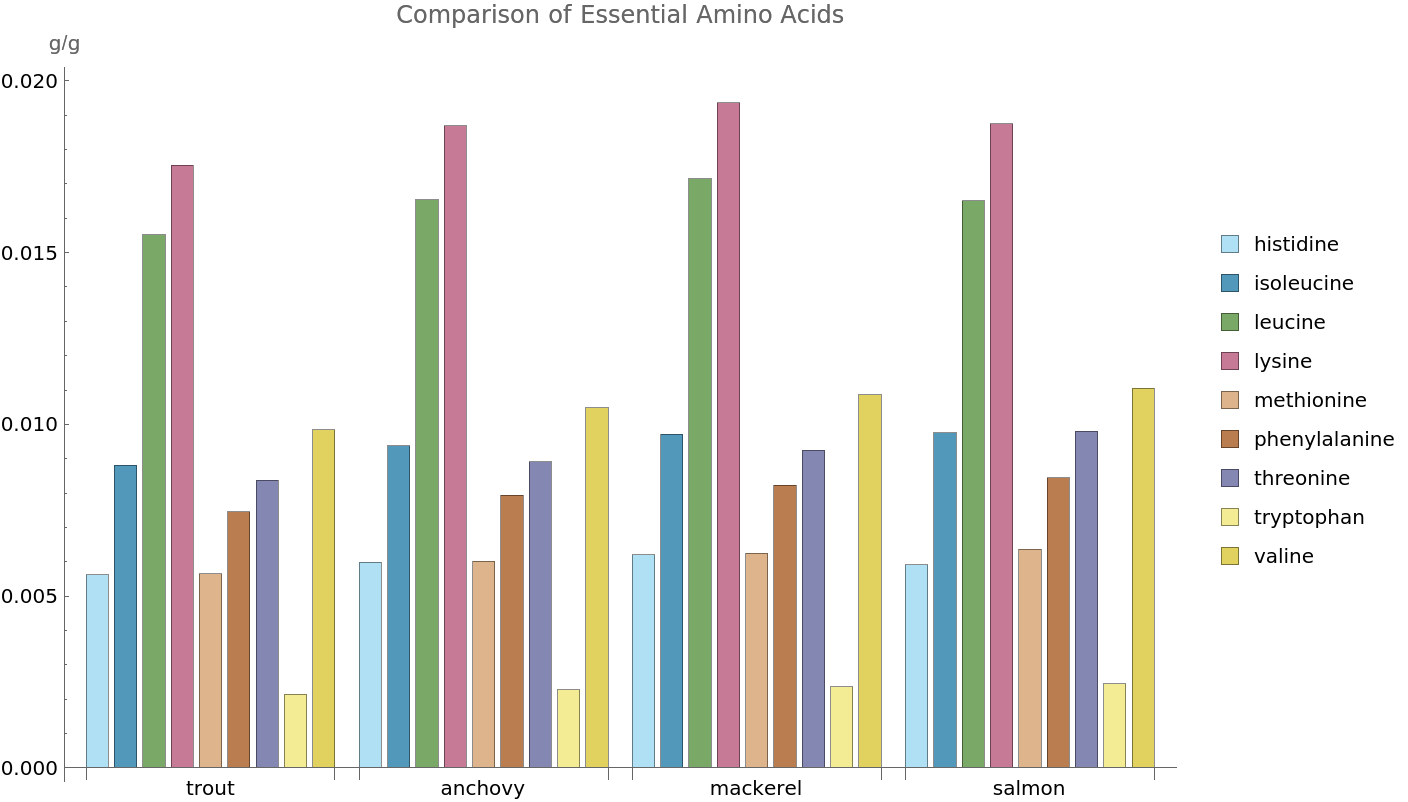 |
Use ChartElements and other BarChart options to draw attention to your chart:
| In[4]:= | ![ResourceFunction["EssentialAminoAcidsChart"][{"walnuts"}, ChartElements -> \!\(\*
GraphicsBox[DiskBox[{0, 0}],
ImageSize->{22., Automatic}]\), ChartLabels -> Above, ChartStyle -> "BrightBands", Background -> LightYellow, ImageMargins -> 10, ImageSize -> Medium]](https://www.wolframcloud.com/obj/resourcesystem/images/a1b/a1bb44c3-98b4-4fef-9d8a-a3c182f90e16/2c3e9723e4213e4b.png) |
| Out[4]= | 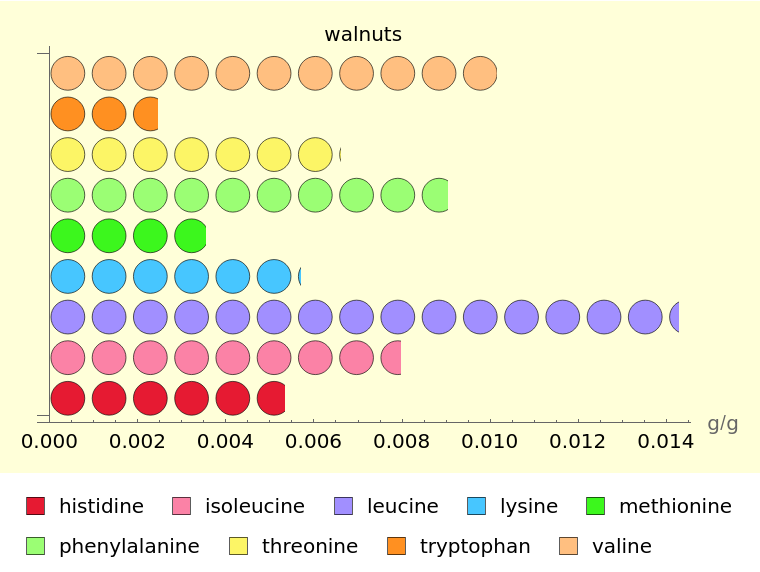 |
Planning beans or lentils with rice for dinner? Pair different varieties to see the most nutritious combination of essential amino acids:
| In[5]:= | ![(* Evaluate this cell to get the example input *) CloudGet["https://www.wolframcloud.com/obj/2d9b35af-92c1-463d-ae53-bc00a4396216"]](https://www.wolframcloud.com/obj/resourcesystem/images/a1b/a1bb44c3-98b4-4fef-9d8a-a3c182f90e16/3f3f505a9ea8235e.png) |
| Out[8]= | 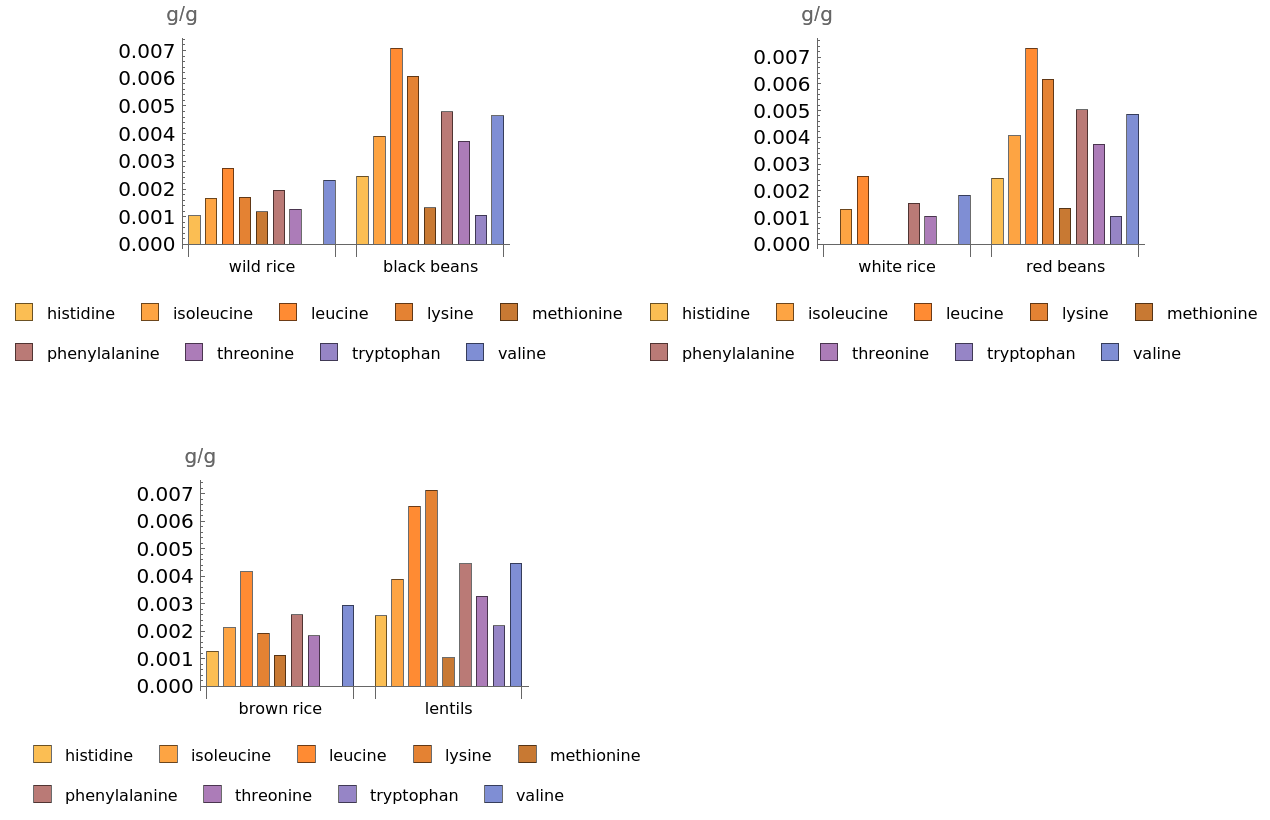 |
Write a custom ChartElementFunction for a unique and artistic visualization:
| In[9]:= | ![g[{{xmin_, xmax_}, {ymin_, ymax_}}, ___] := Polygon[{{xmin, ymin}, {xmax, ymax}, {xmin, ymax}, {xmax, ymin}}]
ResourceFunction["EssentialAminoAcidsChart"][{"cottage cheese"}, ChartElementFunction -> g, BarOrigin -> Bottom, ChartLabels -> Above,
ChartLegends -> Right, ChartStyle -> "BlueGreenYellow"]](https://www.wolframcloud.com/obj/resourcesystem/images/a1b/a1bb44c3-98b4-4fef-9d8a-a3c182f90e16/36821ba464078b6b.png) |
| Out[10]= | 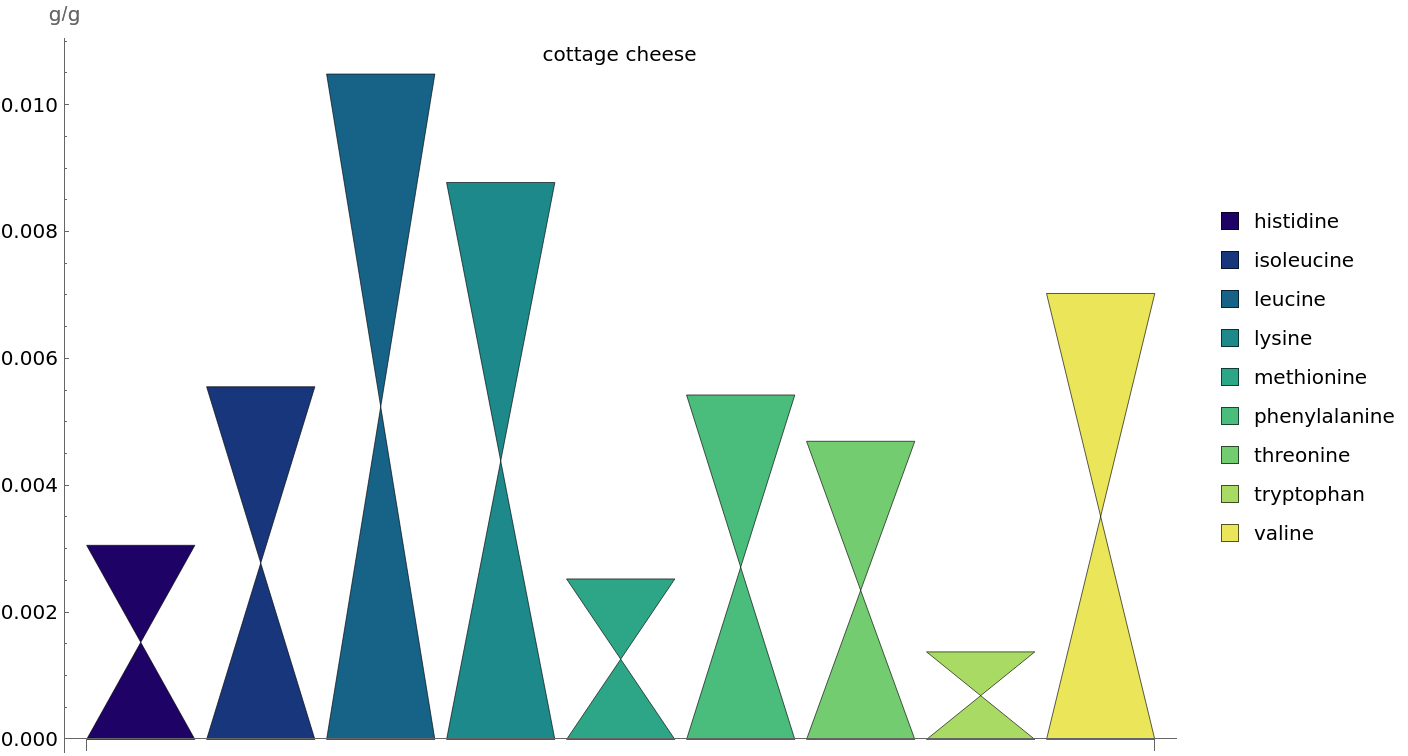 |
Wolfram Language 13.0 (December 2021) or above
This work is licensed under a Creative Commons Attribution 4.0 International License
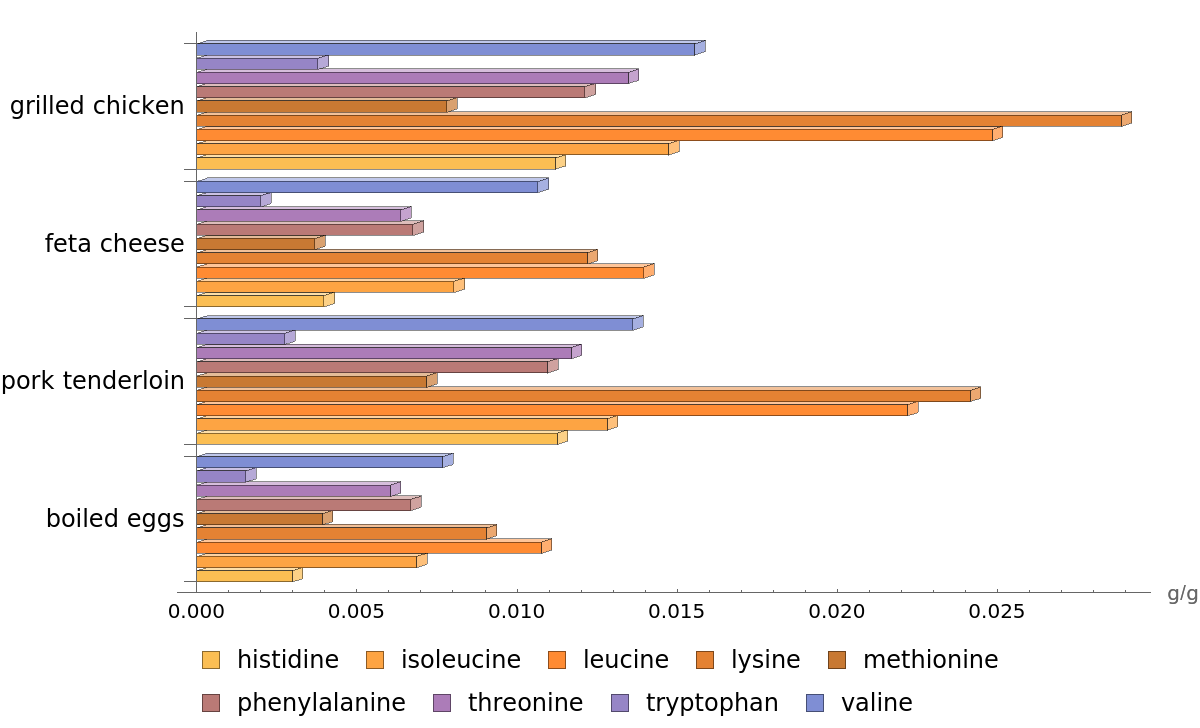
![ResourceFunction[
"EssentialAminoAcidsChart"][{"boiled eggs", "pork tenderloin", "feta cheese", "grilled chicken"}, FontSize -> 12, ChartElementFunction -> "ObliqueRectangle"]](https://www.wolframcloud.com/obj/resourcesystem/images/a1b/a1bb44c3-98b4-4fef-9d8a-a3c182f90e16/0f3582f140796b9f.png)