Wolfram Function Repository
Instant-use add-on functions for the Wolfram Language
Function Repository Resource:
Get one of five related color schemes with favorable perceptual properties
ResourceFunction["ViridisColor"][x] evaluates the viridis color scheme at x. | |
ResourceFunction["ViridisColor"]["cname",x] evaluates the color scheme specified by "cname" at x. | |
ResourceFunction["ViridisColor"][{xmin,xmax},x] evaluates the viridis color scheme at x between xmin and xmax. | |
ResourceFunction["ViridisColor"]["Reverse",x] evaluates the viridis color scheme at x with reversed color order. | |
ResourceFunction["ViridisColor"][{"cname","Reverse"},x] evaluates the color scheme specified by "cname" in reverse at x. | |
ResourceFunction["ViridisColor"][{"cname",{xmin,xmax}},x] evaluates the color scheme specified by "cname" at x between xmin and xmax. |
Evaluate the viridis color map for a value of 0.8:
| In[1]:= |
| Out[1]= |
Use the viridis color map for a density plot:
| In[2]:= |
| Out[2]= | 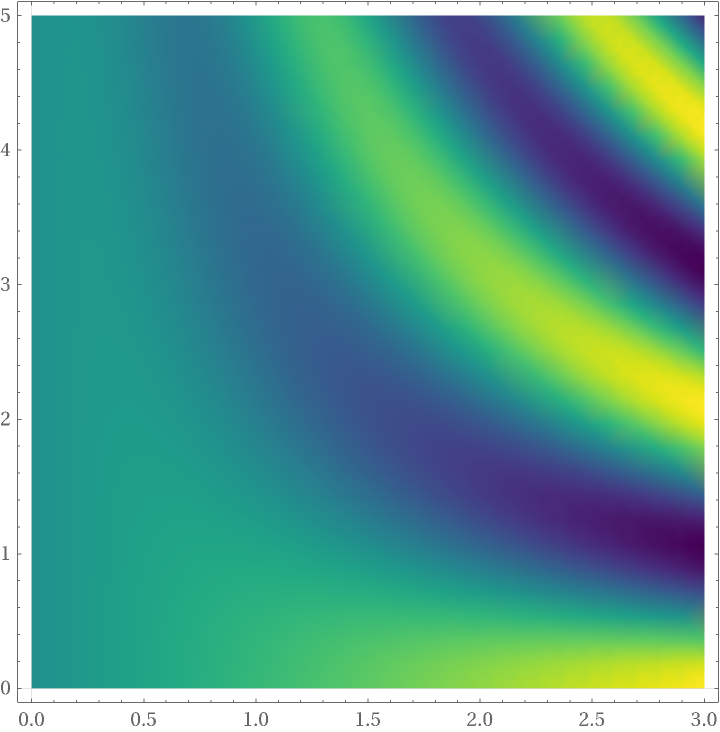 |
List the available color schemes:
| In[3]:= |
| Out[3]= |
Get a color scheme by name and use it:
| In[4]:= |
| Out[4]= |
Get a reversed color scheme by name and use it:
| In[5]:= |
| Out[5]= |
ViridisColor supports a family of all related color maps, with viridis as the default:
| In[6]:= |
| Out[6]= | 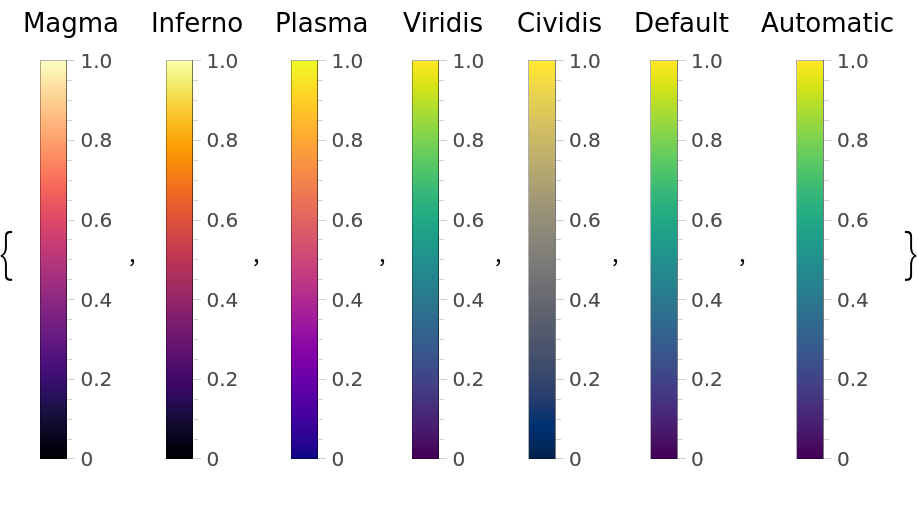 |
Use the viridis color scheme in Plot3D:
| In[7]:= | ![Plot3D[Sin[x]/(Sqrt[x] + 1)*Cos[y], {x, -3 Pi, 3 Pi}, {y, -Pi, 2 Pi}, PlotRange -> All,
PlotLegends -> Automatic,
ColorFunction -> (ResourceFunction["ViridisColor"][#3] &)]](https://www.wolframcloud.com/obj/resourcesystem/images/c33/c337bfe2-97b2-4140-ba35-a2a0afb72b8e/557111298003769b.png) |
| Out[7]= | 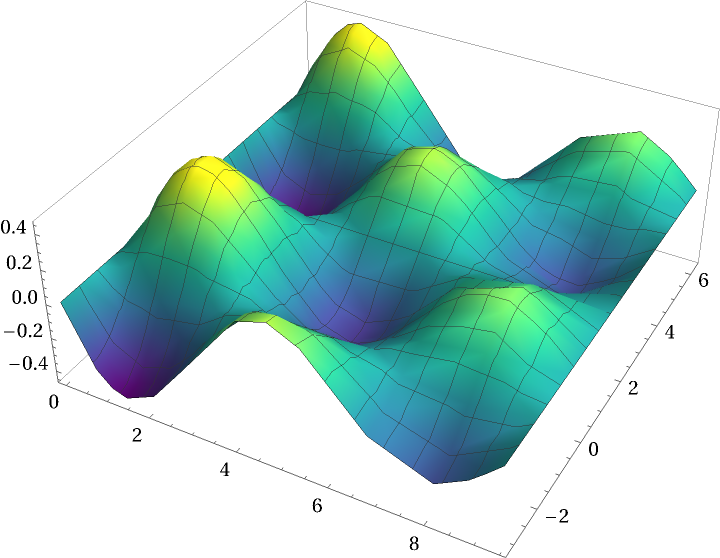 |
Color an image with the viridis color scheme:
| In[8]:= |
| Out[8]= | 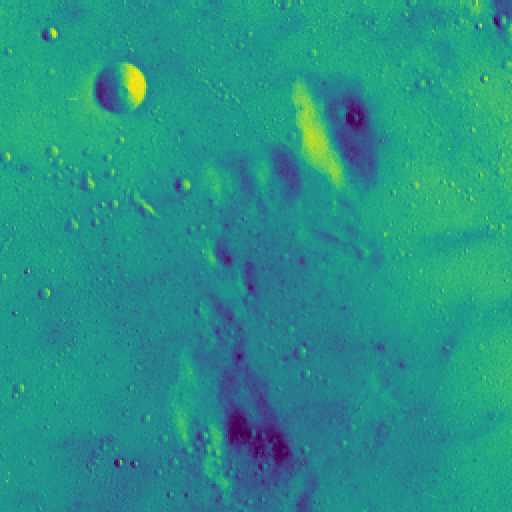 |
ViridisColor clamps the input to a region of zero to one:
| In[9]:= |
| Out[9]= |
ViridisColor can be used with a range specification:
| In[10]:= |
| Out[10]= |
ViridisColor can be used with a range and color specification:
| In[11]:= |
| Out[11]= |
Converted to grayscale, all color maps yield a dark to light gradient:
| In[12]:= | ![BarLegend[{Function[x, ColorConvert[ResourceFunction["ViridisColor"][#, x], "Grayscale"]], {0, 1}}, LegendLabel -> #] & /@ {"Magma", "Inferno", "Plasma", "Viridis", "Cividis", "Default", Automatic}](https://www.wolframcloud.com/obj/resourcesystem/images/c33/c337bfe2-97b2-4140-ba35-a2a0afb72b8e/00985427c182e42c.png) |
| Out[12]= | 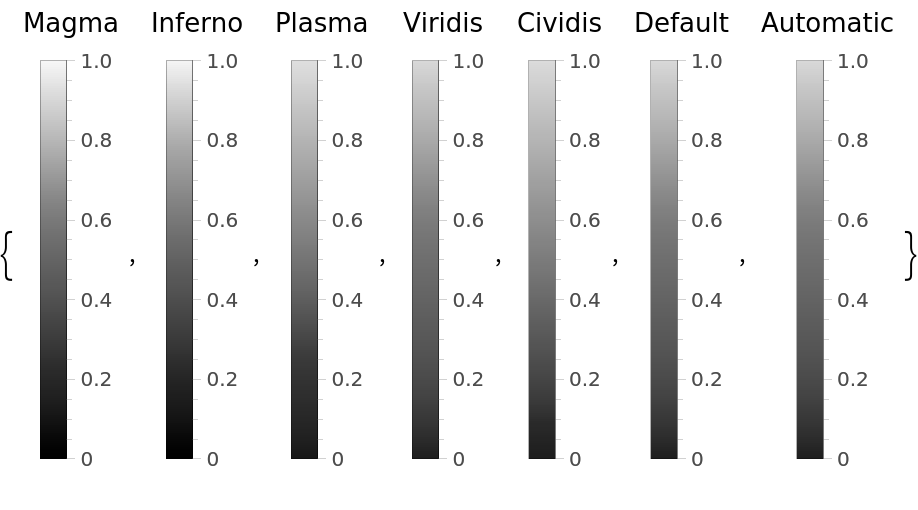 |
ViridisColor clamps values and thus needs ColorFunctionScaling to be True to use the whole value range:
| In[13]:= | ![DensityPlot[Exp[-x^2 + y/3], {x, -3, 3}, {y, -2, 2}, PlotRange -> All,
PlotPoints -> 40,
PlotLegends -> Automatic, ColorFunctionScaling -> False,
ColorFunction -> (ResourceFunction["ViridisColor"][#] &)]](https://www.wolframcloud.com/obj/resourcesystem/images/c33/c337bfe2-97b2-4140-ba35-a2a0afb72b8e/52a41294fa7402e3.png) |
| Out[13]= | 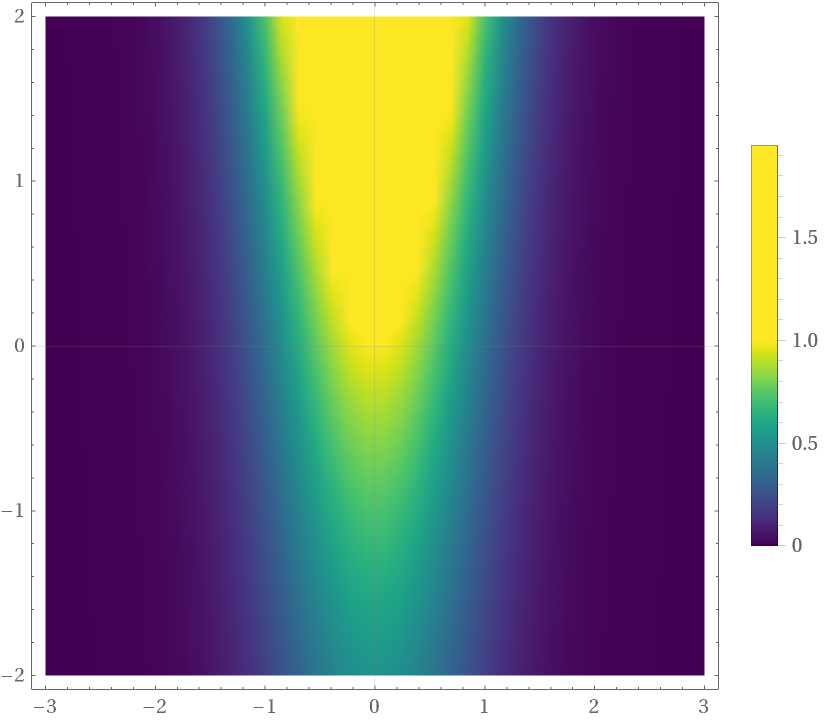 |
All color maps and especially cividis are colorblind friendly:
| In[14]:= | ![Grid[Function[colorMapStr,
{colorMapStr}~Join~(
DensityPlot[Exp[-x^2 + y/3], {x, -3, 3}, {y, -2, 2}, PlotRange -> All, ImageSize -> 100, PlotPoints -> 10, MaxRecursion -> 0,
PlotLabel -> #2,
ColorFunction -> Function[
q, (ResourceFunction["ViridisColor"][colorMapStr, q] /. RGBColor[r_, g_, b_] :> RGBColor[#1 . {r, g, b}])]] & @@@ {
{IdentityMatrix[3], "Normal vision"},
{{{0.57, 0.43, 0}, {0.56, 0.44, 0}, {0, 0.24, 0.76}}, "Protanopia"},
{{{0.97, 0.3, 0}, {0, 0.73, 0.27}, {0, 0.18, 0.82}}, "Tritanomaly"},
{{{0.62, 0.32, 0.06}, {0.16, 0.78, 0.06}, {0.16, 0.32, 0.52}}, "Achromatomaly"},
{ConstantArray[{0.3, 0.59, 0.11}, 3], "Achromatopsia"}
}
)
] /@ {"Viridis", "Cividis", "Magma", "Inferno", "Plasma"}]](https://www.wolframcloud.com/obj/resourcesystem/images/c33/c337bfe2-97b2-4140-ba35-a2a0afb72b8e/1a73482e748cace0.png) |
| Out[14]= |  |
This work is licensed under a Creative Commons Attribution 4.0 International License