Wolfram Function Repository
Instant-use add-on functions for the Wolfram Language
Function Repository Resource:
Visualize the taxonomy graph of a given species
ResourceFunction["TaxonomyGraph"][species] visualizes the taxonomy graph for a specified species entity. |
Visualize the taxonomy graph of an animal:
| In[1]:= |
| Out[1]= | 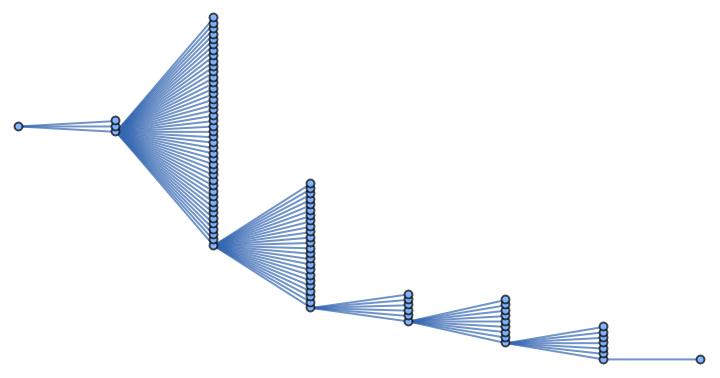 |
Visualize the taxonomy graph of a plant:
| In[2]:= |
| Out[2]= | 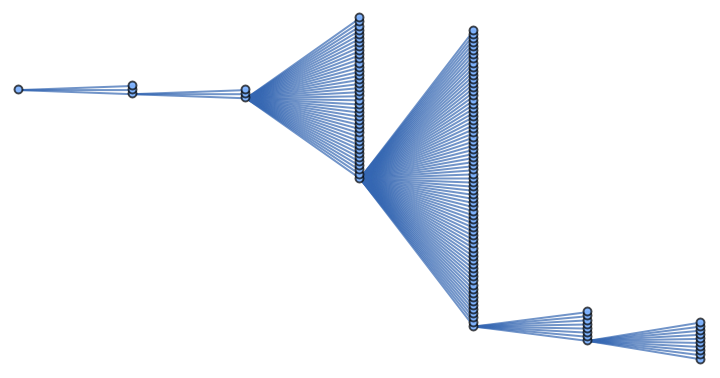 |
Highlight taxa of interest:
| In[3]:= | ![ResourceFunction["TaxonomyGraph"][
Entity["TaxonomicSpecies", "LoxodontaAfricana::qtsb3"], GraphHighlight -> {Entity["TaxonomicSpecies", "LoxodontaAfricana::qtsb3"], Entity["TaxonomicSpecies", "Mammalia::5448z"]}]](https://www.wolframcloud.com/obj/resourcesystem/images/e44/e44c8aef-dfcb-4b55-8a48-7223c5562ccb/6c1802ea440b066b.png) |
| Out[3]= | 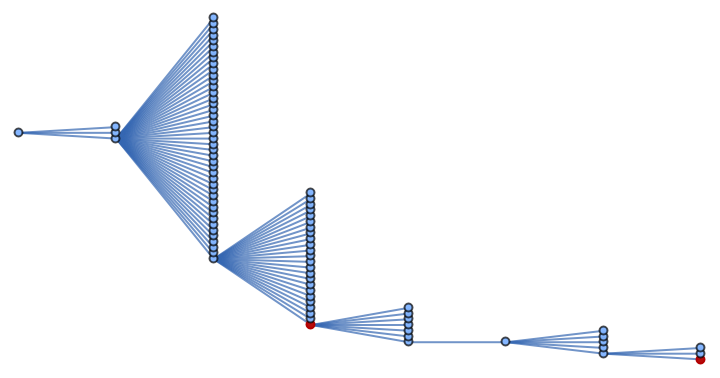 |
Specify the layout of a graph:
| In[4]:= |
| Out[4]= | 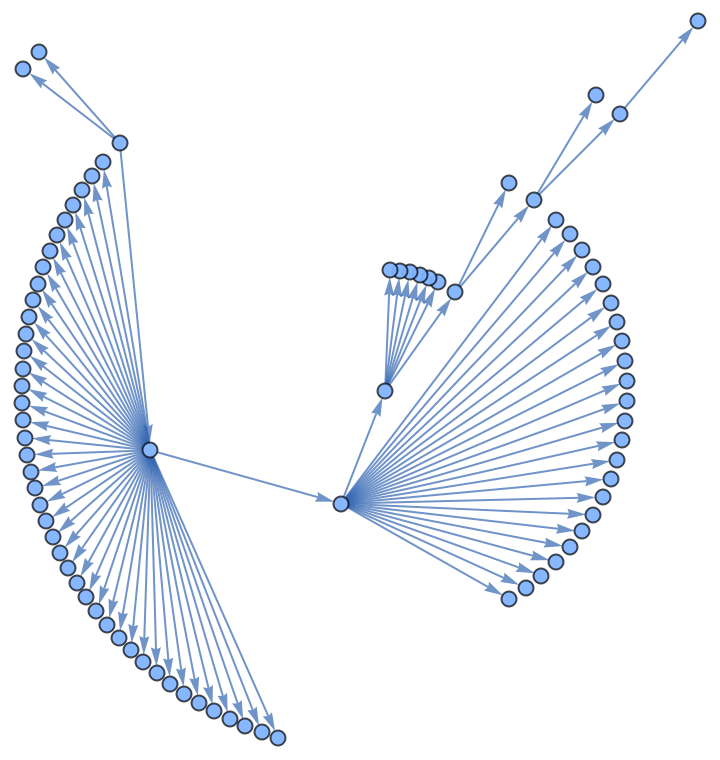 |
Combine the taxonomy graphs of two species:
| In[5]:= |
| In[6]:= | ![GraphUnion[
Sequence @@ Map[ResourceFunction["TaxonomyGraph"][#] &, species], GraphLayout -> "RadialDrawing", VertexLabels -> Placed["Name", Tooltip], GraphHighlight -> species]](https://www.wolframcloud.com/obj/resourcesystem/images/e44/e44c8aef-dfcb-4b55-8a48-7223c5562ccb/1b86c6d4fd5083d2.png) |
| Out[6]= | 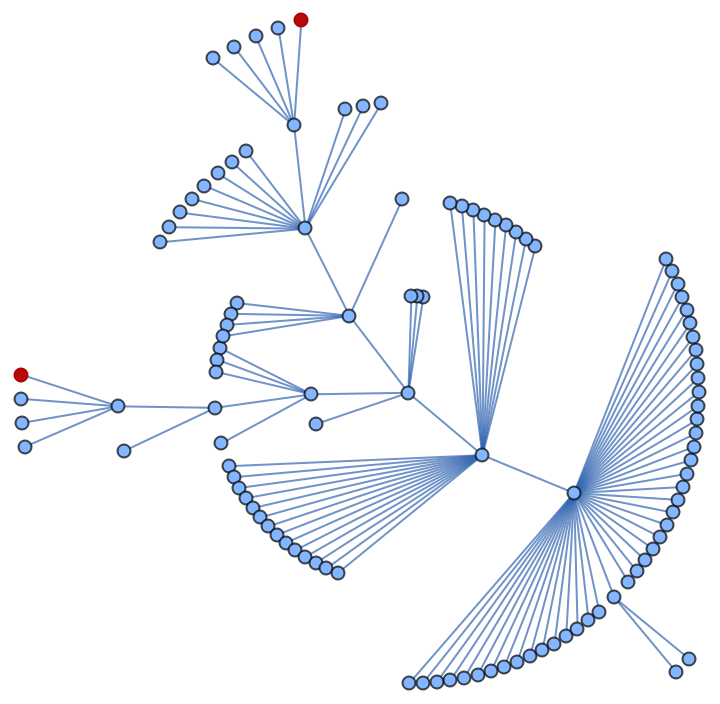 |
Trying to visualize the non-species entity returns a Missing value:
| In[7]:= |
| Out[7]= |
Wolfram Language 13.0 (December 2021) or above
This work is licensed under a Creative Commons Attribution 4.0 International License