Wolfram Function Repository
Instant-use add-on functions for the Wolfram Language
Function Repository Resource:
Create intricate emergent patterns by connecting the positions of planets over a range of dates
ResourceFunction["SolarSystemMandala"][entity,period,incr] generates a mandala plotting a single line along the path of entity over period with stepsize incr. | |
ResourceFunction["SolarSystemMandala"][entity1,entity2,period,incr] generates a mandala plotting lines between entity1 and entity2. |
| AstroReferenceFrame | "Ecliptic" | observation data (frame, date, location, …) |
| "LineColors" | {ColorData[106,6]} | one or more colors to use for lines |
| "LineOpacity" | 1 | opacity value to apply to lines |
| "StartDate" | Now | date for the mandala to start from |
Compute a mandala of Mars as observed from Earth in the ecliptic coordinate system:
| In[1]:= |
| Out[1]= | 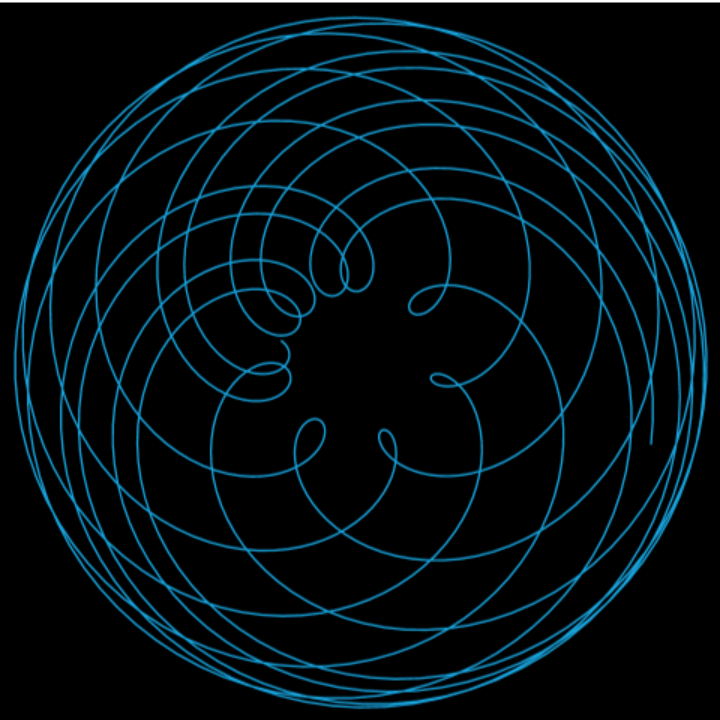 |
Compute a mandala using a line between Venus and Mercury over two orbits of Venus:
| In[2]:= | ![ResourceFunction["SolarSystemMandala"][Entity["Planet", "Venus"], Entity["Planet", "Mercury"], 2 Entity["Planet", "Venus"]["OrbitPeriod"], Quantity[.03, "Months"]]](https://www.wolframcloud.com/obj/resourcesystem/images/349/349d6ce2-fab0-4bbb-bc90-cbb0f75bd086/2e53c7269941bf04.png) |
| Out[2]= |  |
Emergent patterns are minimal over short time spans:
| In[3]:= | ![ResourceFunction["SolarSystemMandala"][Entity["Planet", "Earth"], Entity["Planet", "Mercury"], .25 Entity["Planet", "Earth"]["OrbitPeriod"], Quantity[1, "Days"]]](https://www.wolframcloud.com/obj/resourcesystem/images/349/349d6ce2-fab0-4bbb-bc90-cbb0f75bd086/1af313699cdef991.png) |
| Out[3]= | 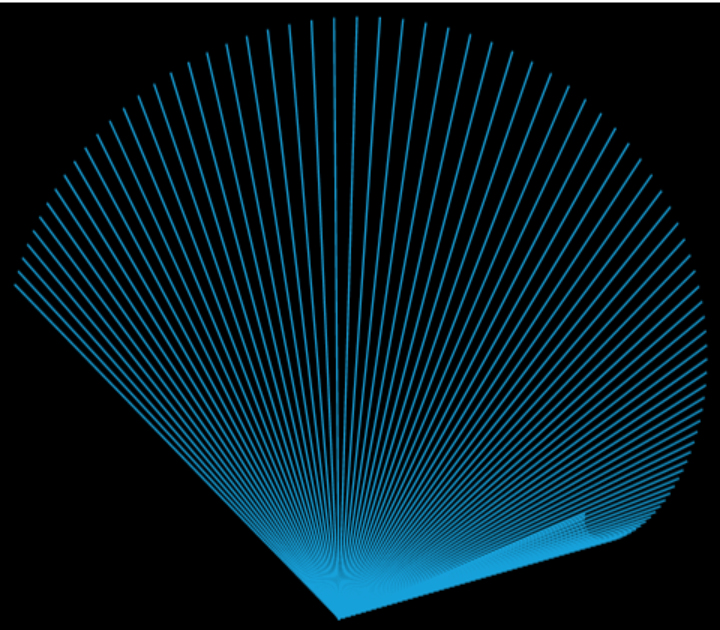 |
Increasing the time span reveals increasingly complex patterns:
| In[4]:= | ![ResourceFunction["SolarSystemMandala"][Entity["Planet", "Earth"], Entity["Planet", "Mercury"], 1 Entity["Planet", "Earth"]["OrbitPeriod"], Quantity[1, "Days"]]](https://www.wolframcloud.com/obj/resourcesystem/images/349/349d6ce2-fab0-4bbb-bc90-cbb0f75bd086/650df50f7f800b8b.png) |
| Out[4]= | 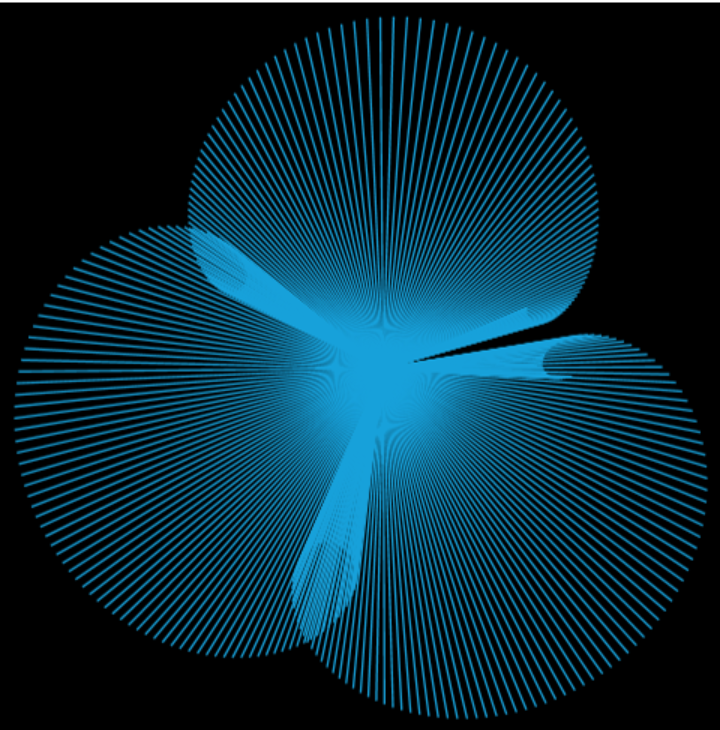 |
Decrease the sampling frequency:
| In[5]:= | ![ResourceFunction["SolarSystemMandala"][Entity["Planet", "Earth"], Entity["Planet", "Mercury"], 1 Entity["Planet", "Earth"]["OrbitPeriod"], Quantity[3, "Days"]]](https://www.wolframcloud.com/obj/resourcesystem/images/349/349d6ce2-fab0-4bbb-bc90-cbb0f75bd086/7ab97857a03dc688.png) |
| Out[5]= | 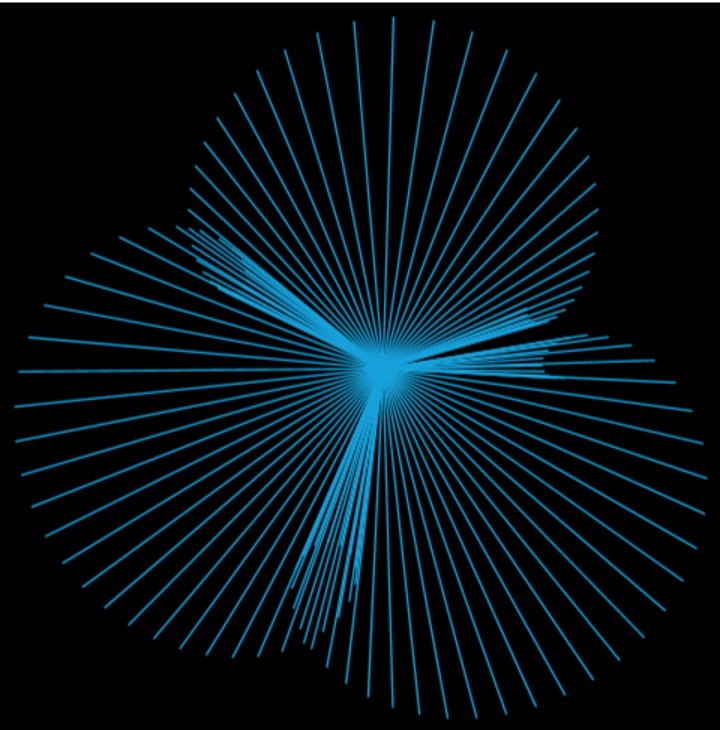 |
Change the default line color:
| In[6]:= | ![ResourceFunction["SolarSystemMandala"][Entity["Planet", "Mars"], Quantity[20, "Years"], Quantity[.2, "Months"], "LineColors" -> Orange]](https://www.wolframcloud.com/obj/resourcesystem/images/349/349d6ce2-fab0-4bbb-bc90-cbb0f75bd086/66902e2cafb185ff.png) |
| Out[6]= |  |
Change the reference frame to observe from the solar system barycenter:
| In[7]:= | ![ResourceFunction["SolarSystemMandala"][Entity["Planet", "Earth"], Entity["Planet", "Venus"], 10 Entity["Planet", "Earth"]["OrbitPeriod"], Quantity[.5, "Months"], \!\(\*
TagBox[
ButtonBox[
StyleBox["AstroReferenceFrame", "SymbolsRefLink",
ShowStringCharacters->True,
FontFamily->"Source Sans Pro",
"NodeID" -> 30],
BaseStyle->{"Link"},
ButtonData->"paclet:ref/AstroReferenceFrame",
ContentPadding->False],
MouseAppearanceTag["LinkHand"]]\) -> {"Ecliptic", "SSB"}]](https://www.wolframcloud.com/obj/resourcesystem/images/349/349d6ce2-fab0-4bbb-bc90-cbb0f75bd086/683cf0c5047e6a33.png) |
| Out[7]= |  |
Change the reference frame along with line opacity and allow each line to vary between two colors:
| In[8]:= | ![ResourceFunction["SolarSystemMandala"][Entity["Planet", "Earth"], Entity["Planet", "Venus"], 75 Entity["Planet", "Earth"]["OrbitPeriod"], Quantity[.03, "Months"],
"LineOpacity" -> .01, "LineColors" -> {LightBlue, LightYellow}, AstroReferenceFrame -> {"Ecliptic", "SSB"}]](https://www.wolframcloud.com/obj/resourcesystem/images/349/349d6ce2-fab0-4bbb-bc90-cbb0f75bd086/3b4956089934e46c.png) |
| Out[8]= | 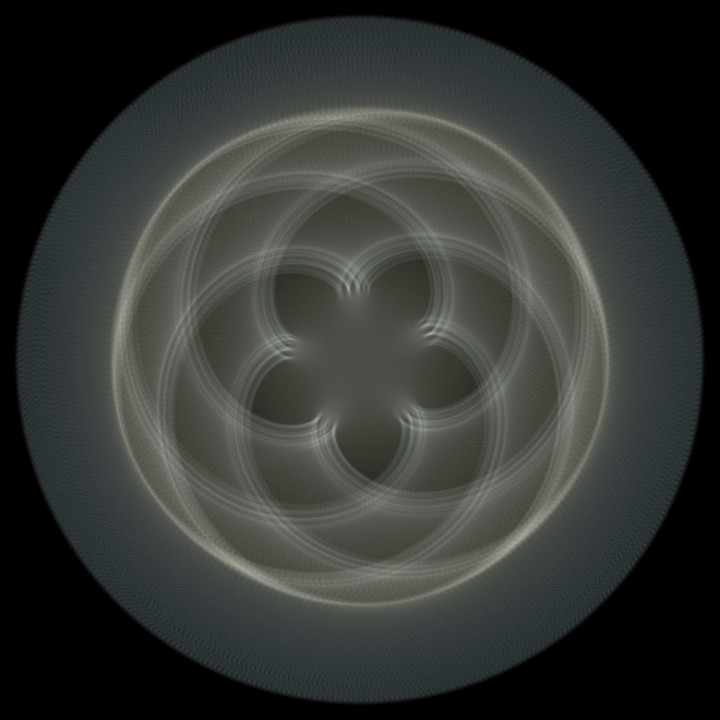 |
Change the plot range:
| In[9]:= | ![ResourceFunction["SolarSystemMandala"][Entity["Planet", "Mars"], Entity["Planet", "Venus"], 5 Entity["Planet", "Mars"]["OrbitPeriod"],
Quantity[.2, "Months"], AstroReferenceFrame -> {"Ecliptic", "SSB"}, "LineOpacity" -> .5, "LineColors" -> {Darker[Red], LightBlue}, PlotRange -> 1]](https://www.wolframcloud.com/obj/resourcesystem/images/349/349d6ce2-fab0-4bbb-bc90-cbb0f75bd086/64da00aeeb9b1651.png) |
| Out[9]= | 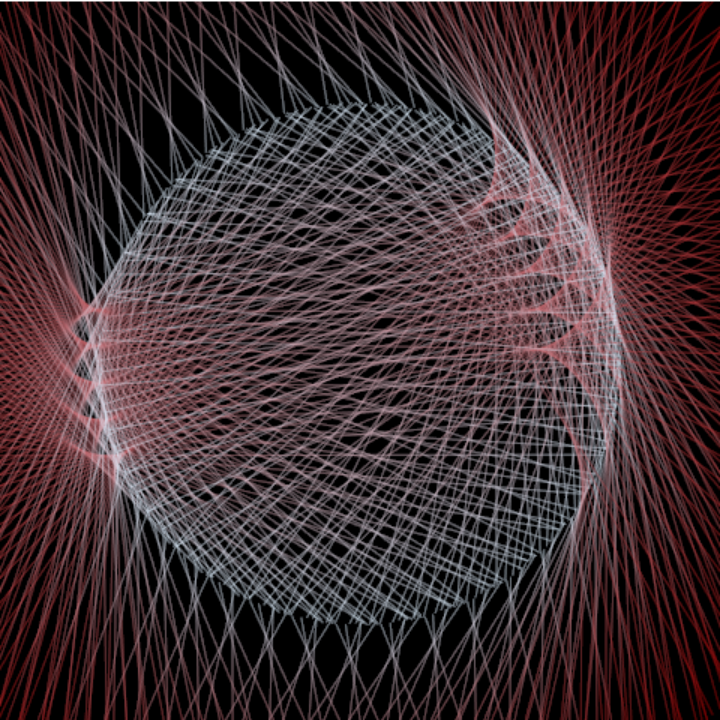 |
Observe how the pattern changes between Jupiter and Mars when using different reference frames:
| In[10]:= | ![GraphicsGrid[{ResourceFunction["SolarSystemMandala"][
Entity["Planet", "Jupiter"], Entity["Planet", "Mars"], Entity["Planet", "Jupiter"]["OrbitPeriod"], Quantity[.05, "Months"], "LineOpacity" -> .1, "LineColors" -> {White, Darker[Red]}, AstroReferenceFrame -> #] & /@ {{"Ecliptic", "SSB"}, "Ecliptic"}}, ImageSize -> 600]](https://www.wolframcloud.com/obj/resourcesystem/images/349/349d6ce2-fab0-4bbb-bc90-cbb0f75bd086/5fe7eadb222fbee5.png) |
| Out[10]= | 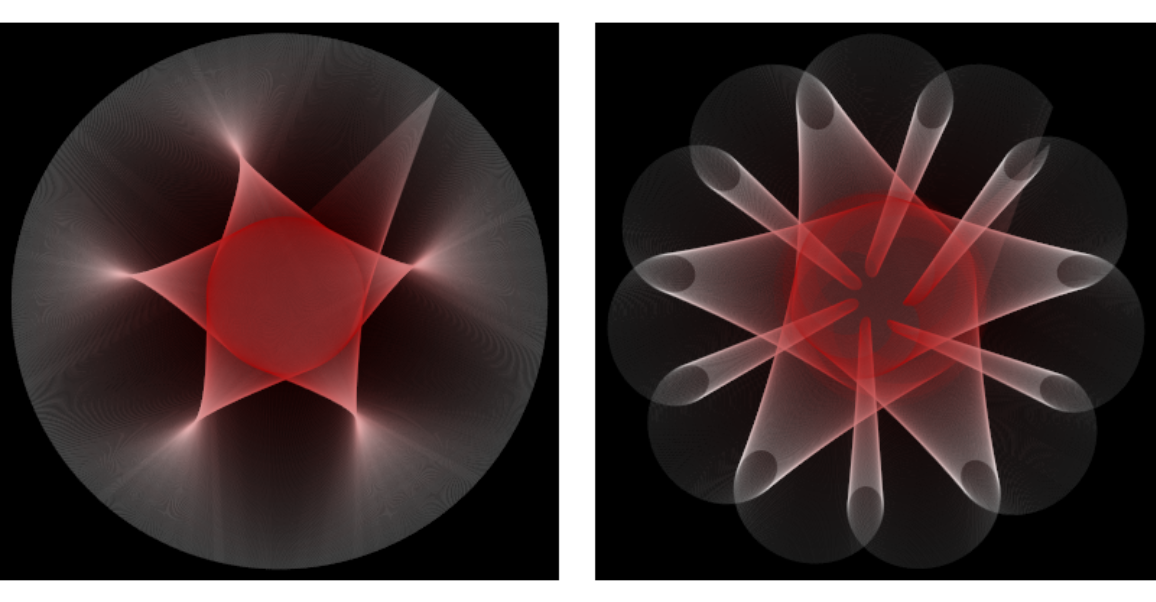 |
Observe how the pattern changes between Jupiter and Uranus when using different reference frames:
| In[11]:= | ![GraphicsGrid[{ResourceFunction["SolarSystemMandala"][
Entity["Planet", "Jupiter"], Entity["Planet", "Uranus"], Entity["Planet", "Uranus"]["OrbitPeriod"], Quantity[.1, "Months"], "LineOpacity" -> .01, "LineColors" -> {LightPink, LightBlue}, AstroReferenceFrame -> #] & /@ {{"Ecliptic", "SSB"}, "Ecliptic"}}, ImageSize -> 600]](https://www.wolframcloud.com/obj/resourcesystem/images/349/349d6ce2-fab0-4bbb-bc90-cbb0f75bd086/00e3bf200025377e.png) |
| Out[11]= | 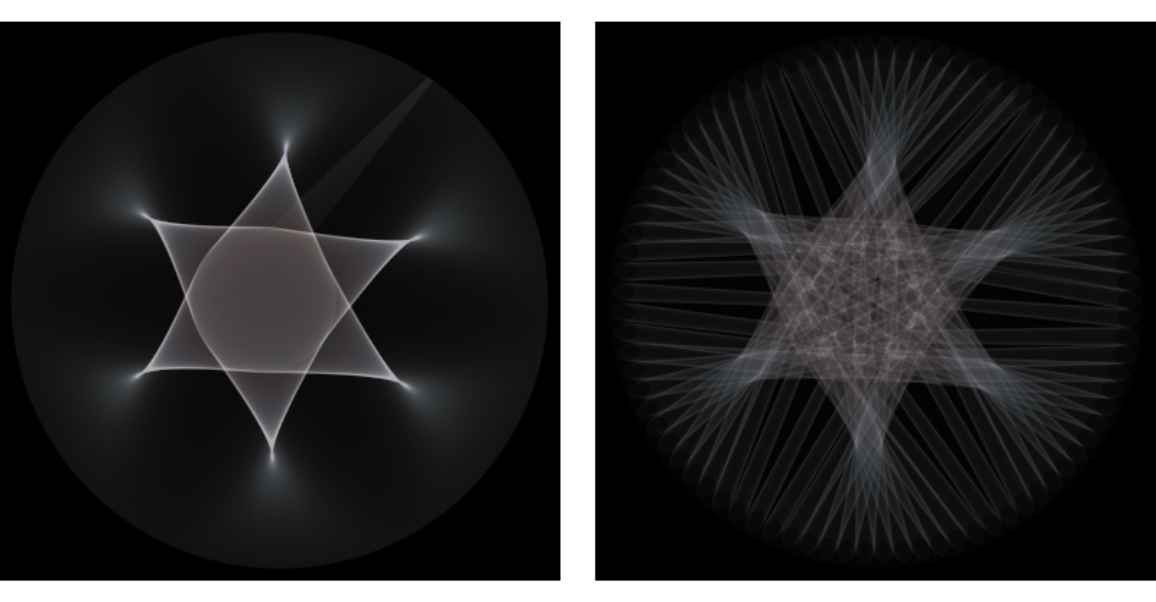 |
Observe how the pattern changes between Jupiter and Neptune when using different reference frames:
| In[12]:= | ![GraphicsGrid[{ResourceFunction["SolarSystemMandala"][
Entity["Planet", "Jupiter"], Entity["Planet", "Neptune"], Entity["Planet", "Neptune"]["OrbitPeriod"], Quantity[.1, "Months"], "LineOpacity" -> .01, "LineColors" -> {LightPink, LightBlue}, AstroReferenceFrame -> #] & /@ {{"Ecliptic", "SSB"}, "Ecliptic"}}, ImageSize -> 600]](https://www.wolframcloud.com/obj/resourcesystem/images/349/349d6ce2-fab0-4bbb-bc90-cbb0f75bd086/75463ad583426577.png) |
| Out[12]= | 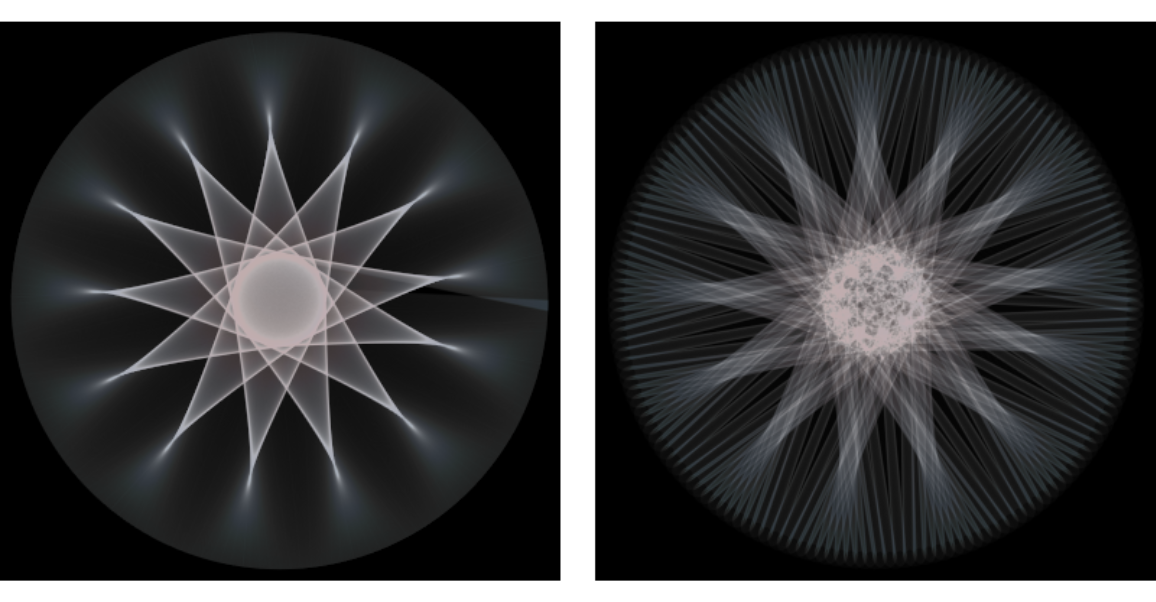 |
Some minor planets are not supported in the far future:
| In[13]:= | ![ResourceFunction["SolarSystemMandala"][Entity["Planet", "Jupiter"], Entity["MinorPlanet", "Juno"], 20 Entity["Planet", "Jupiter"]["OrbitPeriod"], Quantity[.5, "Months"], "LineOpacity" -> .1, "LineColors" -> {Pink, LightBlue}]](https://www.wolframcloud.com/obj/resourcesystem/images/349/349d6ce2-fab0-4bbb-bc90-cbb0f75bd086/73b0bf5cb487e83f.png) |
| Out[13]= | 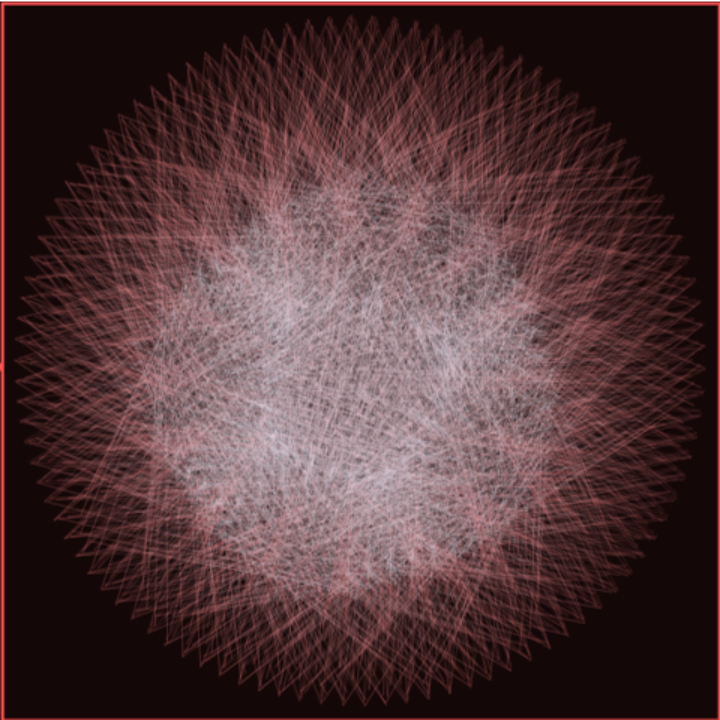 |
Reducing the period avoids this problem:
| In[14]:= | ![ResourceFunction["SolarSystemMandala"][Entity["Planet", "Jupiter"], Entity["MinorPlanet", "Juno"], 12 Entity["Planet", "Jupiter"]["OrbitPeriod"], Quantity[.5, "Months"], "LineOpacity" -> .1, "LineColors" -> {Pink, LightBlue}]](https://www.wolframcloud.com/obj/resourcesystem/images/349/349d6ce2-fab0-4bbb-bc90-cbb0f75bd086/372bd32ca161025f.png) |
| Out[14]= | 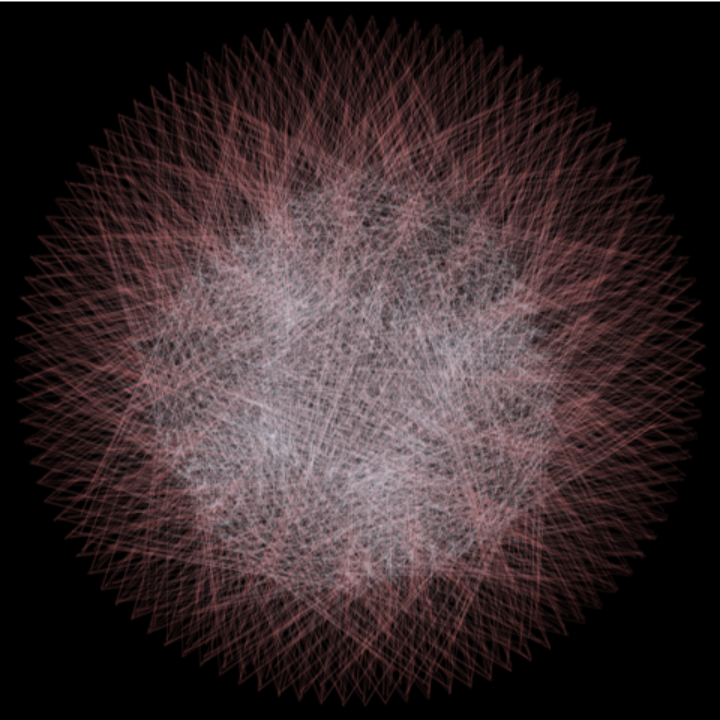 |
Neptune and Pluto are in orbital resonance with each other which creates a unique pattern:
| In[15]:= | ![ResourceFunction["SolarSystemMandala"][Entity["MinorPlanet", "Pluto"],
Entity["Planet", "Neptune"], 20 Entity["MinorPlanet", "Pluto"]["OrbitPeriod"], Quantity[6, "Months"], "LineOpacity" -> .02, "LineColors" -> {Pink, LightBlue}, AstroReferenceFrame -> "ICRS"]](https://www.wolframcloud.com/obj/resourcesystem/images/349/349d6ce2-fab0-4bbb-bc90-cbb0f75bd086/2caee77d19b57ee9.png) |
| Out[15]= | 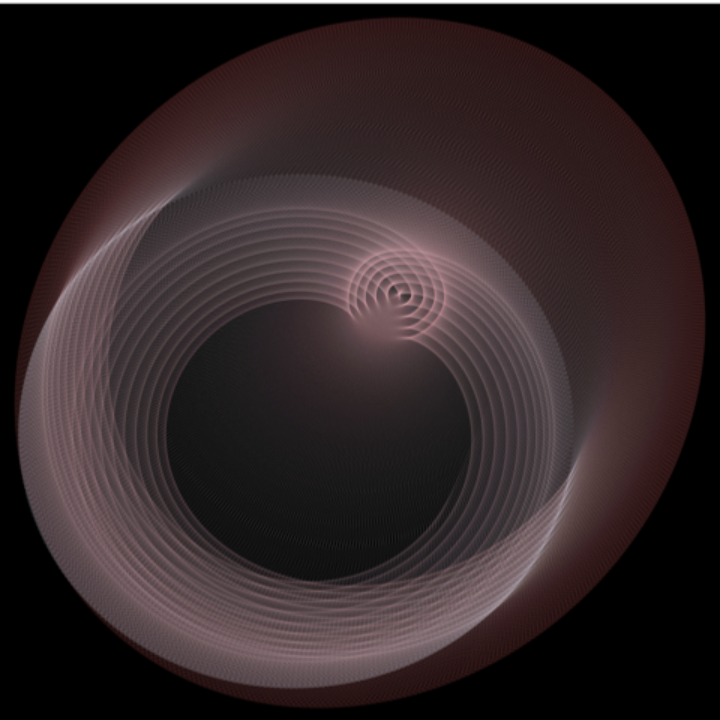 |
Wolfram Language 13.2 (December 2022) or above
This work is licensed under a Creative Commons Attribution 4.0 International License