Wolfram Function Repository
Instant-use add-on functions for the Wolfram Language
Function Repository Resource:
Plot the relative positions of the Moon and Earth in 3D, illuminated by the Sun
ResourceFunction["MoonPositionPlot3D"][] plot the current relative positions of the Moon and Earth in 3D. | |
ResourceFunction["MoonPositionPlot3D"][date] plot the relative positions of the Moon and Earth in 3D on the specified date. |
| Background | Black | background color for the plot |
| BoxStyle | Opacity[0] | style specifications for the box |
| PlotRange | 10 | range of values to include in Earth radii |
| SphericalRegion | True | whether to make the circumscribing sphere fit in the final display area |
| ViewAngle | Pi/10 | angle of the field of view |
| ViewPoint | Above | viewing position |
| "LunarDistance" | 5 | lunar distance in Earth radii |
| "LunarRadius" | .5 | lunar radius in Earth radii |
| "ShowEarthShadow" | False | show Earth shadow |
| "ShowSubLunarPoint" | False | show sublunar point |
| "ShowSubSolarPoint" | False | show subsolar point |
| "ShowSunArrows" | True | show Sun arrows |
| "SubLunarPointStyle" | Directive[White,PointSize[.02]] | sublunar point style |
| "SubSolarPointStyle" | Directive[Opacity[.5,Yellow,PointSize[.02]] | subsolar point style |
| "SunArrowStyle" | Directive[Opacity[.5,Yellow] | Sun arrow style |
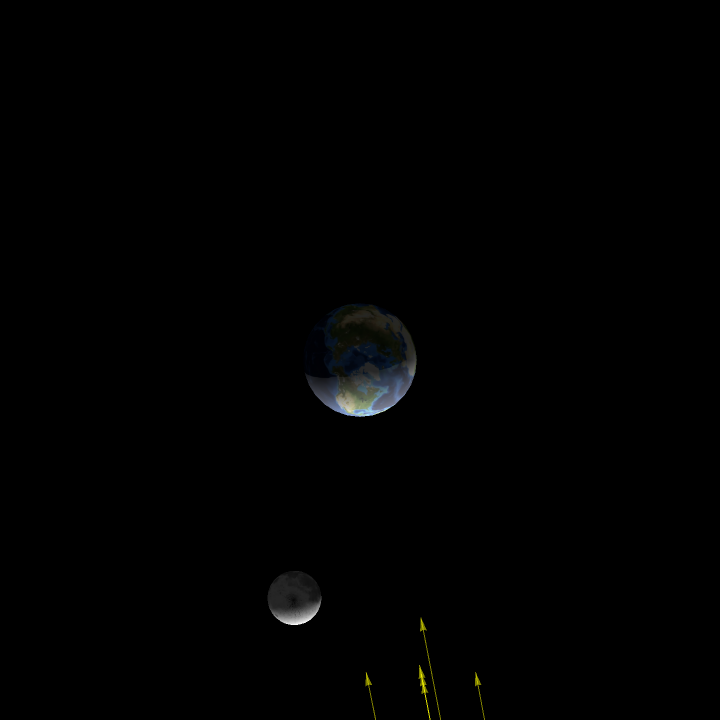
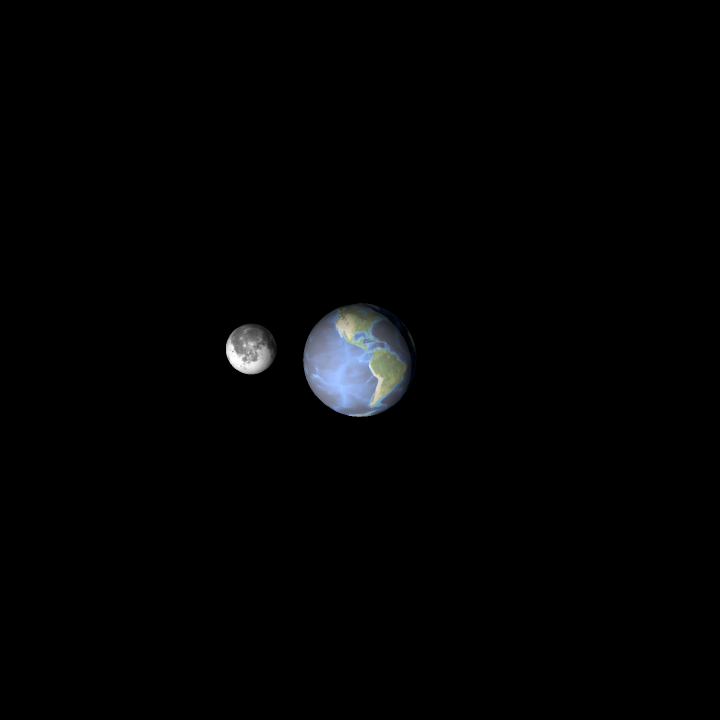
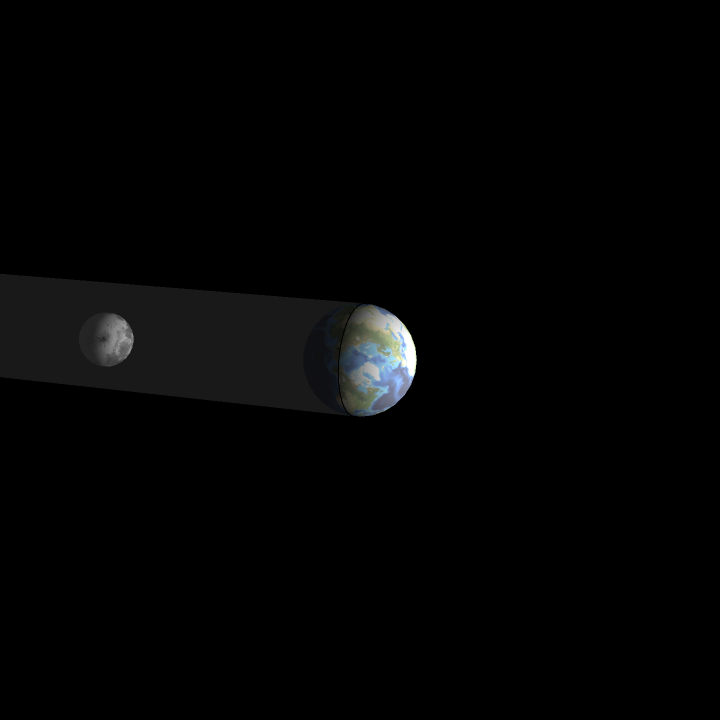
Plot the current relative positions of the Moon and Earth:
| In[1]:= |
|
| Out[1]= |
|
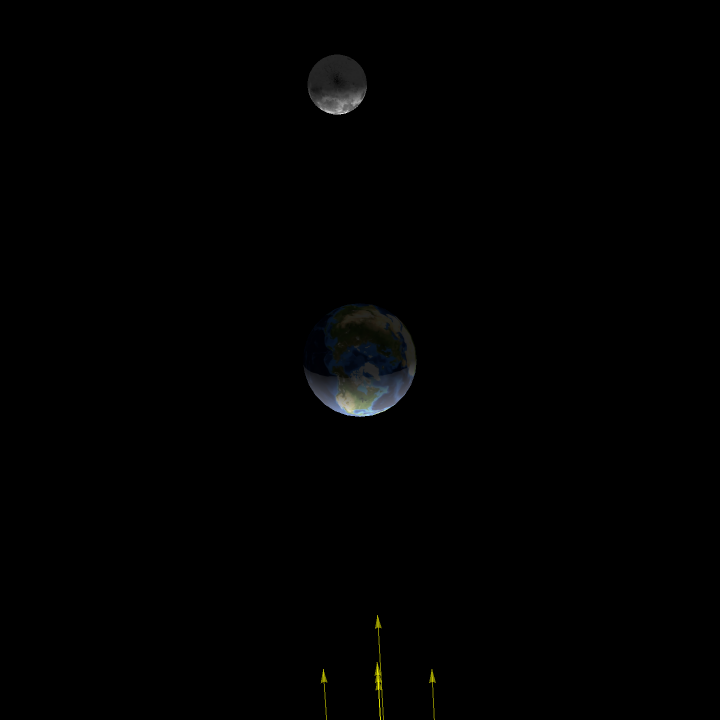
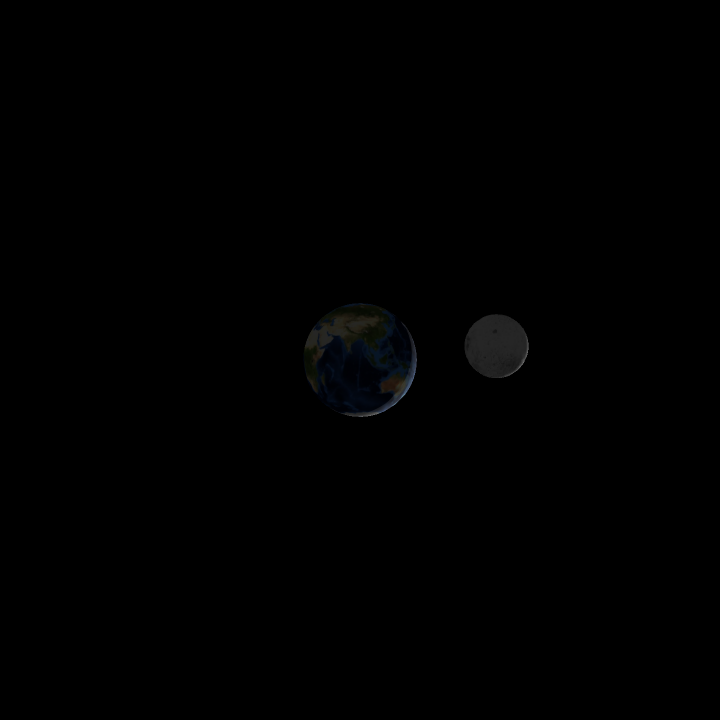
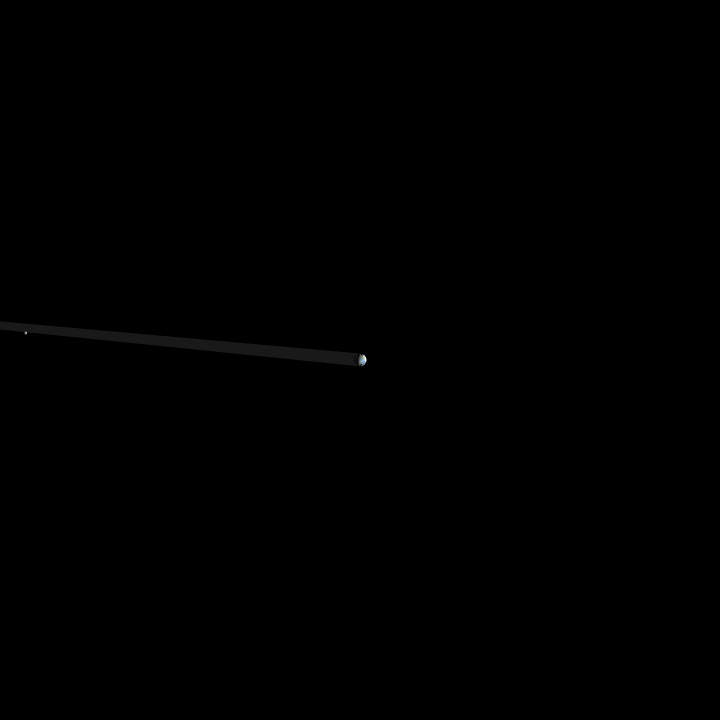
Plot the relative position of the Moon and Earth on a specified date:
| In[2]:= |
|
| Out[2]= |
|
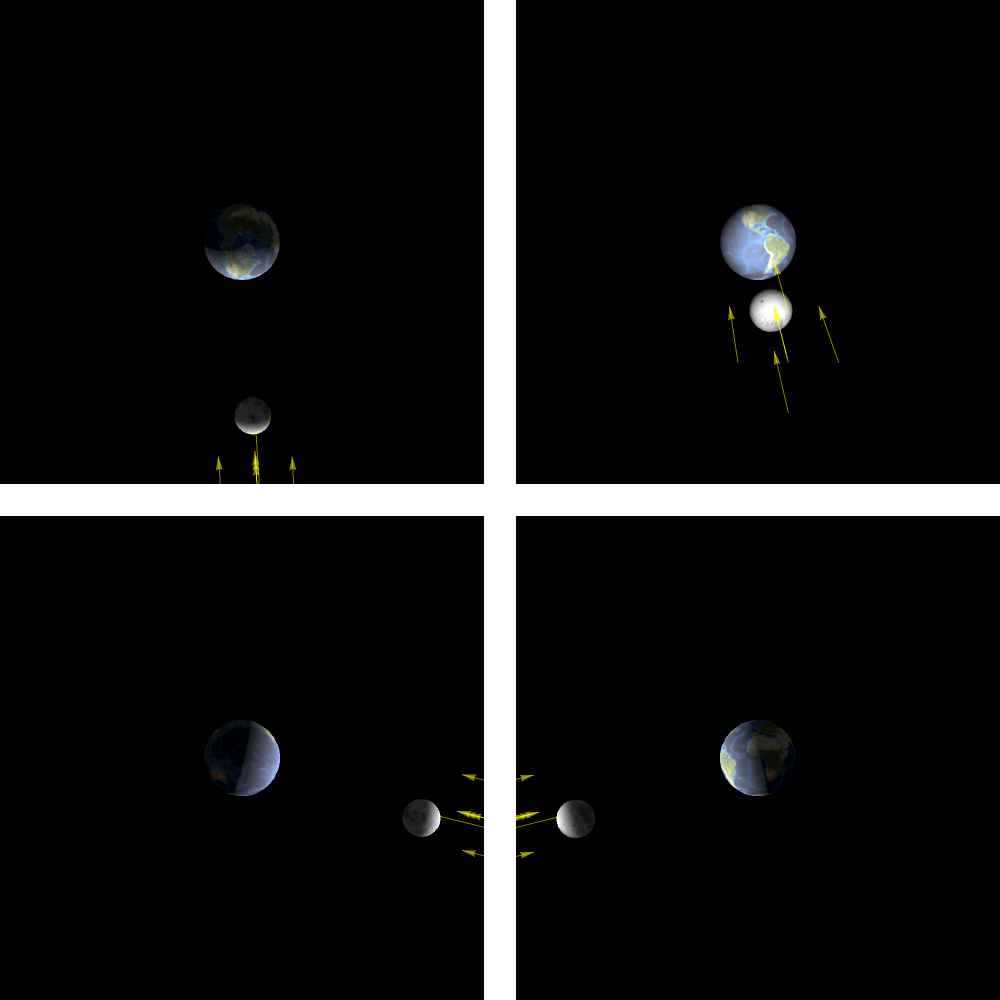
View the relative positions of the Moon and Earth as seen from different viewpoints:
| In[3]:= |
|
| In[4]:= |
![GraphicsGrid[{{newmoon, Show[newmoon, ViewPoint -> Front]}, {Show[newmoon, ViewPoint -> Left], Show[newmoon, ViewPoint -> Right]}}, ImageSize -> 500]](https://www.wolframcloud.com/obj/resourcesystem/images/aa2/aa2ce429-8bfa-428d-aefa-23574cc2f322/248ea988c1543da1.png)
|
| Out[4]= |
|
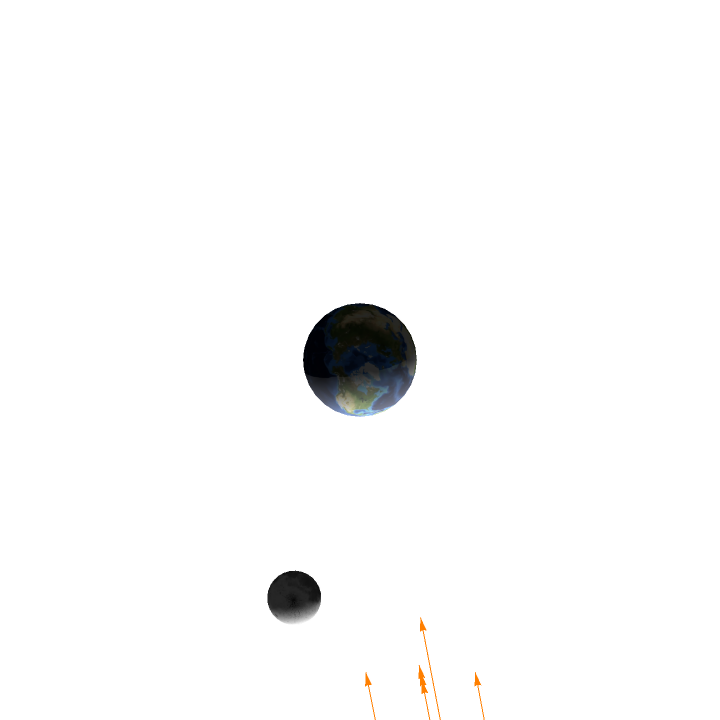
Change the background and arrow colors:
| In[5]:= |
|
| Out[5]= |
|
View a full moon from the front:
| In[6]:= |
|
| Out[6]= |
|
View a full moon from the back:
| In[7]:= |
|
| Out[7]= |
|
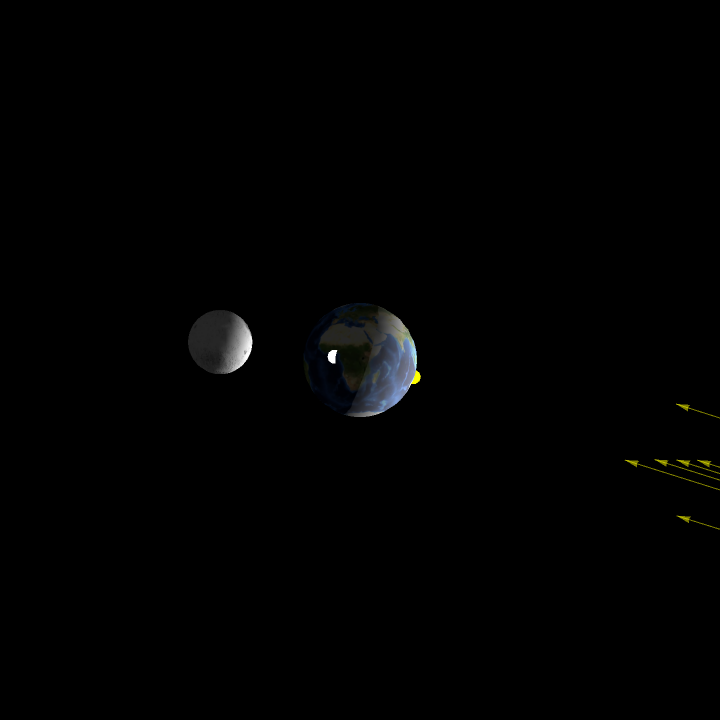
Show the subsolar and sublunar points on the Earth:
| In[8]:= |
|
| Out[8]= |
|
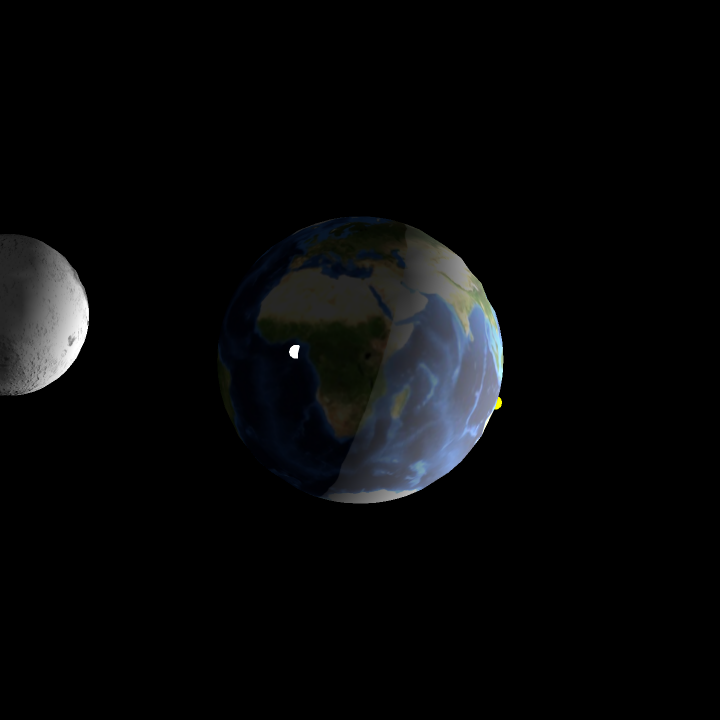
Zoom in to see the subsolar and sublunar points in more detail:
| In[9]:= |
![ResourceFunction["MoonPositionPlot3D"][
DateObject[{2021, 2, 1, 21, 35}, TimeZone -> -6], "ShowSubSolarPoint" -> True, "ShowSubLunarPoint" -> True, ViewPoint -> {1.72, 1.0, -0.1}, ViewAngle -> Pi/25]](https://www.wolframcloud.com/obj/resourcesystem/images/aa2/aa2ce429-8bfa-428d-aefa-23574cc2f322/57755c461a1bb51c.png)
|
| Out[9]= |
|
Show the shadow of the Earth during a lunar eclipse:
| In[10]:= |
|
| Out[10]= |
|
Adjust scaling factors for a more realistic representation:
| In[11]:= |
![ResourceFunction["MoonPositionPlot3D"][
DateObject[{2021, 5, 26, 6, 19}], "LunarRadius" -> .2727, "LunarDistance" -> 60.34, "ShowEarthShadow" -> True, ViewAngle -> Pi/7, PlotRange -> 61, "ShowSunArrows" -> False]](https://www.wolframcloud.com/obj/resourcesystem/images/aa2/aa2ce429-8bfa-428d-aefa-23574cc2f322/2bf78a57f91e5840.png)
|
| Out[11]= |
|
Use MoonPhase to associate the view from Earth with the 3D orientation:
| In[12]:= |
![GraphicsGrid[{With[{date = #},
ResourceFunction["MoonPositionPlot3D"][date, PlotLabel -> Show[MoonPhase[date, "Icon"], ImageSize -> 25]]] & /@ {DateObject[{2021, 1, 12, 23}, TimeZone -> -6], DateObject[{2021, 1, 20, 23}, TimeZone -> -6], DateObject[{2021, 1, 28, 23}, TimeZone -> -6], DateObject[{2021, 2, 4, 23}, TimeZone -> -6]}}, ImageSize -> 600]](https://www.wolframcloud.com/obj/resourcesystem/images/aa2/aa2ce429-8bfa-428d-aefa-23574cc2f322/32ed3e24b2ac2420.png)
|
| Out[12]= |
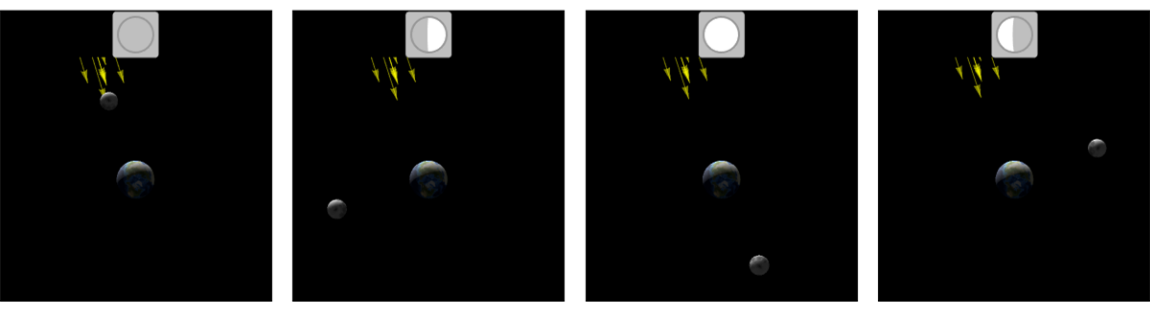
|
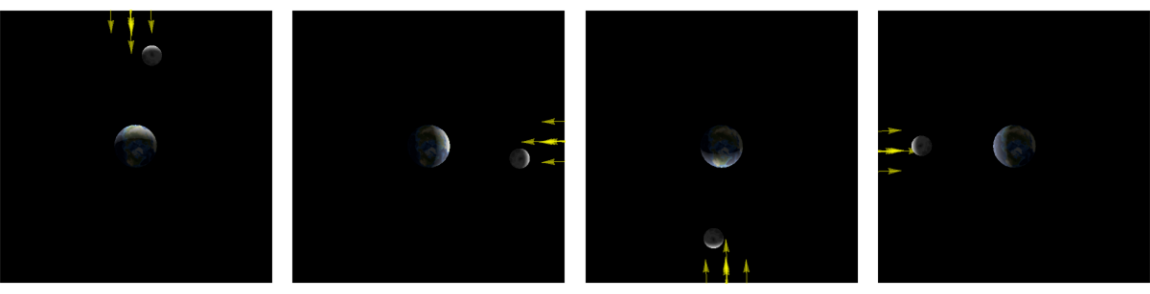
Time of day affects the orientation of the scene as the Earth rotates:
| In[13]:= |
![GraphicsGrid[{ResourceFunction["MoonPositionPlot3D"][
DateObject[{2021, 1, 12, #}, TimeZone -> -6]] & /@ {0, 6, 12, 18}}, ImageSize -> 600]](https://www.wolframcloud.com/obj/resourcesystem/images/aa2/aa2ce429-8bfa-428d-aefa-23574cc2f322/14187951420c9190.png)
|
| Out[13]= |
|
This work is licensed under a Creative Commons Attribution 4.0 International License