Get a number line diagram with information about where a function is positive, negative, zero or discontinuous
Contributed by:
Wolfram|Alpha Math Team
Examples
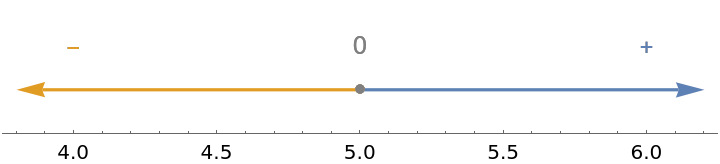
Basic Examples (1)
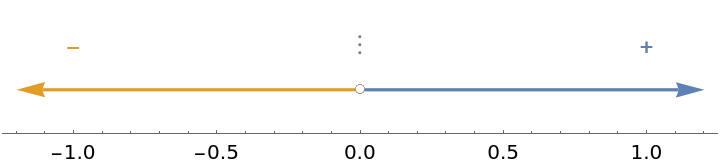
Get a sign chart for 2x-10, which is negative for x<5, zero at x=5 and positive for x>5:
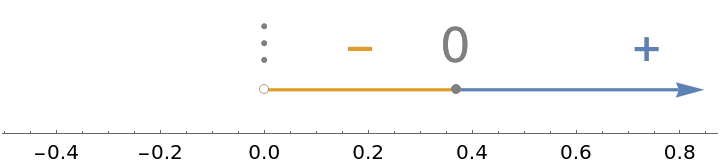
Scope (1)
Discontinuities are indicated on the sign chart with vertical dots:
Options (4)
FontSize (1)
Use the option FontSize to adjust the size of labels:
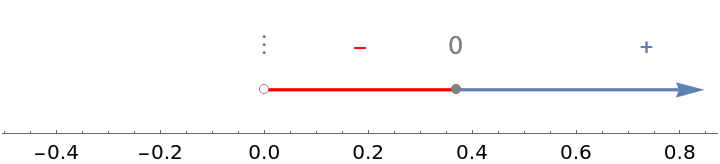
MinusColor (1)
Use the option "MinusColor" to adjust the color of the negative intervals and minus signs:
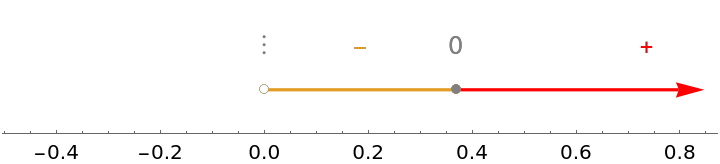
PlusColor (1)
Use the option "PlusColor" to adjust the color of the positive intervals and plus signs:
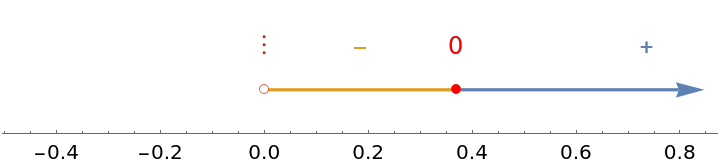
ZeroColor (1)
Use the option "ZeroColor" to adjust the color of the zero or discontinuous intervals and zeros:
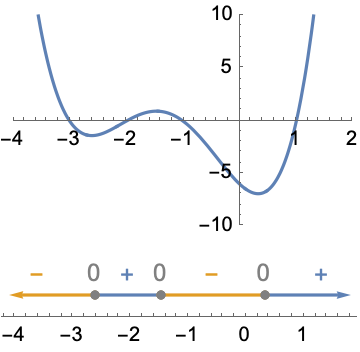
Applications (1)
Sign charts are a useful reasoning tool in many contexts, especially calculus functional analysis. For example, compare the plot of a function to the sign chart of the function's derivative to visualize the first derivative test:
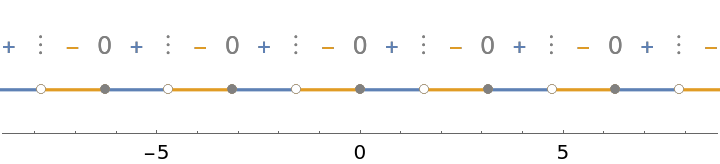
Possible Issues (1)
If there are infinitely many places where a function changes signs, the sign chart displays information for an interval surrounding x=0:
Publisher
Wolfram|Alpha Math Team
Version History
-
2.0.0
– 23 March 2023
-
1.0.0
– 11 October 2022
Related Resources
Author Notes
To view the full source code for SignChart, evaluate the following:
![With[{poly = (x + 3) (x - 1) (x + 1) (x + 2)}, Column[{
Plot[poly, {x, -4, 2}, PlotRange -> {{-4, 2}, {-10, 10}}],
ResourceFunction["SignChart"][D[poly, x], x]
}]]](https://www.wolframcloud.com/obj/resourcesystem/images/1d0/1d0952c3-edc9-4e60-bc91-4e740837c666/1-0-0/7002d247e004064a.png)