Details
A rose curve is a class of curves defined by the equation
in polar coordinates. When
n is a rational number, the periodicity of the sine function means that the rose curve forms a closed loop after at most one period of the function. This is what is referred to as a rose curve.
In some cases, the polar equation of the rose curve is given as
. Although
ResourceFunction["RoseCurveAnalysis"] does not have the option to switch between forms, the cosine form is equivalent to rotating the sine form by 90 degrees counterclockwise.
The amplitude a can be any real value whereas the angle coefficient n must be a nonzero rational.
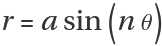
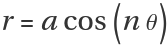
For the purposes of this function, a "petal" of a rose curve is defined as a minimal (possibly self-intersecting) segment of the curve that starts and ends at the origin and does not pass through the origin otherwise. A "subpetal" is a closed region within the rose curve.
"TotalArea" refers to an area calculated by integration, which counts overlapped sections multiple times. By contrast, "SurfaceArea" counts each selected area once.
The following values of prop are supported for both integer and rational values of n:
| "Equation" | equation of the rose curve |
| "Plot" | plot of the rose curve |
| "PetalPlot" | plot of a single petal |
| "PetalCount" | number of petals |
| "PetalTotalAreaFormula" | formula for the total area of a single petal |
| "PetalTotalArea" | total area of a single petal |
| "InactiveTotalAreaIntegral" | inactive double integral for the total area of the rose curve |
| "InactiveTotalAreaSingleIntegral" | inactive single integral for the total area of the rose curve |
| "TotalAreaFormula" | formula for the total area of a rose curve (for rational n, rewrite n as the reduced fration p/q) |
| "TotalArea" | total area of the rose curve |
| "TotalAreaPlot" | plot of the rose curve where darker hues correspond to overlapped sections |
| "PetalArcLength" | arc length of a single petal |
| "ArcLength" | arc length of the rose curve over one full period |
| "IntersectionCount" | number of times the rose curve self-intersects |
| "ClosedDomain" | the interval of angles where the rose curve makes a complete cycle |
| "HorizontalSymmetry" | yields True if the the curve is symmetric across the horizontal axis |
| "VerticalSymmetry" | yields True if the the curve is symmetric across the vertical axis |
| "RotationalSymmetry" | yields True if the the curve is symmetric when rotated 180° about the origin |
| "MaximumOuterCurveRadius" | largest radius value along the outer curve |
| "MinimumOuterCurveRadius" | smallest radius value along the outer curve |
| "OriginIntersectionCount" | number of times the curve passes through the origin along its closed domain |
| "SymmetryGroup" | the dihedral symmetry group associated with the curve |
| All | all properties associated with the given value of n |
The following values of prop are intended for rational values of n, but can be called for integer values of n as well:
| "PetalSurfaceAreaFormula" | formula for the surface area of a single petal |
| "PetalSurfaceArea" | surface area of a single petal |
| "InactiveSurfaceAreaIntegral" | inactive double integral for the surface area of the rose curve |
| "InactiveSurfaceAreaSingleIntegral" | inactive single integral for the surface area of the rose curve |
| "SurfaceAreaFormula" | formula for the surface area the rose curve (n is expressed as the reduced fraction p/q) |
| "SurfaceArea" | surface area of the rose curve |
| "OuterCurveEquation" | piecewise function for the outline of the rose curve |
| "OuterCurvePlot" | plot of the outline of the rose curve |
Multiple values of prop can be specified using a list. The order of the input properties is mirrored in the output.
| "Point" | determines the initial shaded region (default value is {0.1,0.1}) |
| "ShowPetal" | bolds the petal containing the shaded region |
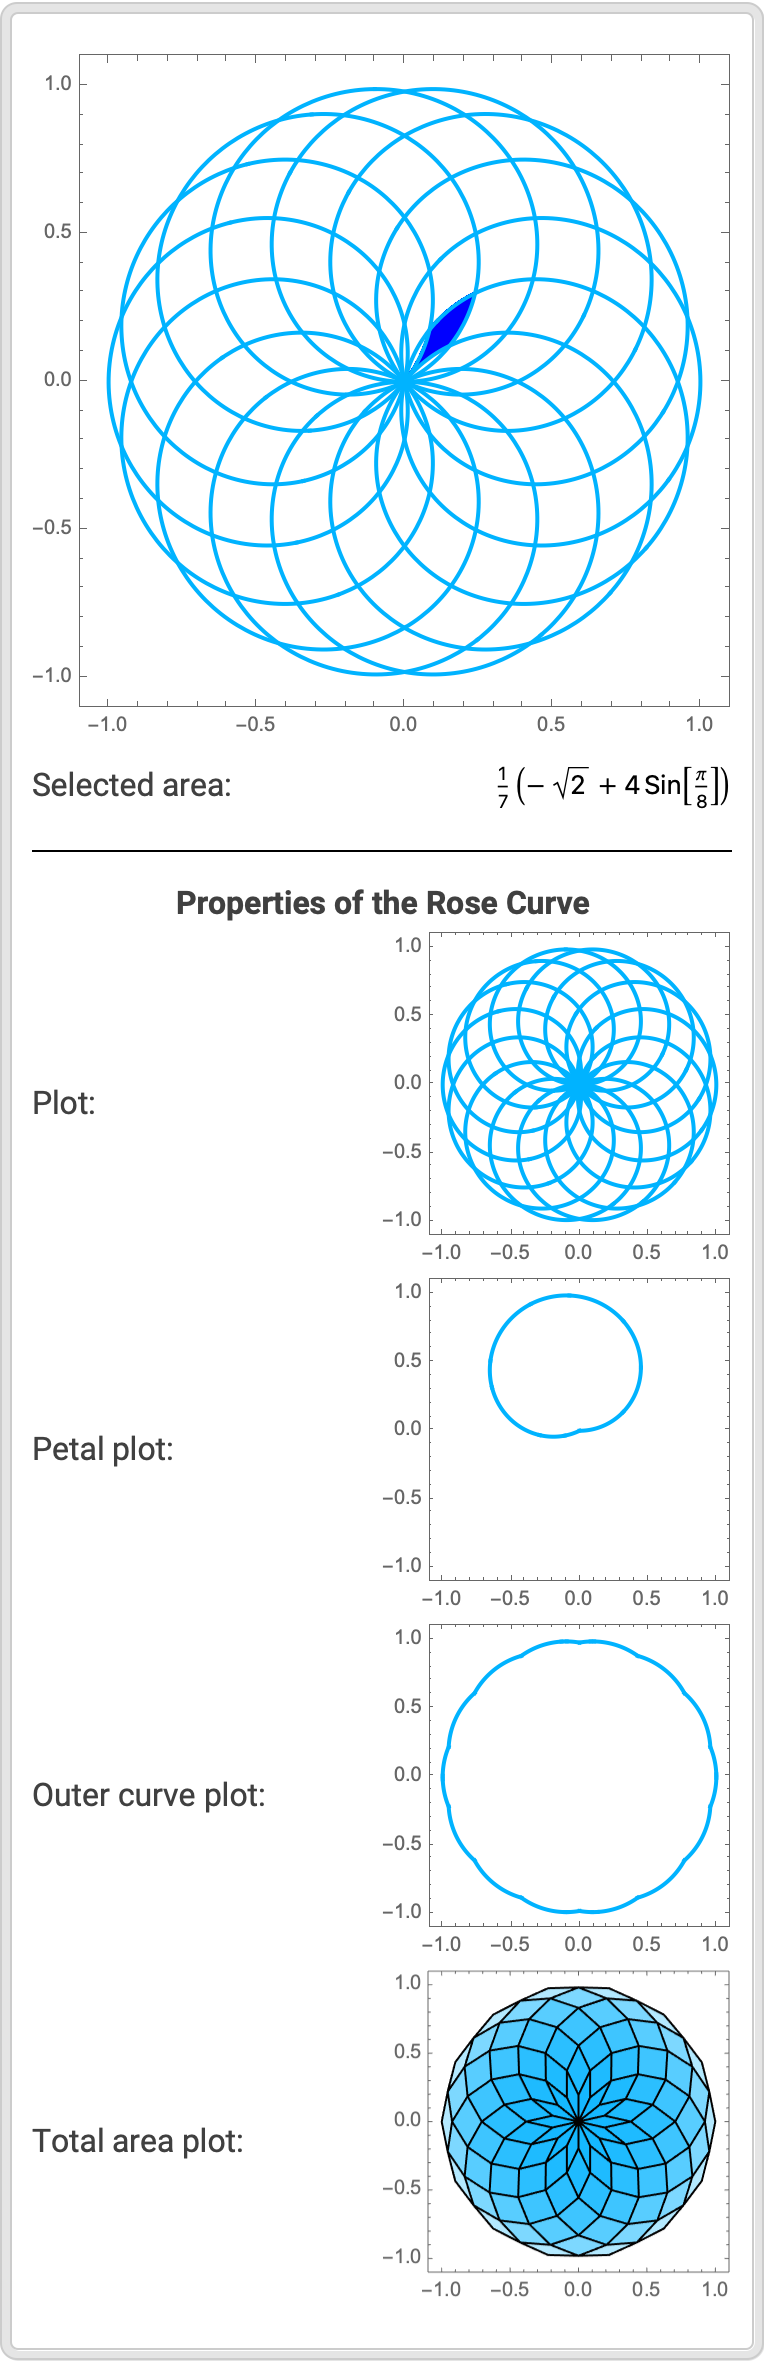
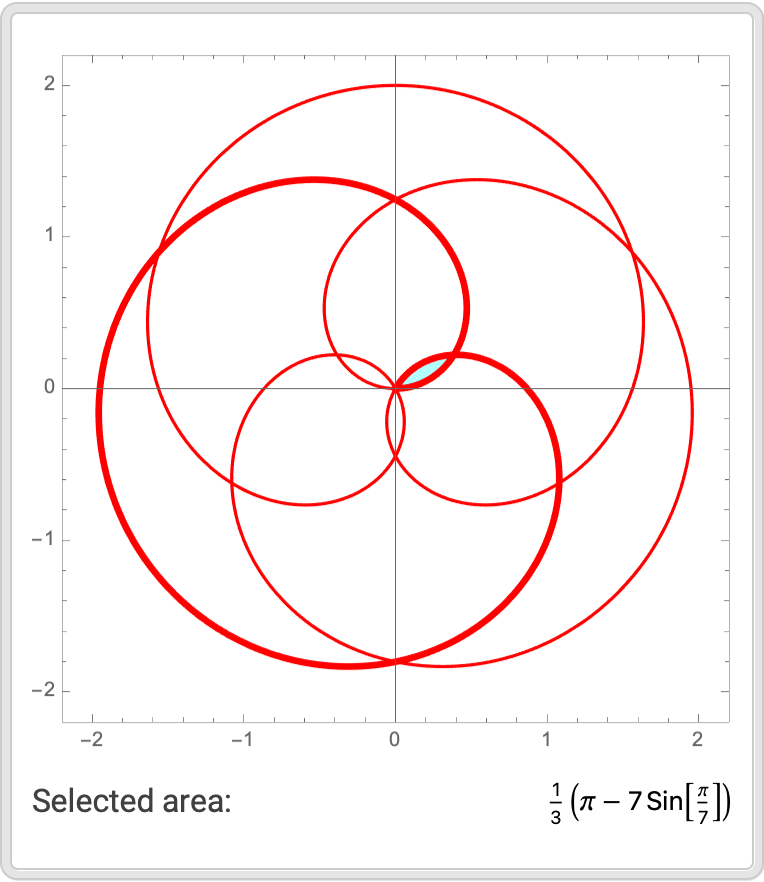
![ResourceFunction["RoseCurveAnalysis"][1, 7/8, {"Plot", "PetalPlot", "OuterCurvePlot", "TotalAreaPlot"}, Axes -> False, PlotStyle -> {Thick, Hue[.55]}, MeshStyle -> {Blue, Opacity[1]}, BoundaryStyle -> Black]](https://www.wolframcloud.com/obj/resourcesystem/images/f97/f9705df1-5295-4b2e-ab71-941469d4627f/0801554b025bc89c.png)
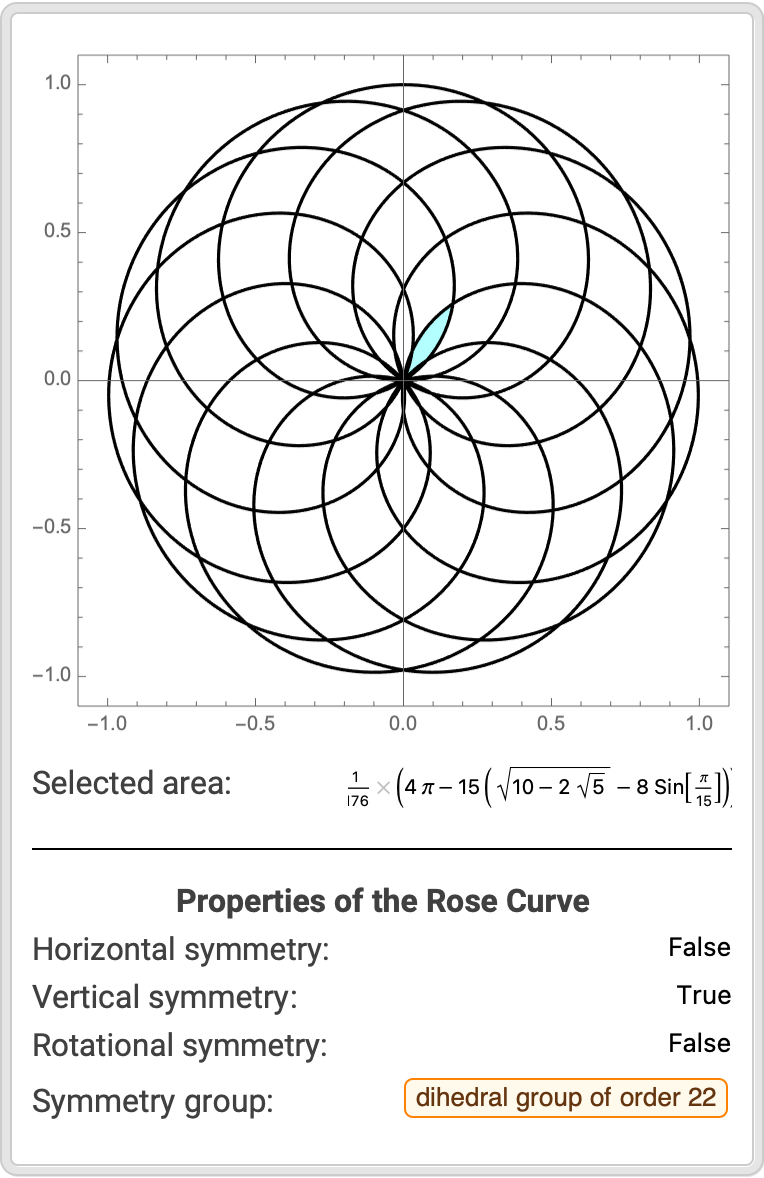
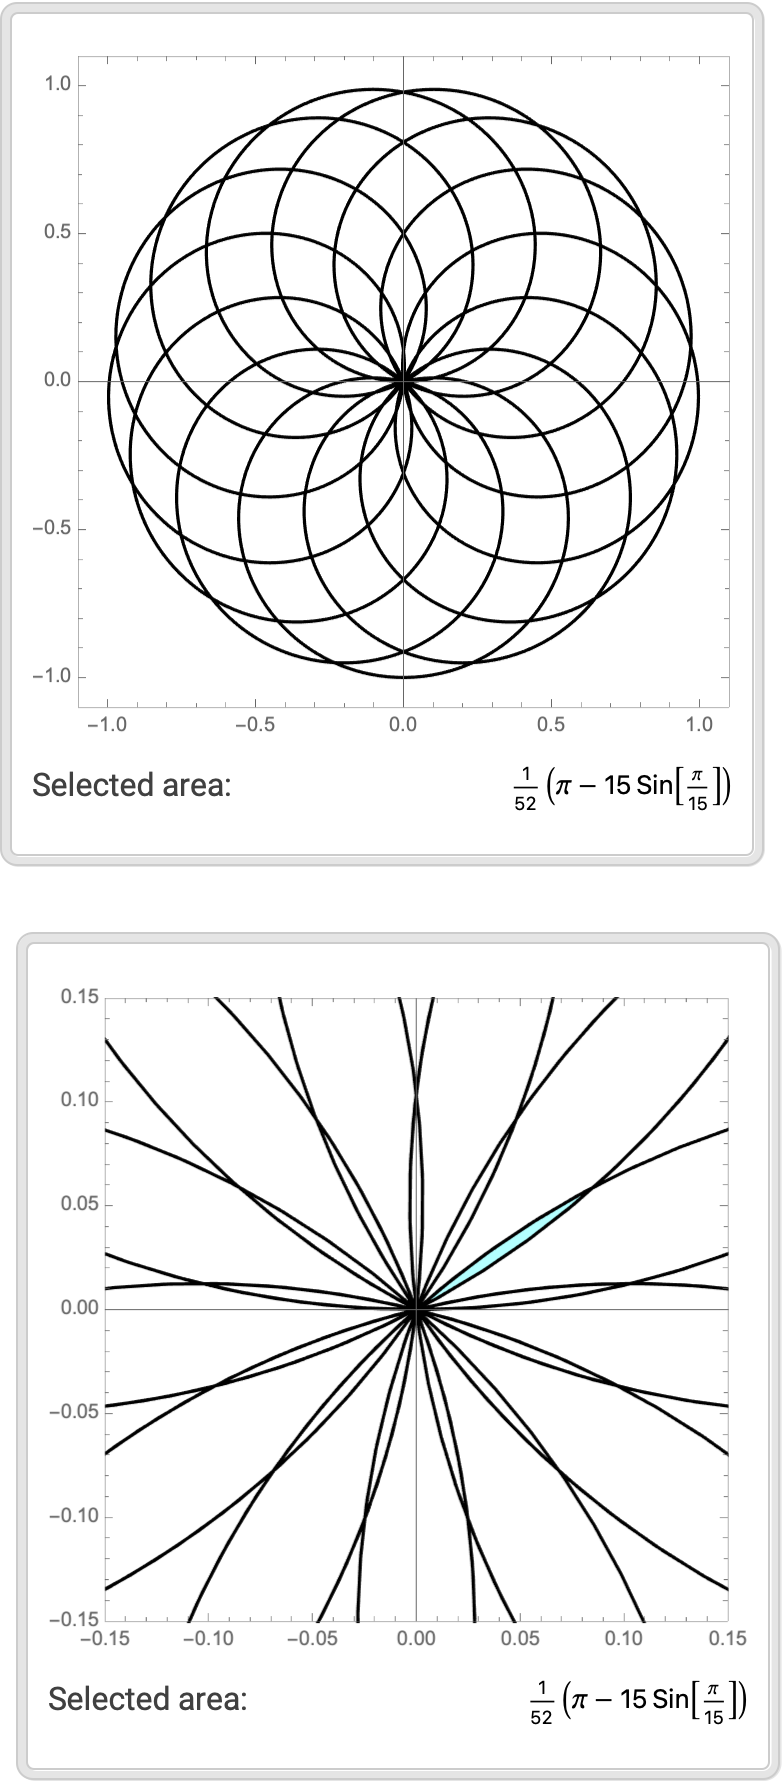
![{ResourceFunction["RoseCurveAnalysis"][1, 13/15, "Point" -> {0.05, 0.035}], ResourceFunction["RoseCurveAnalysis"][1, 13/15, PlotRange -> 0.15, "Point" -> {0.05, 0.035}]}](https://www.wolframcloud.com/obj/resourcesystem/images/f97/f9705df1-5295-4b2e-ab71-941469d4627f/07168d5a0aa5cd0d.png)
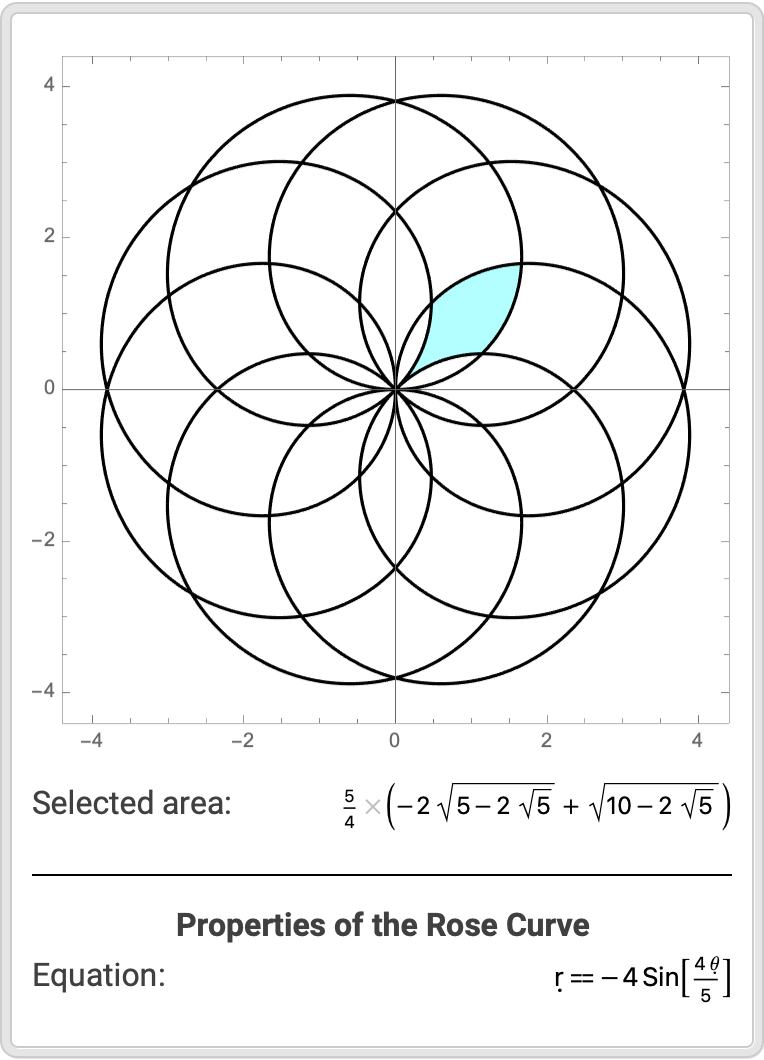
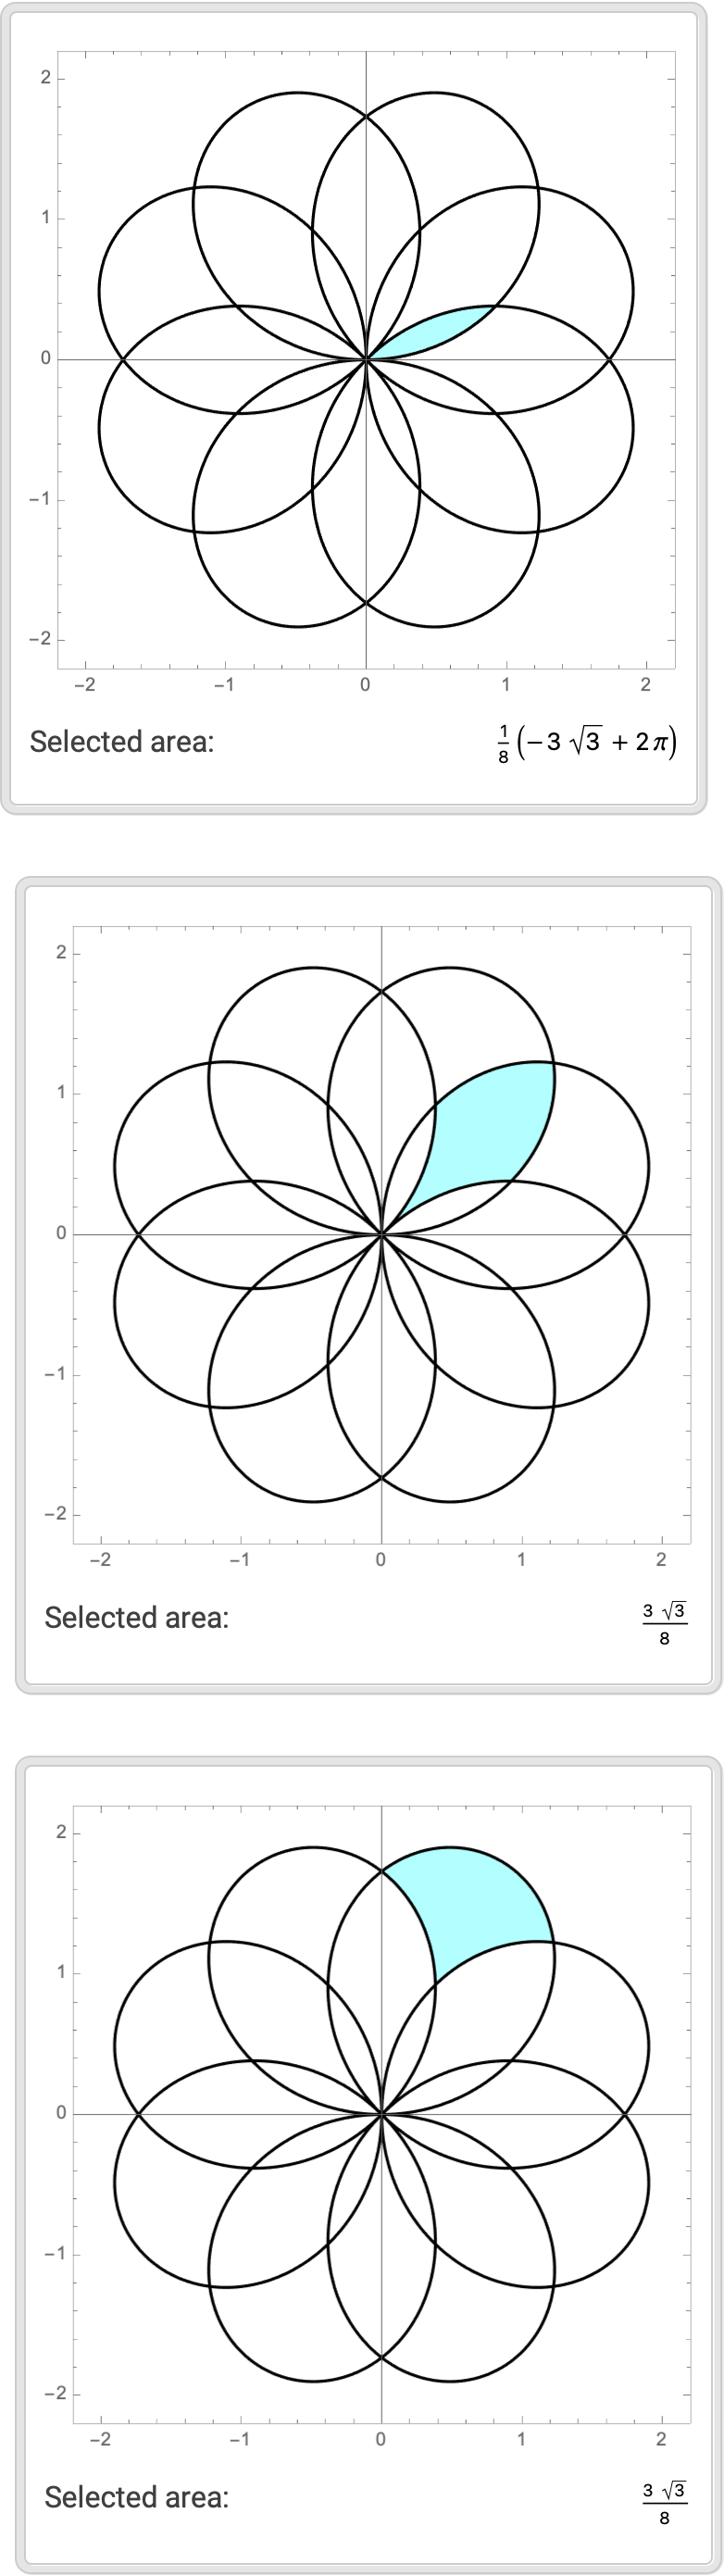
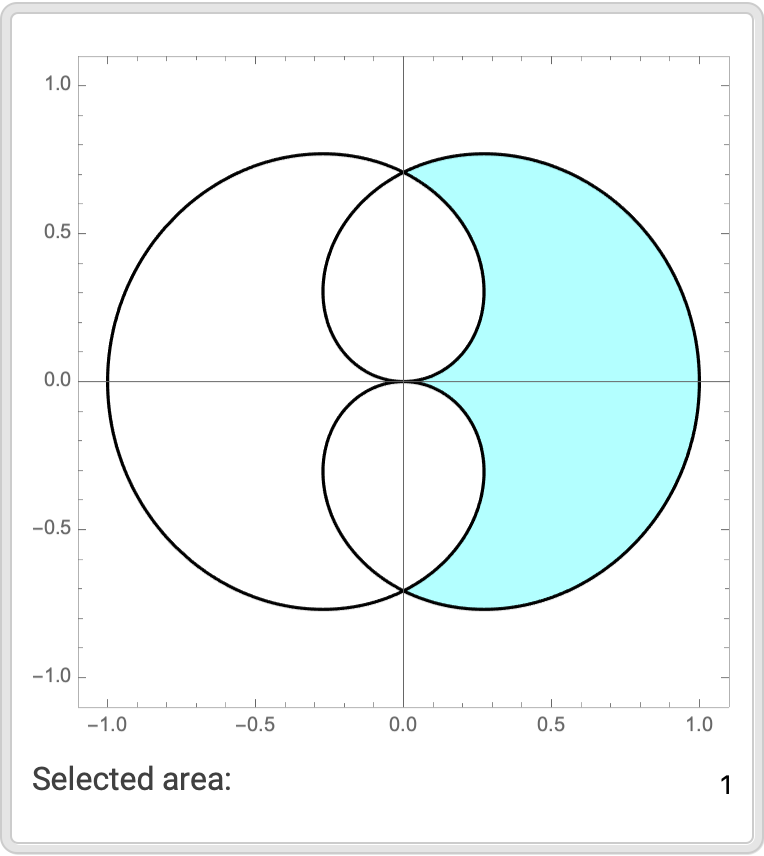
![{ResourceFunction["RoseCurveAnalysis"][2, 4/3, "Point" -> {0.5, 0.1}],
ResourceFunction["RoseCurveAnalysis"][2, 4/3], ResourceFunction["RoseCurveAnalysis"][2, 4/3, "Point" -> {1, 1.5}]}](https://www.wolframcloud.com/obj/resourcesystem/images/f97/f9705df1-5295-4b2e-ab71-941469d4627f/5cfcff81893f9f92.png)
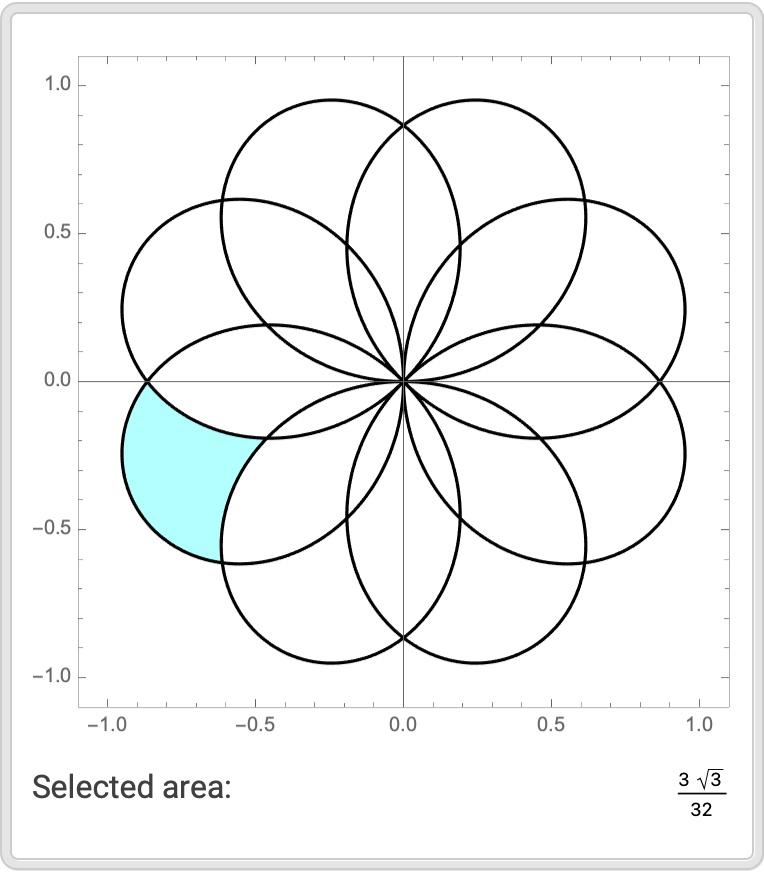
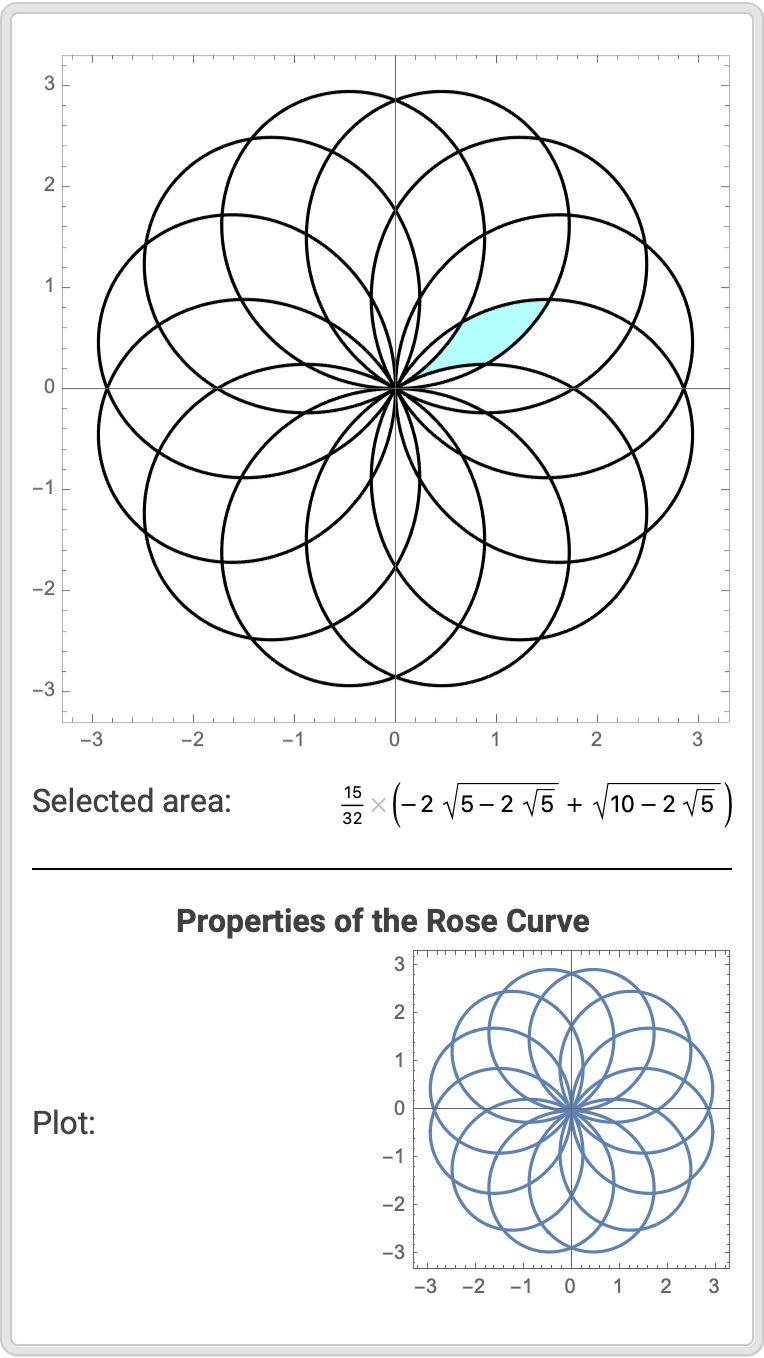
![Simplify[8*(1/8*(-3 Sqrt[3] + 2 \[Pi]) + (3 Sqrt[3])/8 + (3 Sqrt[3])/
8)]](https://www.wolframcloud.com/obj/resourcesystem/images/f97/f9705df1-5295-4b2e-ab71-941469d4627f/74666d0a315f3aeb.png)
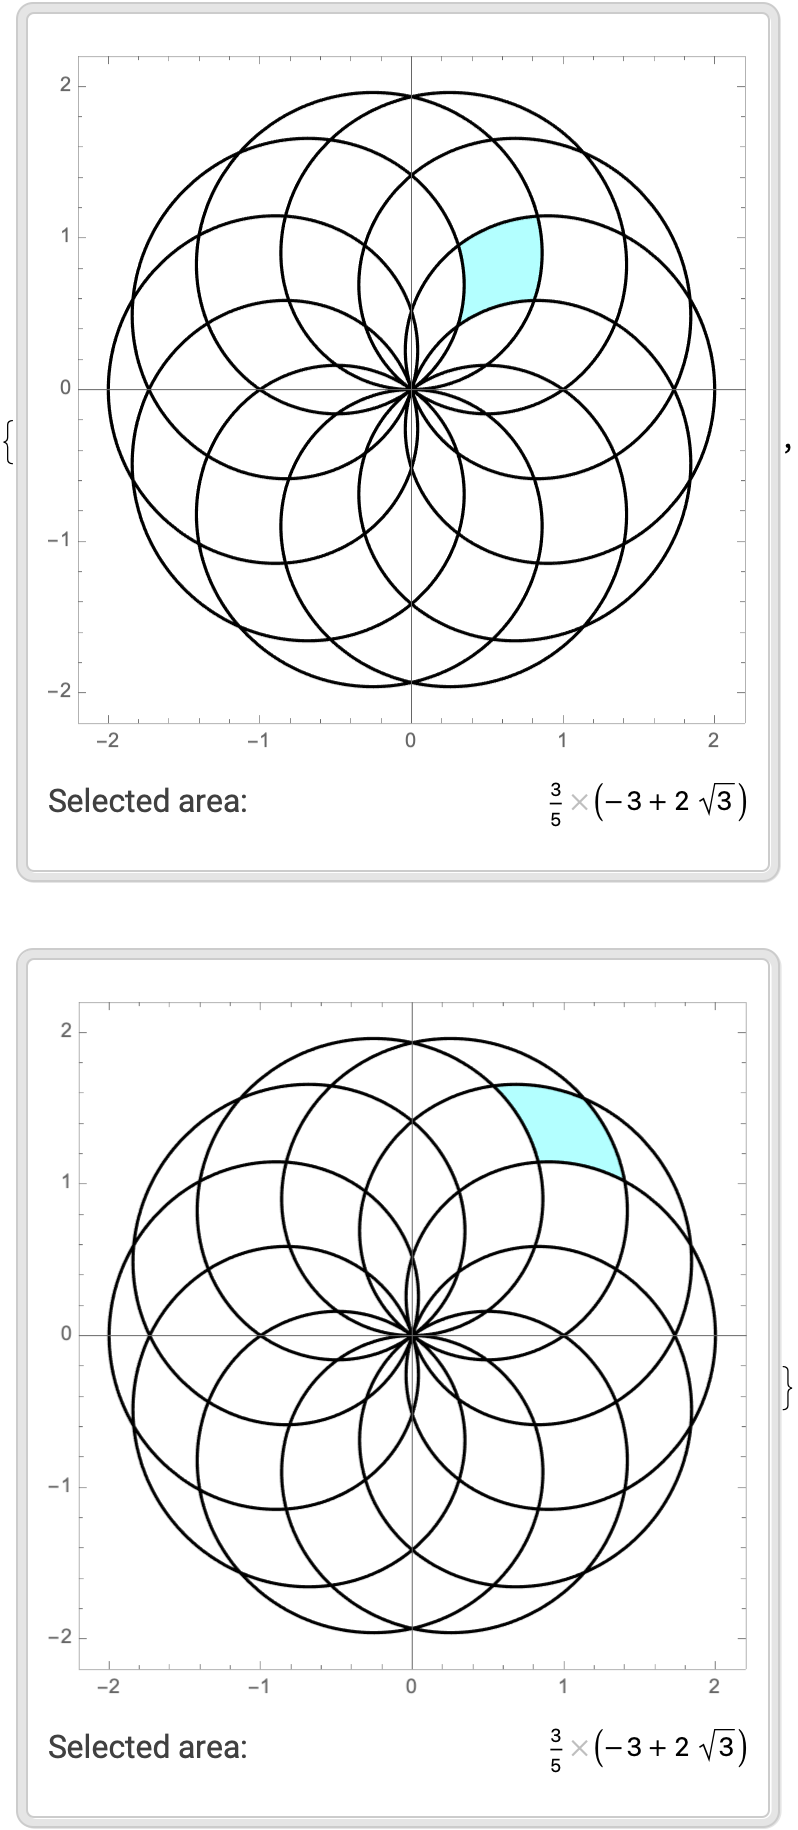
![{ResourceFunction["RoseCurveAnalysis"][2, 5/6, "Point" -> {0.5, 0.75}], ResourceFunction["RoseCurveAnalysis"][2, 5/6, "Point" -> {1, 1.25}]}](https://www.wolframcloud.com/obj/resourcesystem/images/f97/f9705df1-5295-4b2e-ab71-941469d4627f/5c9a31751b514190.png)
![SystemOpen[
FileNameJoin[{DirectoryName[FindFile["ResourceFunctionHelpers`"]], "RoseCurveProperties.wl"}]]](https://www.wolframcloud.com/obj/resourcesystem/images/f97/f9705df1-5295-4b2e-ab71-941469d4627f/2ffad0366db9bcc2.png)