Wolfram Function Repository
Instant-use add-on functions for the Wolfram Language
Function Repository Resource:
User interface for drawing 2D mesh regions
ResourceFunction["RegionInputField"][Dynamic[var]] creates a user interface for drawing a MeshRegion which updates var. |
Draw the outline of the desired region:
| In[1]:= |
| Out[1]= | 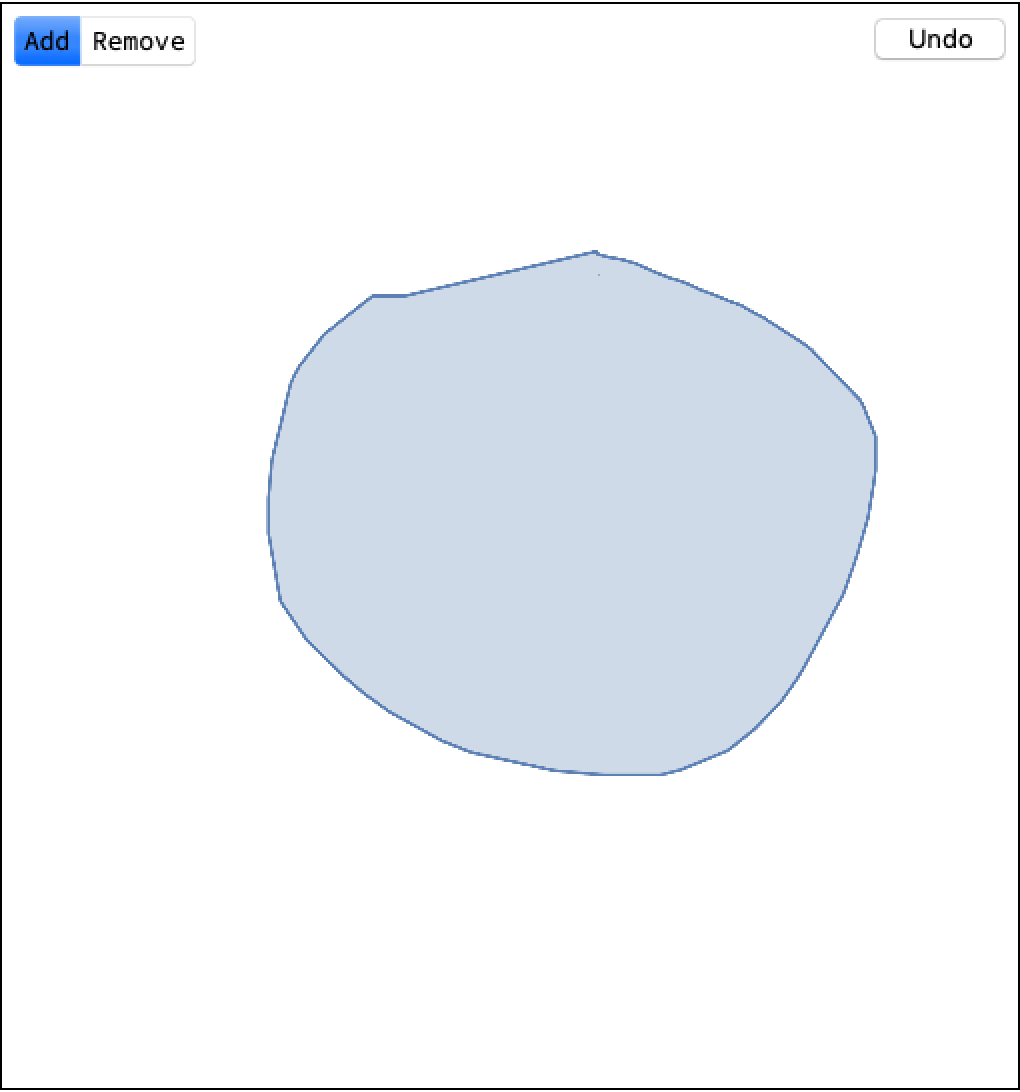 |
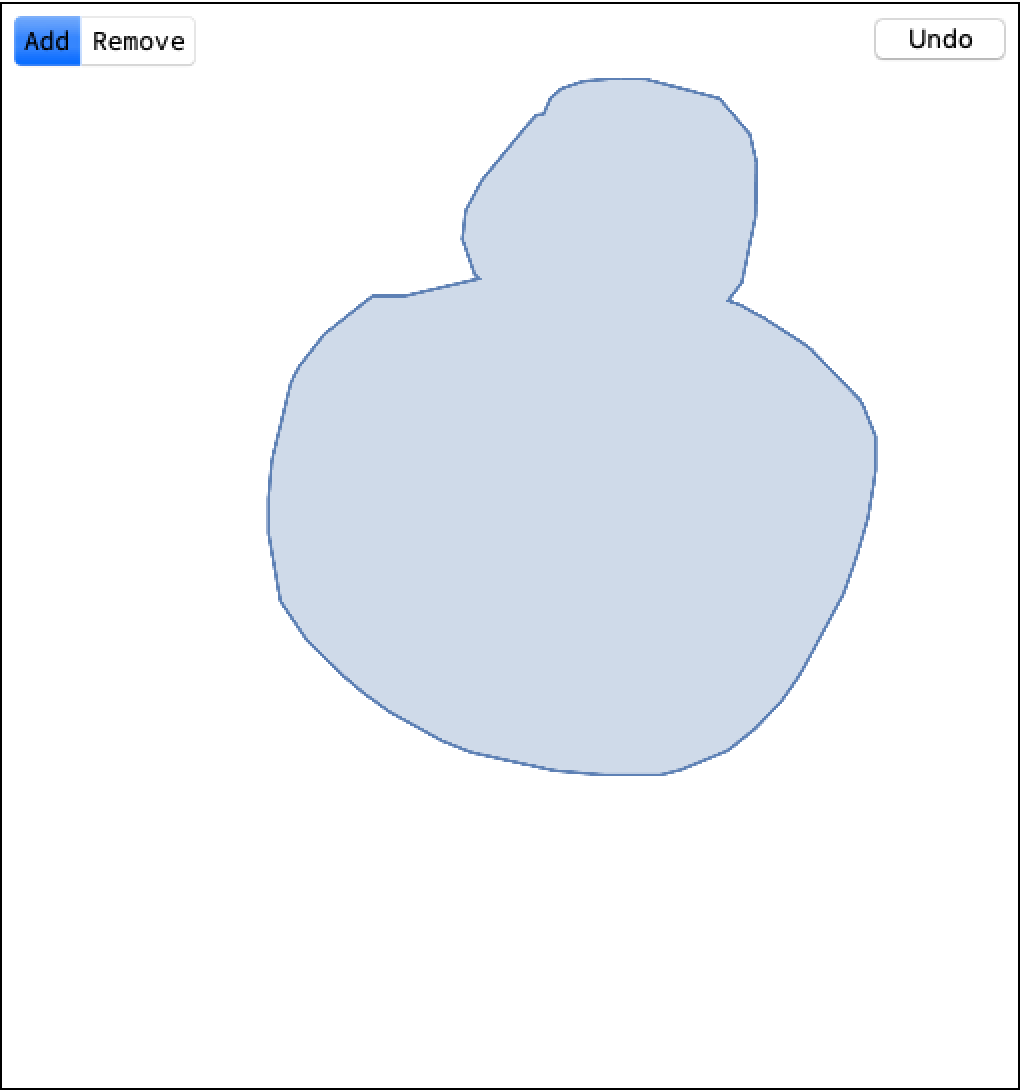
Draw additional areas which will be included in the same region:
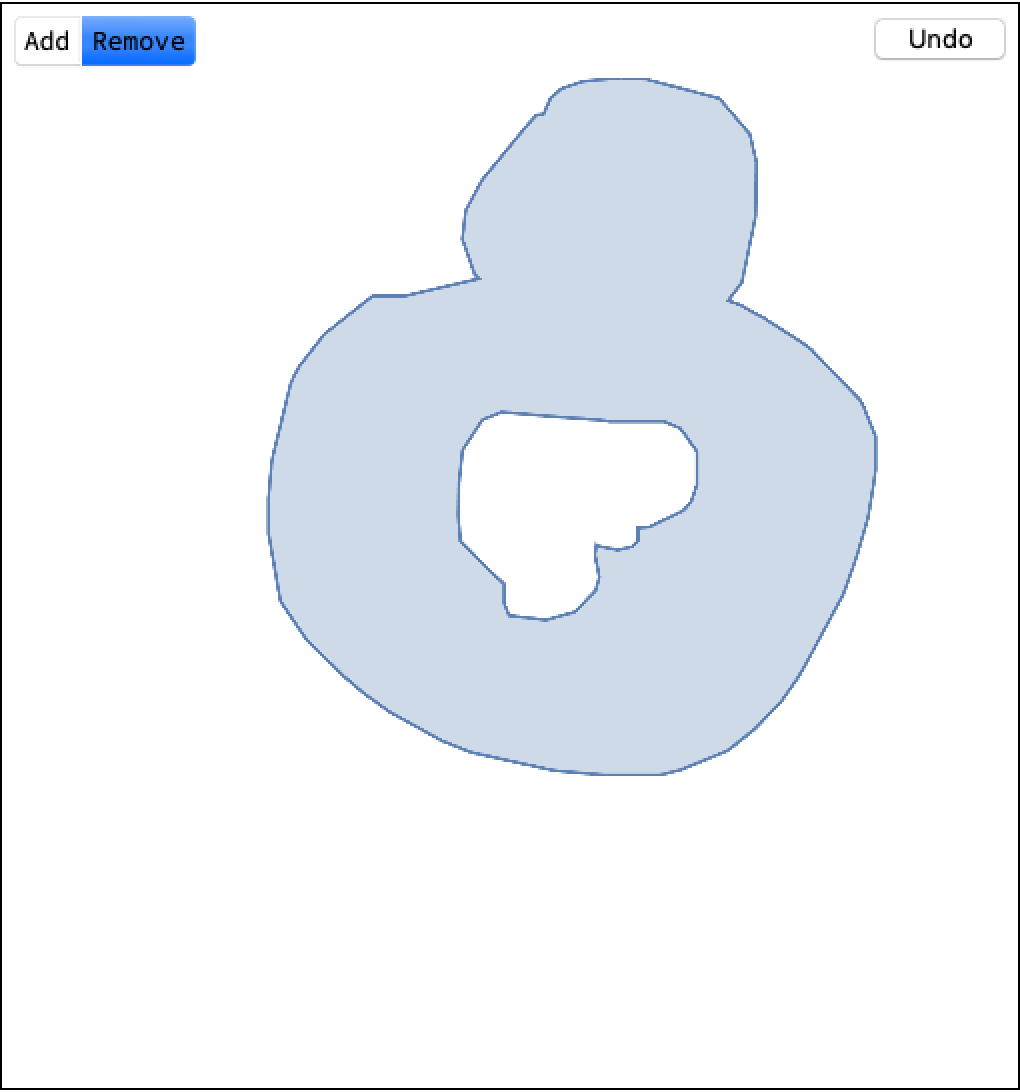
Set the SetterBar to "Remove" to subtract drawn areas from the region:
The Dynamic variable is updated with the drawn region:
| In[2]:= |
| Out[2]= | 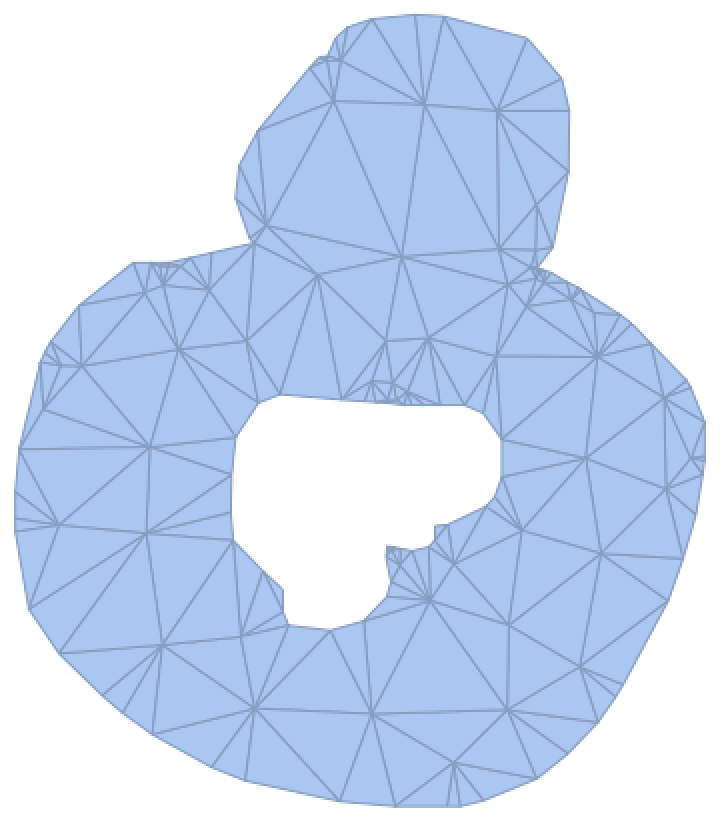 |
RegionInputField supports the options of RegionPlot. These affect the appearance of interface but not the output Region:
| In[3]:= |
| Out[3]= | 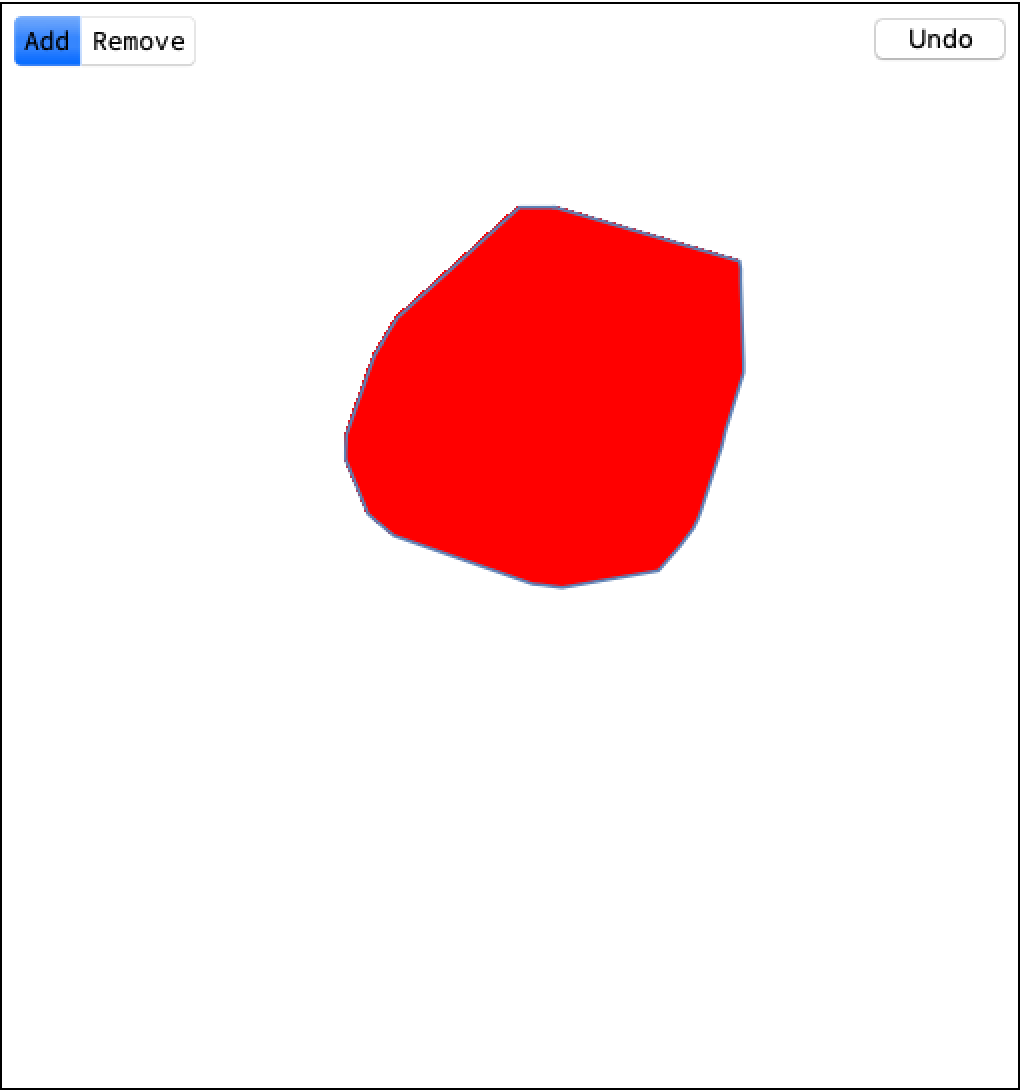 |
The default PlotRange is {{0,1},{0,1}}, which limits the coordinates that you can draw over. To create regions with larger coordinates, set the PlotRange for the RegionInputField:
| In[4]:= |
| Out[4]= | 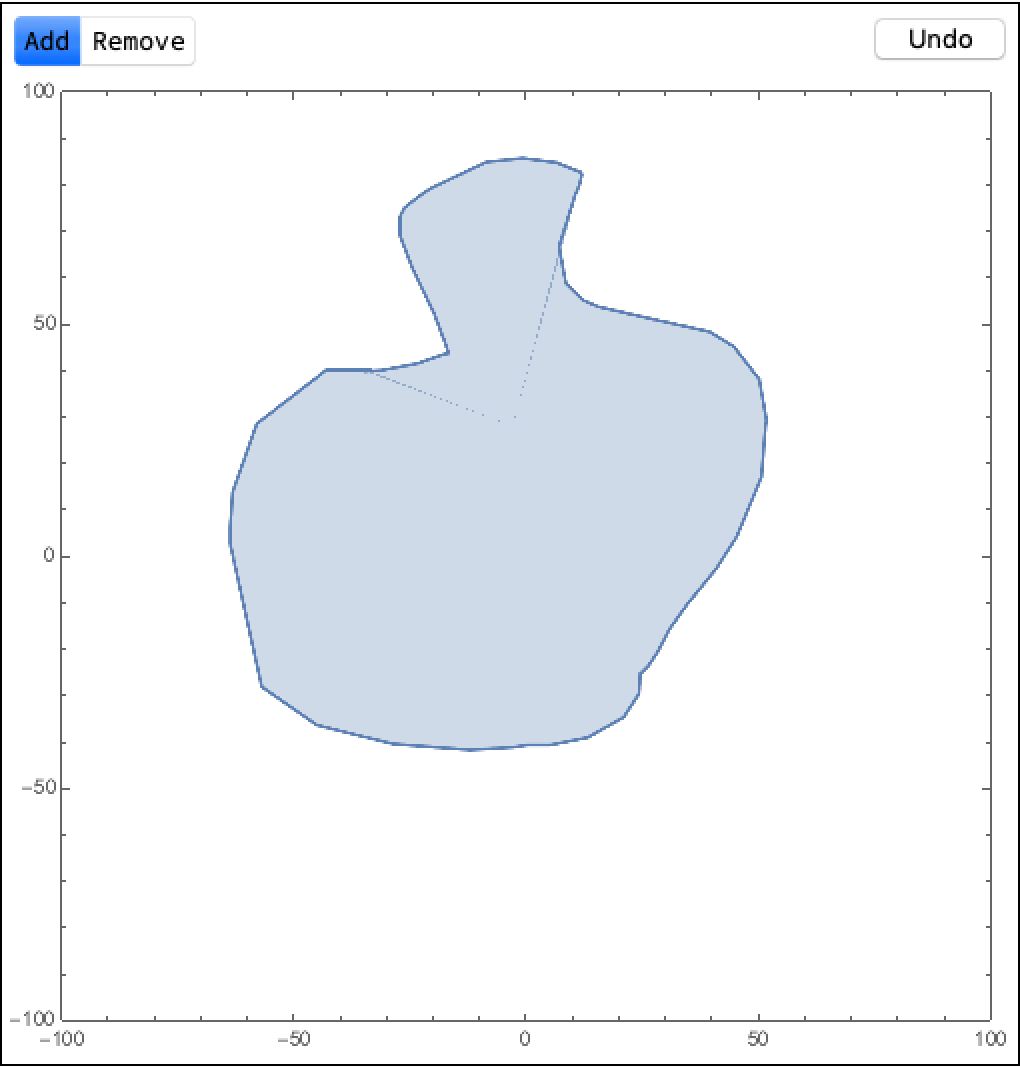 |
Calculate geometric properties of your region in real-time as it updates:
| In[5]:= | ![DynamicModule[{x}, Column[{ResourceFunction["RegionInputField"][Dynamic[x], ImageSize -> {300, 300}],
TextGrid[{{"Area: ", Dynamic[Area[x]]}, {"Perimeter: ", Dynamic[Perimeter[x]]}}]}]]](https://www.wolframcloud.com/obj/resourcesystem/images/4b3/4b3b3026-dd03-4129-a757-11b2f4b5ec19/1-0-0/2e5117beb3322a9d.png) |
| Out[5]= | 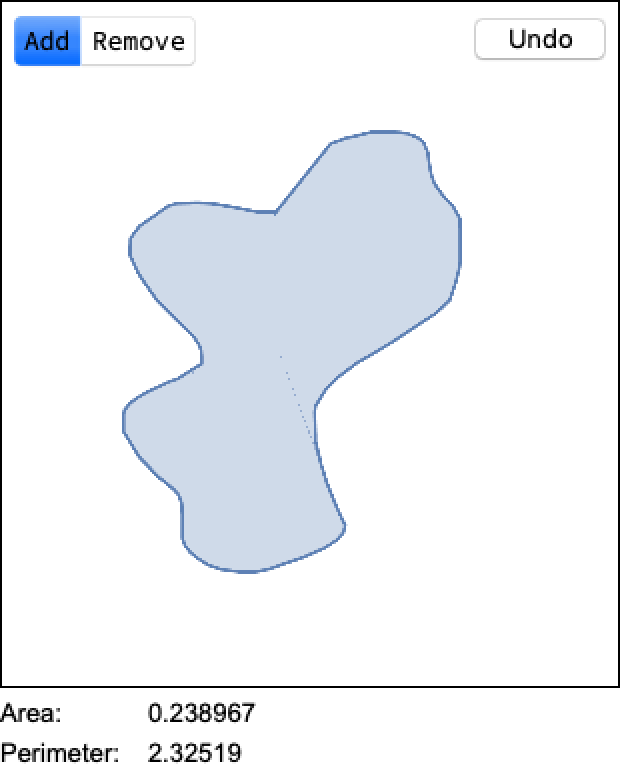 |
This work is licensed under a Creative Commons Attribution 4.0 International License