Wolfram Function Repository
Instant-use add-on functions for the Wolfram Language
Function Repository Resource:
Extract the false positive rate, true positive rate and threshold values from the receiver operating characteristic (ROC) curve generated by a ClassifierMeasurementsObject
ResourceFunction["ROCPoints3D"][cmo] takes a ClassifierMeasurementsObject cmo and produces an Association in which the keys are all positive classes and the values are a list of the corresponding points constituting a three dimensional receiver operating characteristic (ROC) curve. | |
ResourceFunction["ROCPoints3D"][cmo,class] produces a list of the points constituting the receiver operating characteristic curve for class. |
Generate the ROC points for each possible positive class of the ClassifierMeasurementsObject:
| In[1]:= |
| Out[1]= |  |
Generate the ROC points for a designated positive class:
| In[2]:= |
| Out[2]= |
The ClassifierMeasurementsObject can also be generated by running a pre-built classifier against test data:
| In[3]:= | ![ResourceFunction["ROCPoints3D"][
ClassifierMeasurements[
Classify[titanicTraining, TrainingProgressReporting -> None], titanicTest] -> "survived"] // ResourceFunction[
ResourceObject[<|"Name" -> "AugmentedTerse", "ShortName" -> "AugmentedTerse", "UUID" -> "55ad4cc5-e284-40ca-a3cb-8a4166c38701", "ResourceType" -> "Function", "Version" -> "1.0.0", "Description" -> "An operator form of Short with an alternative compressed representation of the output", "RepositoryLocation" -> URL[
"https://www.wolframcloud.com/objects/resourcesystem/api/1.0"], "SymbolName" -> "FunctionRepository`$779c3314c408433eb6df4354526edb23`AugmentedTerse", "FunctionLocation" -> CloudObject[
"https://www.wolframcloud.com/obj/5aa416ea-2adb-41c1-9102-ddaa33f49612"]|>, ResourceSystemBase -> Automatic]][5]](https://www.wolframcloud.com/obj/resourcesystem/images/2b3/2b3d9224-5bb2-452c-b7b2-5cbf717a3e7c/6a41c4ba7eaaaa26.png) |
| Out[3]= |
Create two three dimensional ROC curves showing how well a classifier performs on men and women on board the Titanic:
| In[4]:= | ![(ResourceFunction[
ResourceObject[<|"Name" -> "MapReduceOperator", "ShortName" -> "MapReduceOperator", "UUID" -> "856f4937-9a4c-44a9-88ae-cfc2efd4698f", "ResourceType" -> "Function", "Version" -> "1.0.0", "Description" -> "Like an operator form of GroupBy, but where one also specifies a reducer function to be applied", "RepositoryLocation" -> URL[
"https://www.wolframcloud.com/objects/resourcesystem/api/1.0"], "SymbolName" -> "FunctionRepository`$ad7fe533436b4f8294edfa758a34ac26`MapReduceOperator", "FunctionLocation" -> CloudObject[
"https://www.wolframcloud.com/obj/6d981522-1eb3-4b54-84f6-55667fb2e236"]|>, ResourceSystemBase -> Automatic]][(#[[1, 3]] &) -> Identity, (ClassifierMeasurements[cl, #] &)/*(ResourceFunction[
"ROCPoints3D"][# -> "survived"] &)/*Line][titanicTest]) // pipeline/*KeySort](https://www.wolframcloud.com/obj/resourcesystem/images/2b3/2b3d9224-5bb2-452c-b7b2-5cbf717a3e7c/71b3351cf1cbb6e5.png) |
| Out[4]= |  |
Smooth the ROC curves by inserting MovingAverage into the operator pipeline:
| In[5]:= | ![(ResourceFunction[
ResourceObject[<|"Name" -> "MapReduceOperator", "ShortName" -> "MapReduceOperator", "UUID" -> "856f4937-9a4c-44a9-88ae-cfc2efd4698f", "ResourceType" -> "Function", "Version" -> "1.0.0", "Description" -> "Like an operator form of GroupBy, but where one also specifies a reducer function to be applied", "RepositoryLocation" -> URL[
"https://www.wolframcloud.com/objects/resourcesystem/api/1.0"], "SymbolName" -> "FunctionRepository`$ad7fe533436b4f8294edfa758a34ac26`MapReduceOperator", "FunctionLocation" -> CloudObject[
"https://www.wolframcloud.com/obj/6d981522-1eb3-4b54-84f6-55667fb2e236"]|>, ResourceSystemBase -> Automatic]][(#[[1, 3]] &) -> Identity, (ClassifierMeasurements[cl, #] &)/*(ResourceFunction[
"ROCPoints3D"][# -> "survived"] &)/*(MovingAverage[#, 5] &)/*
Line][titanicTest]) // pipeline/*KeySort](https://www.wolframcloud.com/obj/resourcesystem/images/2b3/2b3d9224-5bb2-452c-b7b2-5cbf717a3e7c/5f431dff54bcc181.png) |
| Out[5]= | 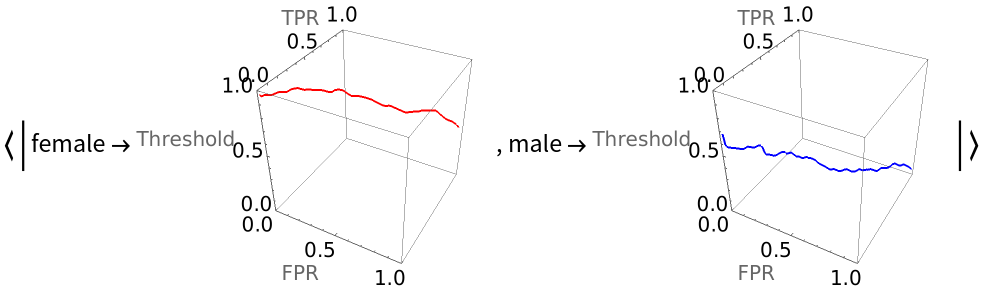 |
By viewing a three dimensional ROC curve from the top with an orthographic perspective, one gets the equivalent of a traditional, two-dimensional ROC curve:

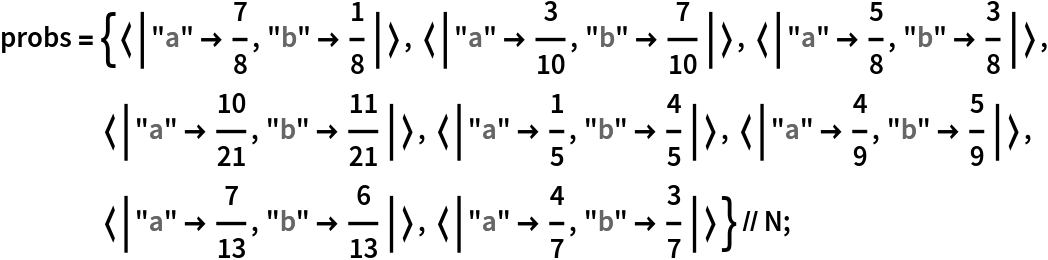
| In[6]:= | ![ResourceFunction["ROCPoints3D"][
ClassifierMeasurements[probs, targets] -> "b"] // ({Thick, Line[#]} &)/*(Graphics3D[#, Axes -> True, AxesLabel -> {"FPR", "TPR", "Threshold"}, ViewPoint -> {0, 0, \[Infinity]}] &)](https://www.wolframcloud.com/obj/resourcesystem/images/2b3/2b3d9224-5bb2-452c-b7b2-5cbf717a3e7c/58f8871a3a6c68ca.png) |
| Out[6]= | 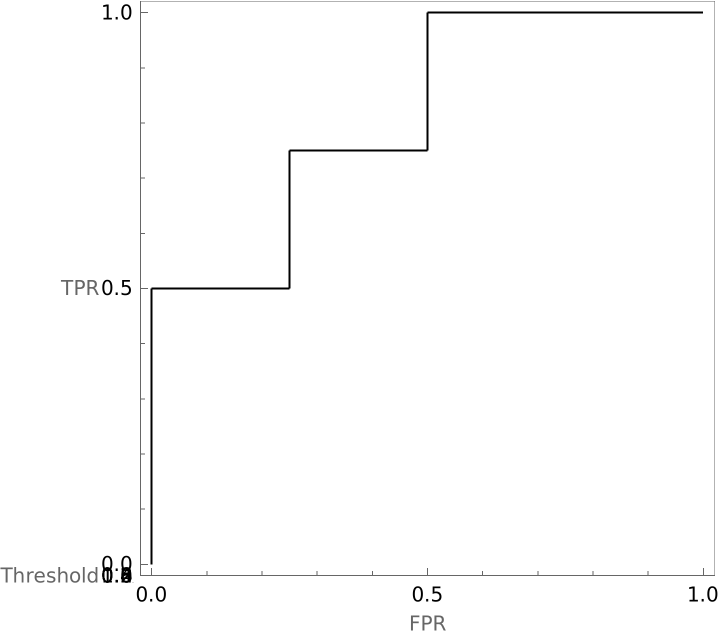 |
Compare the relationship between threshold and false positive rate and threshold and true positive rate when "survived" is the positive class:
| In[7]:= | ![titanicTraining = ExampleData[{"MachineLearning", "Titanic"}, "TrainingData"];
titanicTest = ExampleData[{"MachineLearning", "Titanic"}, "TestData"];
cmo = ClassifierMeasurements[
Classify[titanicTraining, TrainingProgressReporting -> None], titanicTest]; ListLinePlot[{Part[
ResourceFunction["ROCPoints3D"][cmo -> "survived"], All, {3, 1}], Part[ResourceFunction["ROCPoints3D"][cmo -> "survived"], All, {3, 2}]}, AxesLabel -> {"Threshold", "Rate"}, PlotLegends -> {"False Positive Rate", "True Positive Rate"}
]](https://www.wolframcloud.com/obj/resourcesystem/images/2b3/2b3d9224-5bb2-452c-b7b2-5cbf717a3e7c/6f4a6ede06fef02b.png) |
| Out[7]= | 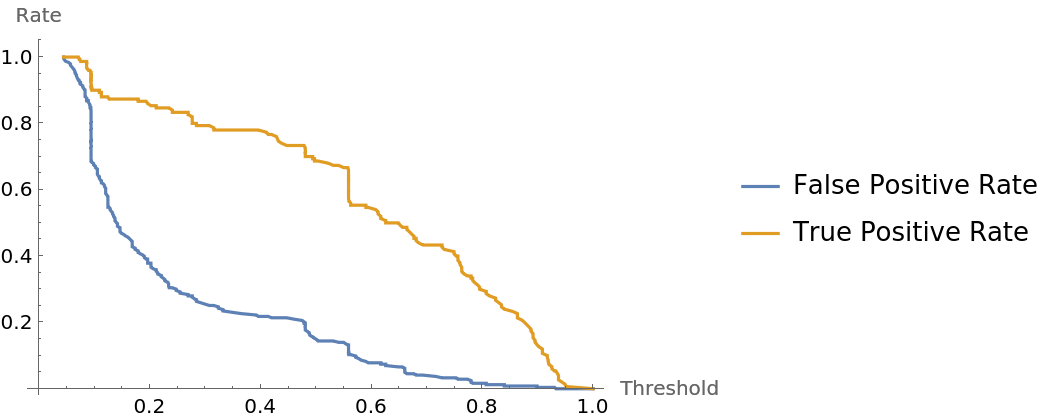 |
Find a formula that approximates the relationship between threshold and false positive rate:
| In[8]:= | ![titanicTraining = ExampleData[{"MachineLearning", "Titanic"}, "TrainingData"];
titanicTest = ExampleData[{"MachineLearning", "Titanic"}, "TestData"];
With[{cmo = ClassifierMeasurements[
Classify[titanicTraining, TrainingProgressReporting -> None], titanicTest]}, FindFormula[
Part[ResourceFunction["ROCPoints3D"][cmo -> "survived"], All, {3, 1}], t]]](https://www.wolframcloud.com/obj/resourcesystem/images/2b3/2b3d9224-5bb2-452c-b7b2-5cbf717a3e7c/1d886873c154babf.png) |
| Out[8]= |
Compare ROC curves for classifiers examining the Titanic data when each gender gets its own classifier, to ROC curves created when a classifier built on all the data is then applied to each gender. Notice that the false positive rates and true positive rates when the threshold equals 0.5 differ depending on which approach is taken.
Build the unified classifier' s ROC curves for each gender:

| In[9]:= | ![Roc3dUnifiedClassifier = (ResourceFunction[
ResourceObject[<|"Name" -> "MapReduceOperator", "ShortName" -> "MapReduceOperator", "UUID" -> "856f4937-9a4c-44a9-88ae-cfc2efd4698f", "ResourceType" -> "Function", "Version" -> "1.0.0", "Description" -> "Like an operator form of GroupBy, but where one also specifies a reducer function to be applied", "RepositoryLocation" -> URL[
"https://www.wolframcloud.com/objects/resourcesystem/api/1.0"], "SymbolName" -> "FunctionRepository`$ad7fe533436b4f8294edfa758a34ac26`MapReduceOperator", "FunctionLocation" -> CloudObject[
"https://www.wolframcloud.com/obj/6d981522-1eb3-4b54-84f6-55667fb2e236"]|>, ResourceSystemBase -> Automatic]][(#[[1, 3]] &) -> Identity, (ClassifierMeasurements[cl, #] &)/*(ResourceFunction[
"ROCPoints3D"][# -> "survived"] &)/*Line][titanicTest]) // pipelineDarker/*KeySort](https://www.wolframcloud.com/obj/resourcesystem/images/2b3/2b3d9224-5bb2-452c-b7b2-5cbf717a3e7c/191b49e09d284a99.png) |
| Out[9]= | 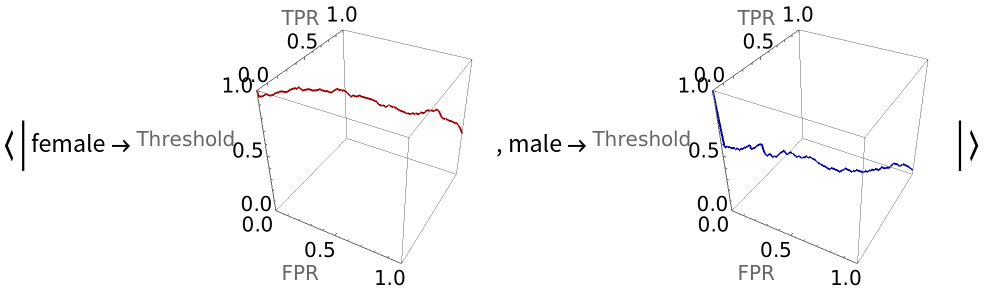 |
Generate separate training datasets for each gender and build a classifier for each:
Generate the three dimensional ROC curve for each gender when the gender-specific classifiers are applied:
| In[10]:= | ![Roc3dSeparateClassifiers = MapThread[({classifier, data} |-> (ResourceFunction["ROCPoints3D"][
ClassifierMeasurements[classifier, data] -> "survived"])), {{clMale, clFemale}, Values@GroupBy[titanicTest, #[[1, 3]] &]}] // Map[Line]/*(AssociationThread[{"male", "female"}, #] &)/*pipeline/*
KeySort](https://www.wolframcloud.com/obj/resourcesystem/images/2b3/2b3d9224-5bb2-452c-b7b2-5cbf717a3e7c/08f9de7fe8e77e7b.png) |
| Out[10]= | 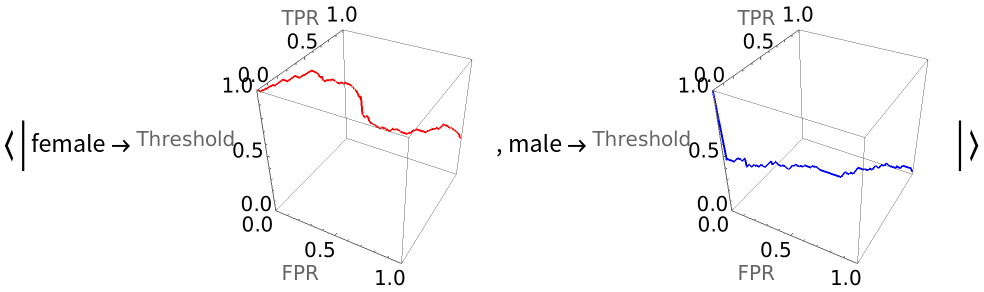 |
Compare the unified and gender-specific classifiers' ROC curves in three dimensions and show where they intersect a plane with a threshold value of 0.5:
| In[11]:= | ![Merge[{Roc3dSeparateClassifiers, Roc3dUnifiedClassifier}, Show[##, Graphics3D[{Yellow, Opacity[0.7], InfinitePlane[{{0, 0, 0.5}, {0, 1, 0.5}, {1, 0, 0.5}}]}], ImageSize -> 400] &] // KeySort](https://www.wolframcloud.com/obj/resourcesystem/images/2b3/2b3d9224-5bb2-452c-b7b2-5cbf717a3e7c/655a8a8d0dc5f8ec.png) |
| Out[11]= | 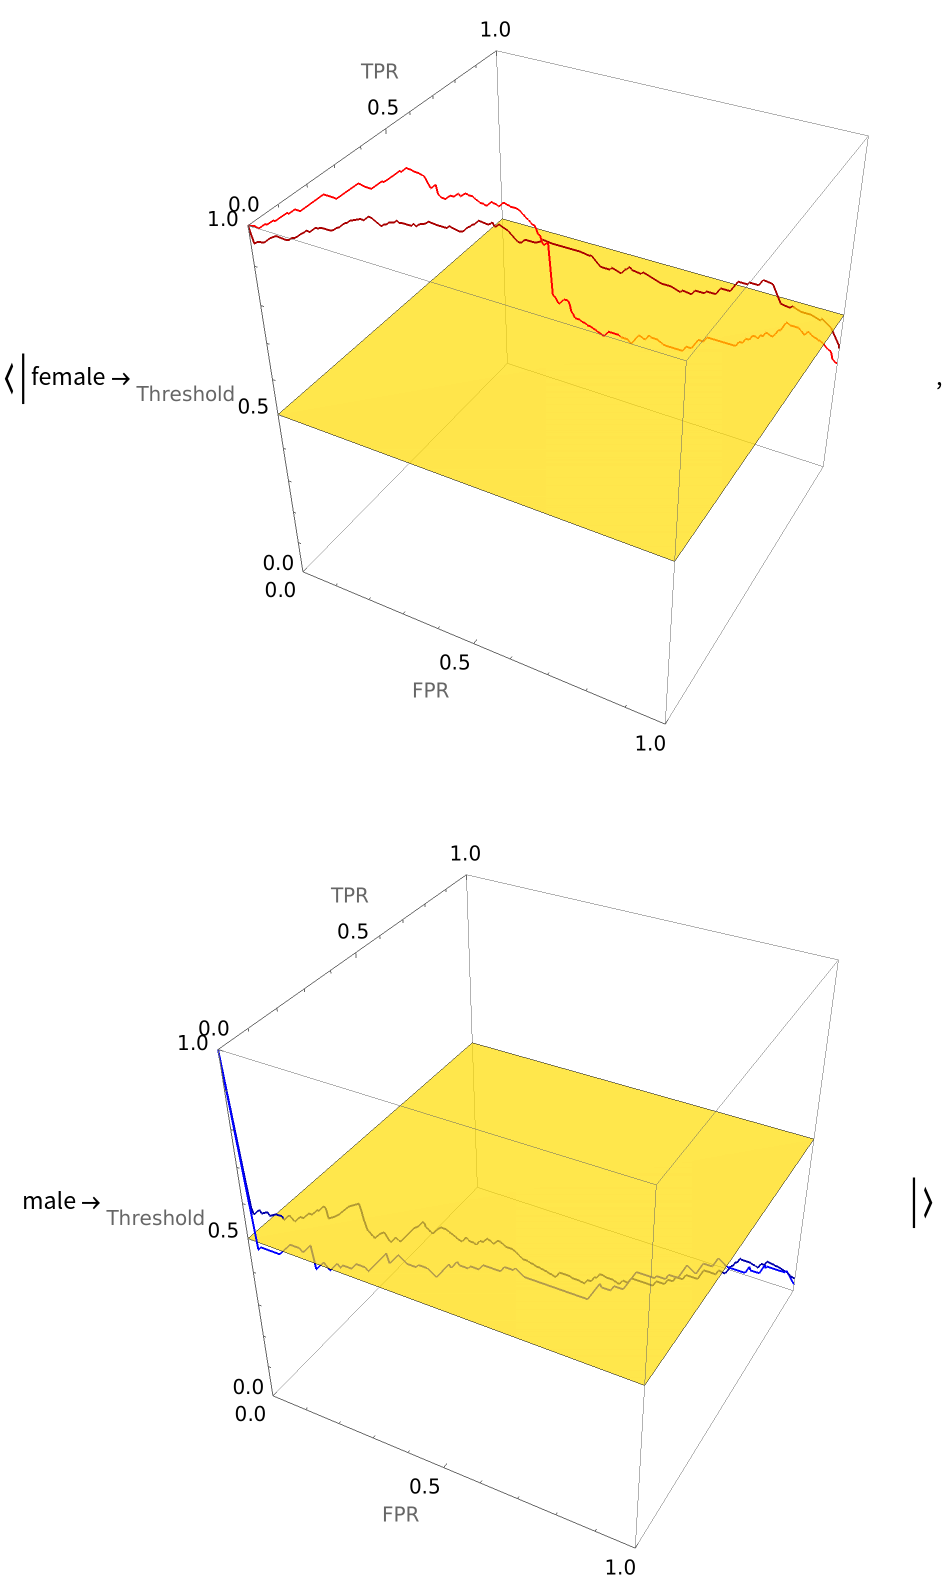 |
This work is licensed under a Creative Commons Attribution 4.0 International License