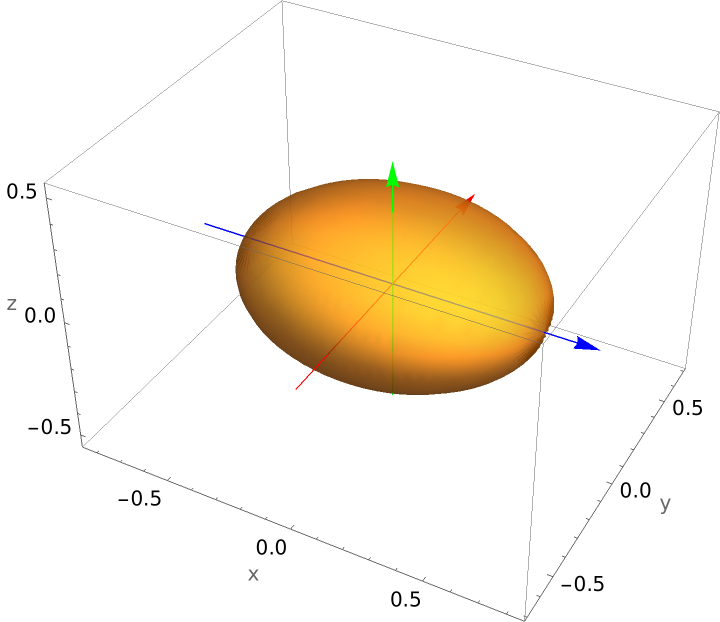
Function Repository Resource:

QuadricSurfacePlot

Source Notebook

Classify and plot any polynomial of degree two or less in three or fewer variables

Contributed by: Dennis M Schneider and Robby S Villegas

ResourceFunction["QuadricSurfacePlot"][poly,vars]

plots the quadric surface specified by poly=0 as a function of the variables vars.

ResourceFunction["QuadricSurfacePlot"][poly1poly2,vars]

returns ResourceFunction["QuadricSurfacePlot"][poly1-poly2,vars].

ResourceFunction["QuadricSurfacePlot"][poly,vars,"ReturnData"]

returns the data used to produce the plot, wrapped in Inactive.

Details and Options

The expression poly should be a polynomial of degree two or less, in three or fewer variables. The argument vars specifies the variables in poly, and must have length three.
With "ReturnData", the user has access to all the data used to produce the plot which allows the user make any desired modifications. Use Activate to restore the plot.
Styles for degenerate conics (a point, a set of lines, or a polygon) are set with the option "PrimitivesStyle".
ResourceFunction["QuadricSurfacePlot"] uses ResourceFunction["DiagonalizeQuadratic"] to compute the canonical form of a quadratic. Using the canonical form it generates parametric equations of the surface. The option "DrawAxes" allows for the principal axes to be included with the plot. The axes are color coded so that axes colors Red, Green, Blue determine a right handed system. Other options are those of ParametricPlot3D.

Examples

Basic Examples (19) 

Plot an ellipsoid:

In[1]:=
ResourceFunction["QuadricSurfacePlot"][
 3 x^2 + 5 y^2 + 11 z^2 - 1, {x, y, z}, "DrawAxes" -> True, Mesh -> None]
Out[1]=

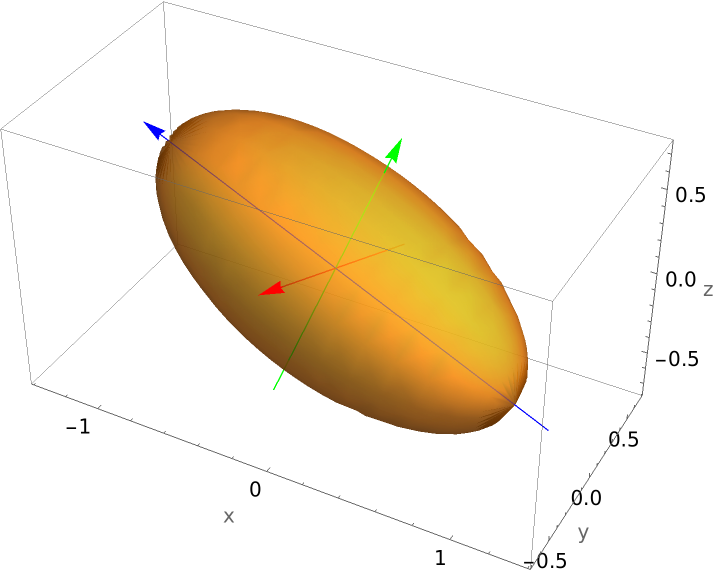
Plot an ellipsoid whose graph requires a rotation:

In[2]:=
ResourceFunction["QuadricSurfacePlot"][ x^2 + x y - y z + x z + 4 y^2 + 3 z^2 - 1, {x, y, z}, "DrawAxes" -> True, Mesh -> None]
Out[2]=

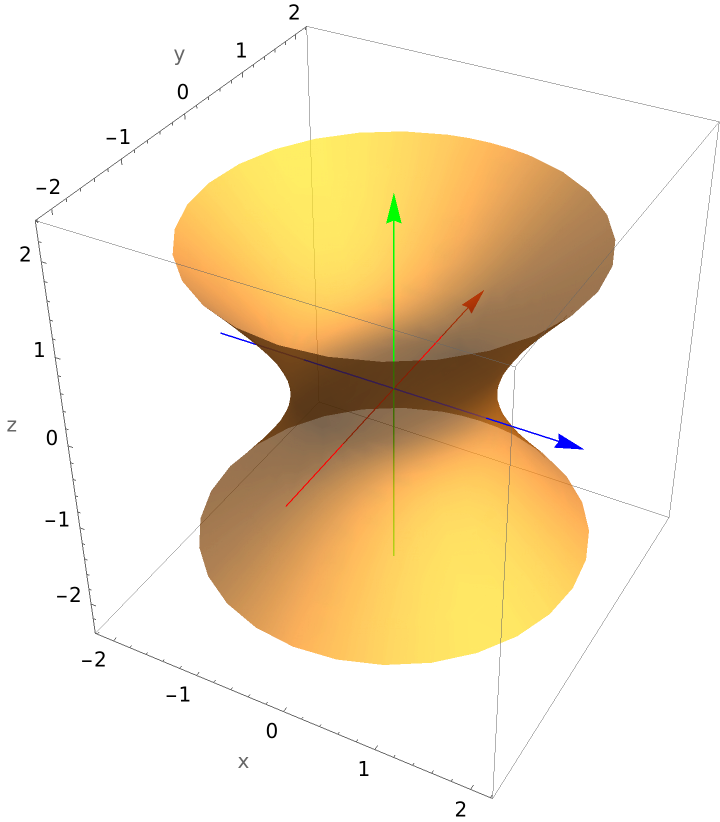
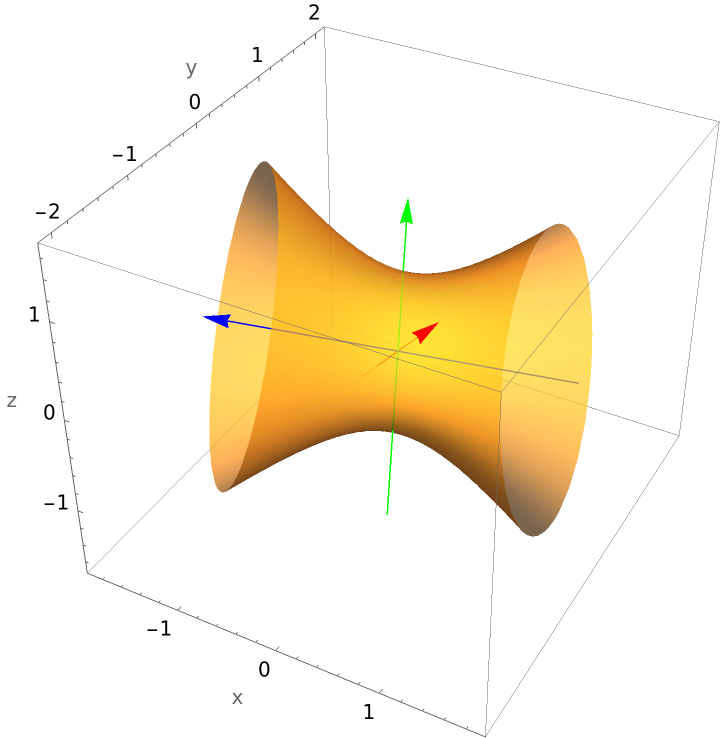
Plot a hyperboloid of one sheet:

In[3]:=
ResourceFunction["QuadricSurfacePlot"][x^2 + y^2 - z^2 - 1, {x, y, z},
  "DrawAxes" -> True, Mesh -> None]
Out[3]=

Plot a hyperboloid of one sheet whose equation contains a mixed term:

In[4]:=
ResourceFunction["QuadricSurfacePlot"][
 x^2 - 4 x y + y^2 + 4 x z + 3 z^2 - 1, {x, y, z},
 "DrawAxes" -> True, Mesh -> None]
Out[4]=

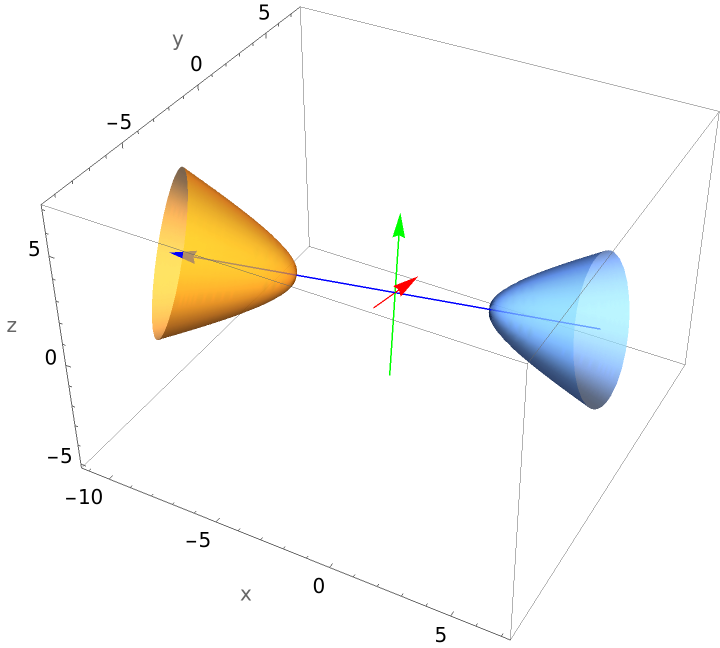
Plot a hyperboloid of two sheets whose graph requires a rotation and translation:

In[5]:=
ResourceFunction["QuadricSurfacePlot"][
 x^2 + y^2 - 2 x y + 2 z^2 + 2 x z - 2 y + 3, {x, y, z}, "DrawAxes" -> True, Mesh -> None]
Out[5]=

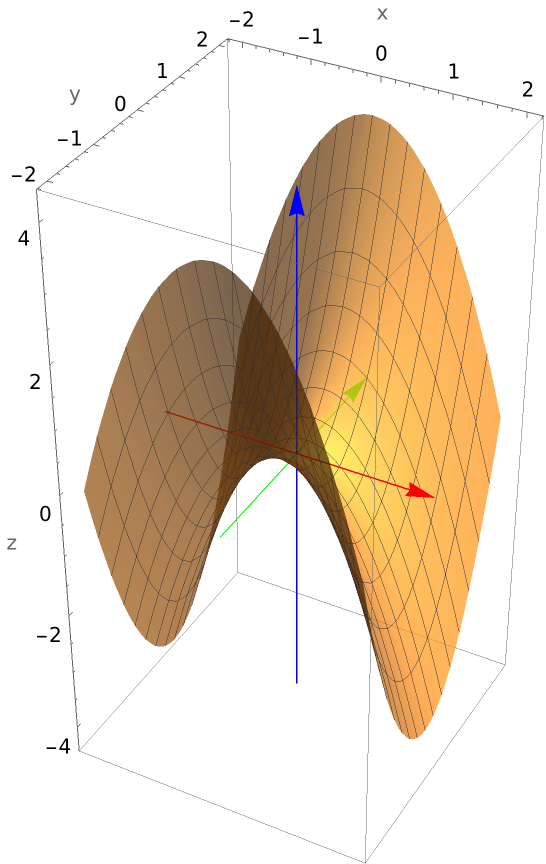
Plot a hyperbolic paraboloid:

In[6]:=
ResourceFunction["QuadricSurfacePlot"][y^2 - x^2 - z, {x, y, z}, "DrawAxes" -> True]
Out[6]=

Plot a hyperbolic paraboloid requiring a rotation and translation:

In[7]:=
ResourceFunction[
 "QuadricSurfacePlot"][-2 x y - 3 z + 3 y - 2 x - y z - y^2, {x, y, z}, "DrawAxes" -> True, Mesh -> None]
Out[7]=

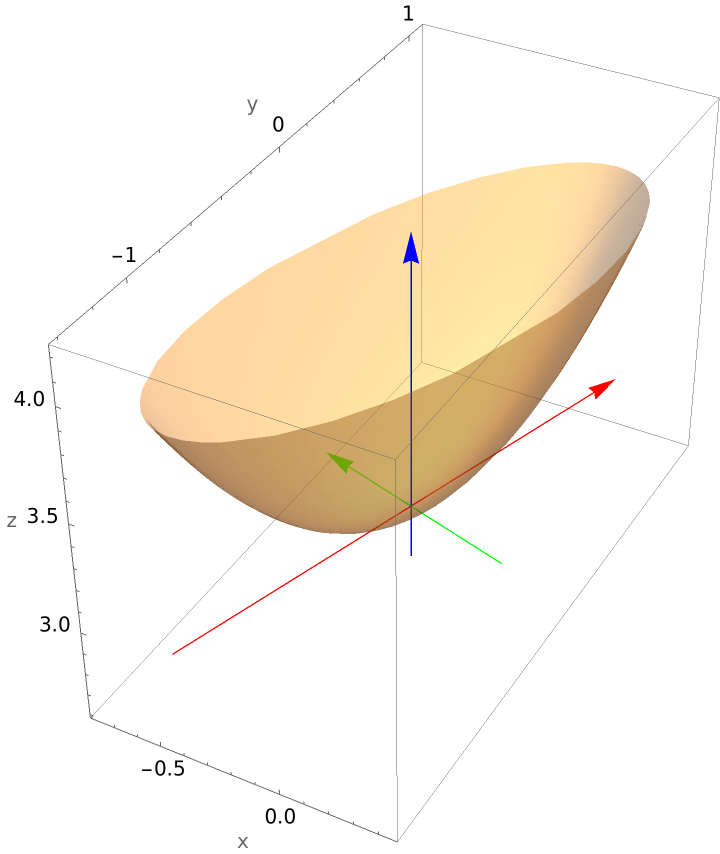
Plot an elliptical paraboloid requiring a rotation and translation:

In[8]:=
ResourceFunction["QuadricSurfacePlot"][
 4 x^2 + y^2 + x - 2 x y + 3 == z, {x, y, z}, "DrawAxes" -> True, PlotStyle -> Opacity[.4], Mesh -> None]
Out[8]=

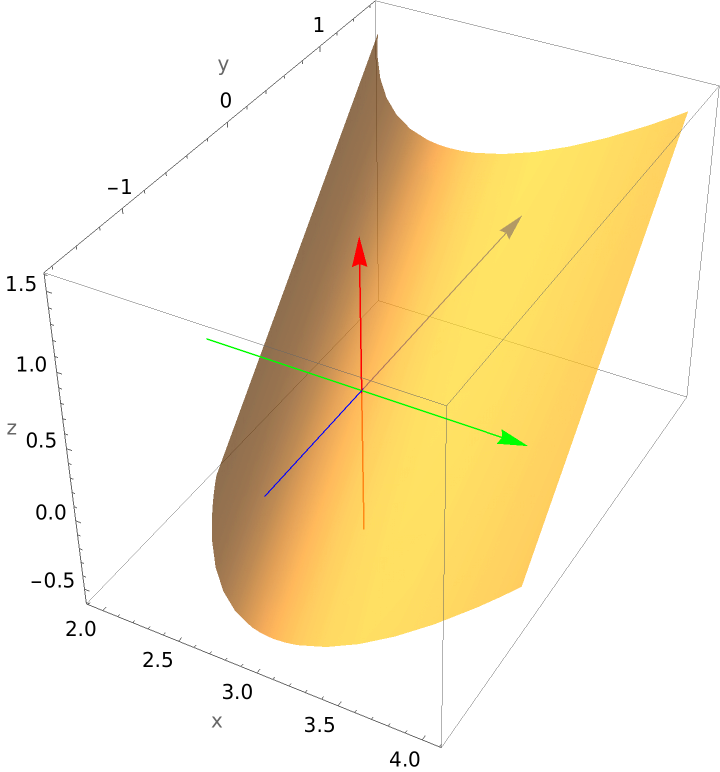
Plot an oblique parabolic cylinder:

In[9]:=
ResourceFunction[
 "QuadricSurfacePlot"][(x - 3)^2 - (y + 1) + z, {x, y, z}, "DrawAxes" -> True, Mesh -> None]
Out[9]=

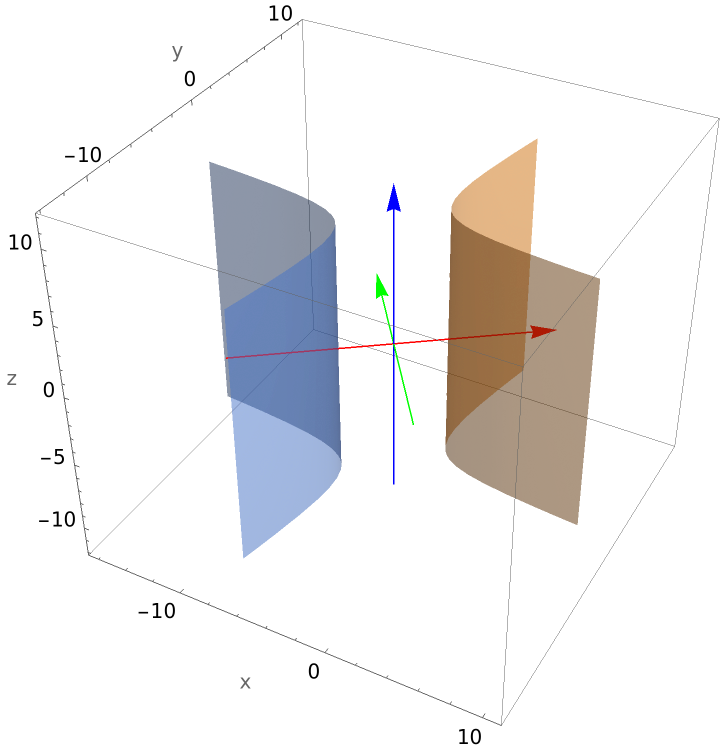
Plot a hyperbolic cylinder:

In[10]:=
ResourceFunction["QuadricSurfacePlot"][
 x^2 - 5 y^2 + 24 x + 47 y + 20 x y - 37, {x, y, z}, "DrawAxes" -> True, PlotStyle -> Opacity[.5], Mesh -> None]
Out[10]=

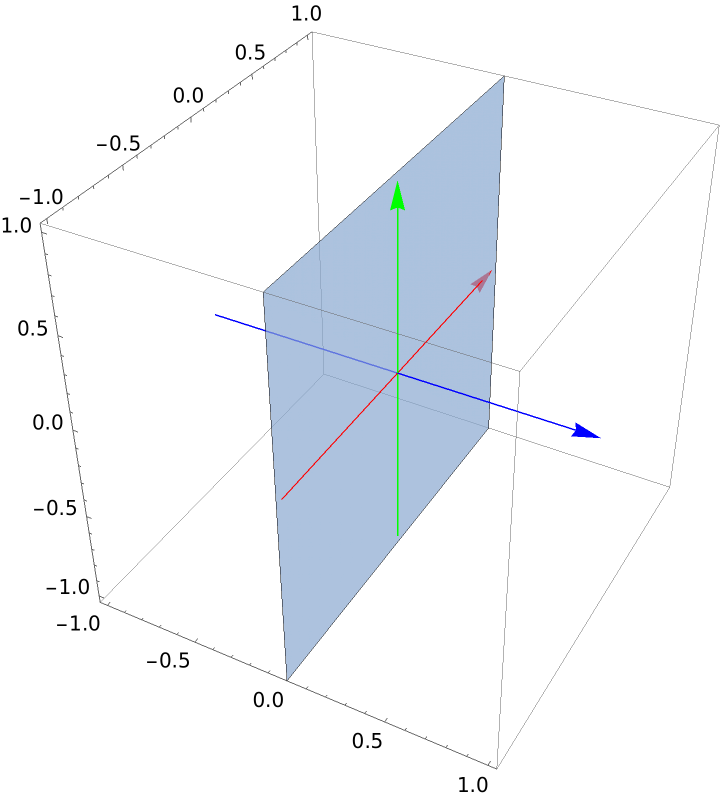
Plot a vertical plane:

In[11]:=
ResourceFunction["QuadricSurfacePlot"][x == 0, {x, y, z}, "DrawAxes" -> True]
Out[11]=

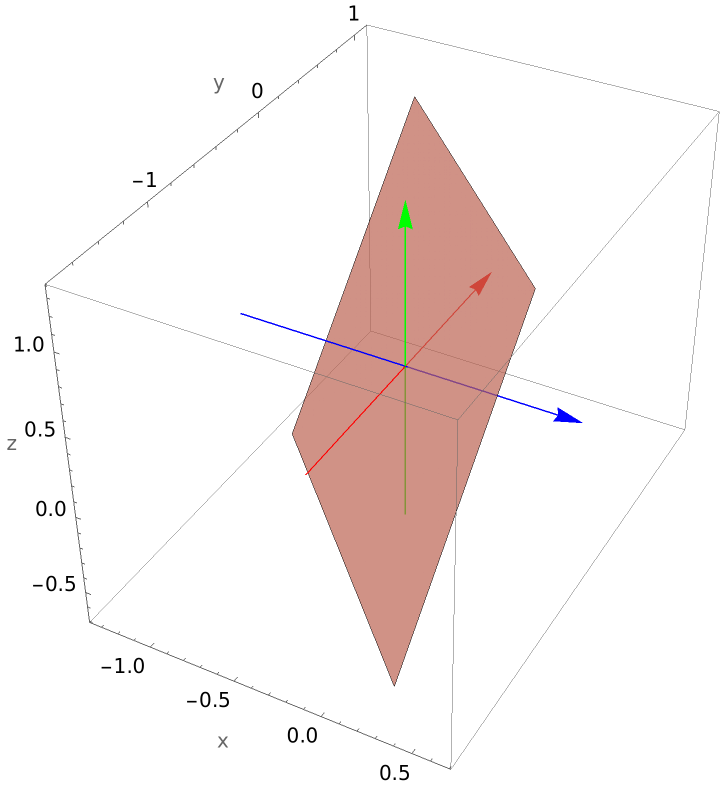
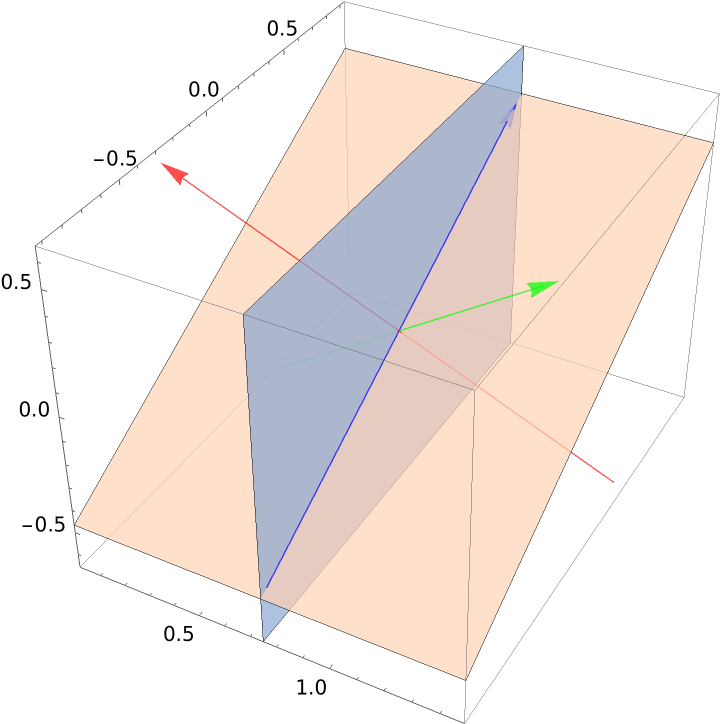
Plot an oblique plane:

In[12]:=
ResourceFunction["QuadricSurfacePlot"][x + y - z == -1, {x, y, z}, "DrawAxes" -> True]
Out[12]=

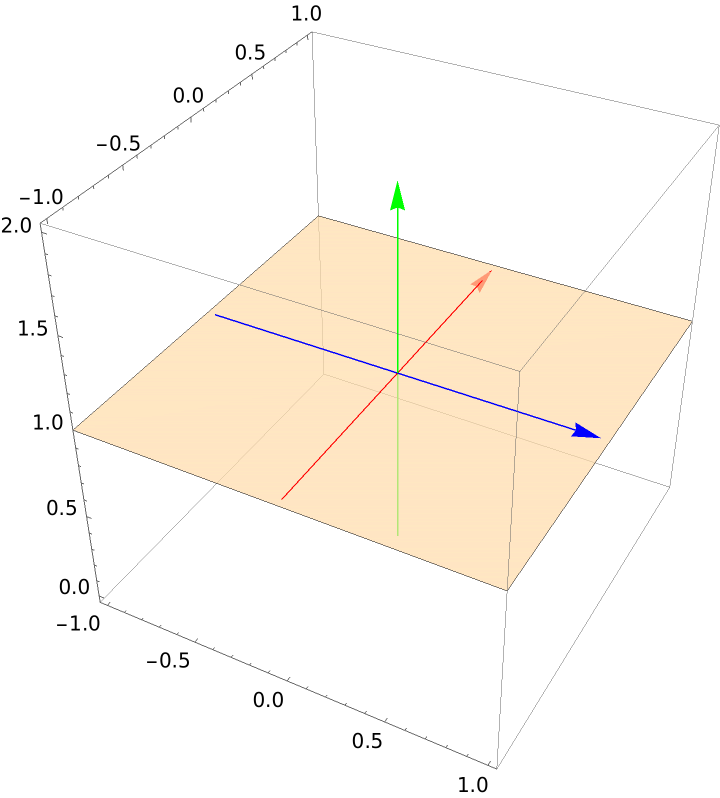
Plot a plane perpendicular to the z-axis:

In[13]:=
ResourceFunction["QuadricSurfacePlot"][z == 1, {x, y, z}, "DrawAxes" -> True]
Out[13]=

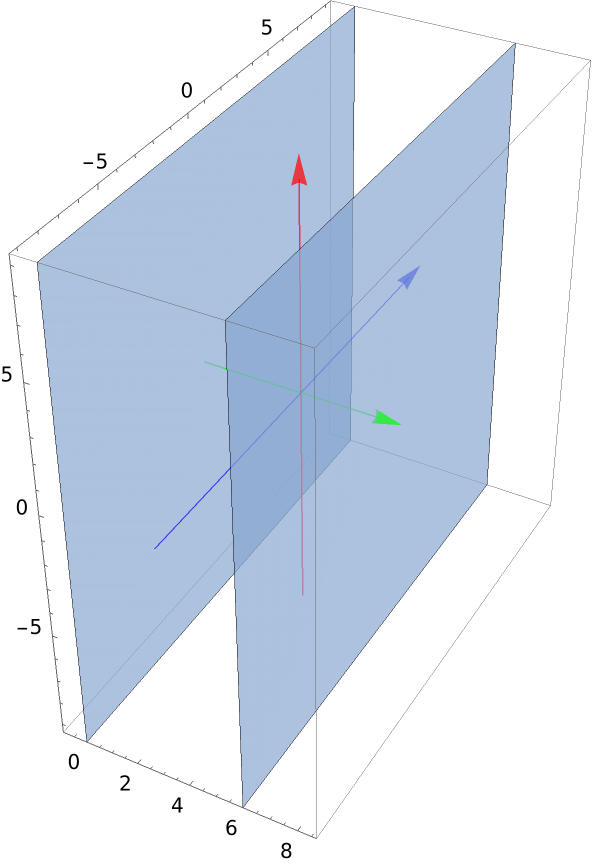
Plot two intersecting planes:

In[14]:=
ResourceFunction["QuadricSurfacePlot"][(4 x - 3) (2 z - y), {x, y, z},
  "DrawAxes" -> True, Mesh -> None]
Out[14]=

Plot two parallel planes:

In[15]:=
ResourceFunction["QuadricSurfacePlot"][(x - 3)^2 == 9, {x, y, z}, "DrawAxes" -> True, Mesh -> None]
Out[15]=

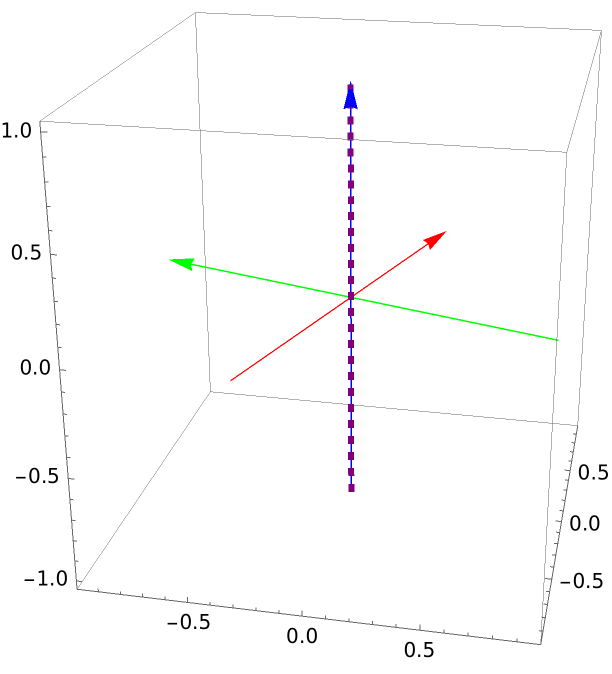
Since the only solution to the equation x2+2xy+4y2=0 is x=0 and y=0, the quadric surface determined by this equation is the z-axis:
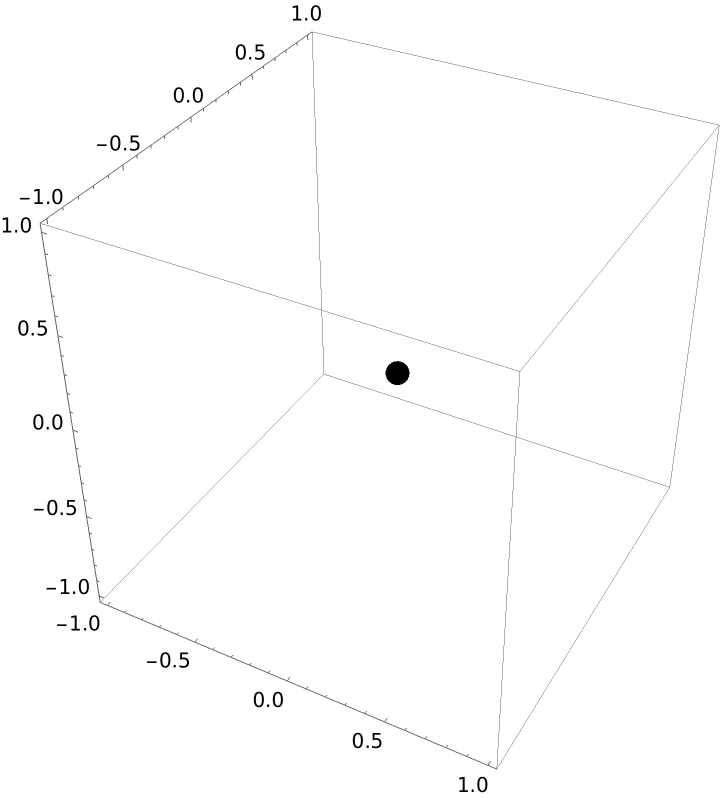
In[16]:=
ResourceFunction["QuadricSurfacePlot"][ x^2 + 2 x y + 4 y^2, {x, y, z}, "DrawAxes" -> True, "PrimitivesStyle" -> {{Purple, Dashed, AbsoluteThickness[3]}}]
Out[16]=

Plot the origin:

In[17]:=
ResourceFunction["QuadricSurfacePlot"][
 x^2 + y^2 + z^2 == 0, {x, y, z}]
Out[17]=

Plot an equation that is always satisfied:

In[18]:=
ResourceFunction["QuadricSurfacePlot"][x - x, {x, y, z}]
Out[18]=

Plot an equation that is never satisfied:

In[19]:=
ResourceFunction["QuadricSurfacePlot"][x^2 == -1, {x, y, z}]
Out[19]=

Scope (3) 

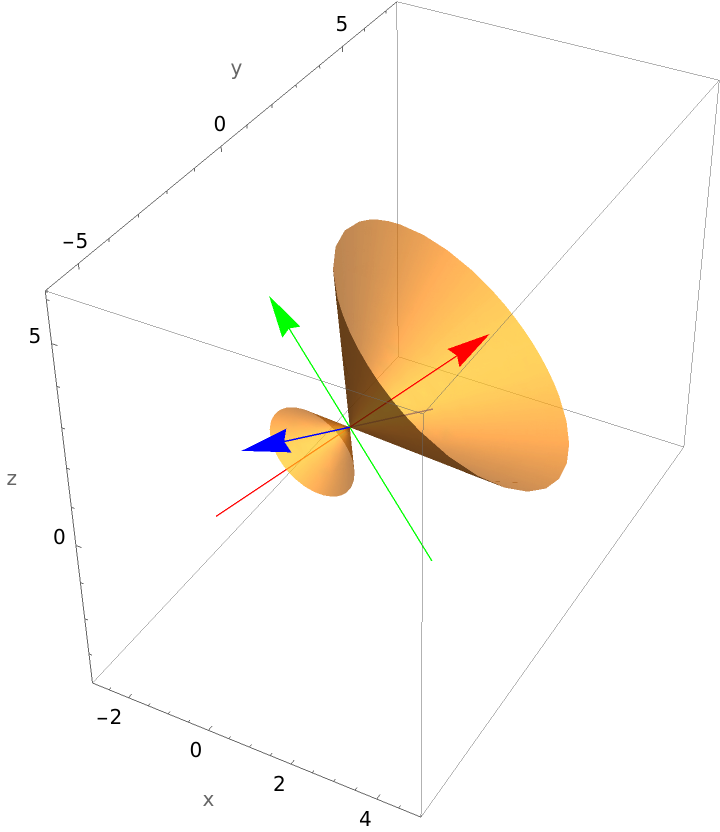
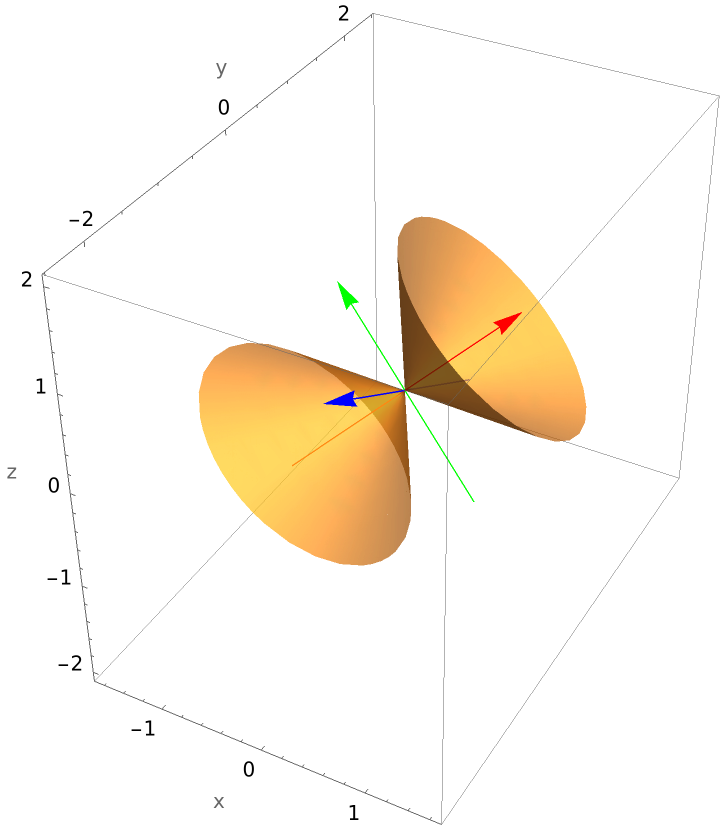
Use "ReturnData" to examine the data used to produce the plot and possibly modify the data. Plot a cone requiring a rotation and translation:

In[20]:=
ResourceFunction["QuadricSurfacePlot"][2 x y + y z + 3 x z, {x, y, z},
  "DrawAxes" -> True, Mesh -> None]
Out[20]=

Examine the data:

In[21]:=
cone = ResourceFunction["QuadricSurfacePlot"][
  2 x y + y z + 3 x z, {x, y, z}, "ReturnData", "DrawAxes" -> True, Mesh -> None]
Out[21]=

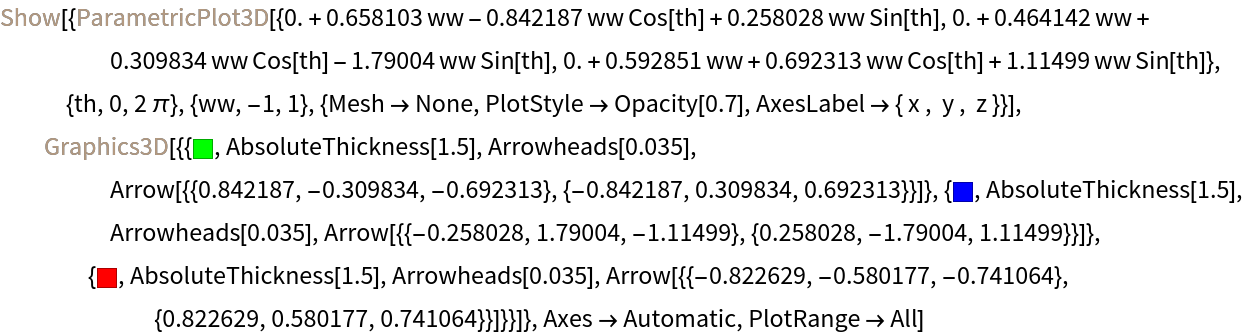
Make several changes to the data, and plot the result (enlarge the arrowheads, make the shafts longer, and change the ranges used to produce the plot):

In[22]:=
Inactive[Show][{Inactive[
     ParametricPlot3D][{0.` + 0.6581030875614606` ww - 0.8421867604887657` ww Cos[th] + 0.2580284538749788` ww Sin[th],
      0.` + 0.464141851342781` ww + 0.3098336655306059` ww Cos[th] - 1.7900415347459084` ww Sin[th], 0.` + 0.5928513034262206` ww + 0.6923134585035524` ww Cos[th] + 1.1149910035170698` ww Sin[th]}, {th, 0, 2 \[Pi]}, {ww, -1, 3}, {Mesh -> None, PlotStyle -> Opacity[0.7`], AxesLabel -> {" x ", " y ", " z "}}], Inactive[
     Graphics3D][{{RGBColor[0, 1, 0], AbsoluteThickness[1.5`], Arrowheads[0.05], Arrow[3 {{0.8421867604887657`, -0.3098336655306059`, -0.6923134585035524`}, {-0.8421867604887657`, 0.3098336655306059`, 0.6923134585035524`}}]}, {RGBColor[0, 0, 1], AbsoluteThickness[1.5`], Arrowheads[0.05], Arrow[3 {{-0.2580284538749788`, 1.7900415347459084`, -1.1149910035170698`}, {0.2580284538749788`, -1.7900415347459084`, 1.1149910035170698`}}]}, {RGBColor[1, 0, 0], AbsoluteThickness[1.5`], Arrowheads[0.05`], Arrow[3 {{-0.8226288594518258`, -0.5801773141784763`, -0.7410641292827758`}, {0.8226288594518258`, 0.5801773141784763`, 0.7410641292827758`}}]}}]}, Axes -> Automatic, PlotRange -> All] // Activate
Out[22]=

Possible Issues (4) 

QuadricSurfacePlot will returned $Failed if the degree of the quadric is more than 2:

In[23]:=
ResourceFunction["QuadricSurfacePlot"][x^3 - y - 1, {x, y, z}]
Out[23]=

QuadricSurfacePlot will returned $Failed if the expression is not a polynomial:

In[24]:=
ResourceFunction["QuadricSurfacePlot"][
 x^2 y - Exp[y] + z - 1, {x, y, z}]
Out[24]=

QuadricSurfacePlot will returned $Failed if there is not the correct number of input variables:

In[25]:=
ResourceFunction["QuadricSurfacePlot"][x^2 + y^2 - x y - 1, {x, y}]
Out[25]=

QuadricSurfacePlot will returned $Failed if the input expression is not a polynomial in the specified variables:

In[26]:=
ResourceFunction["QuadricSurfacePlot"][x^2 + y^2 - x y - 1, {x, u, v}]
Out[26]=

Publisher

Dennis M Schneider

Version History

  • 1.0.0 – 04 October 2019

Related Resources

License Information