Wolfram Function Repository
Instant-use add-on functions for the Wolfram Language
Function Repository Resource:
Create Gantt charts for datasets with project data
ResourceFunction["ProjectDataGanttChart"][ds] plots a Gantt chart for a project dataset ds. |
Create a Gantt chart from a Dataset:
| In[1]:= | ![(* Evaluate this cell to get the example input *) CloudGet["https://www.wolframcloud.com/obj/883f741e-f7bc-4609-b291-415a15c84c27"]](https://www.wolframcloud.com/obj/resourcesystem/images/2b0/2b0e3c48-b353-4196-ae2a-b822774a3d83/22e50f26bdb3de4e.png) |
| Out[1]= | 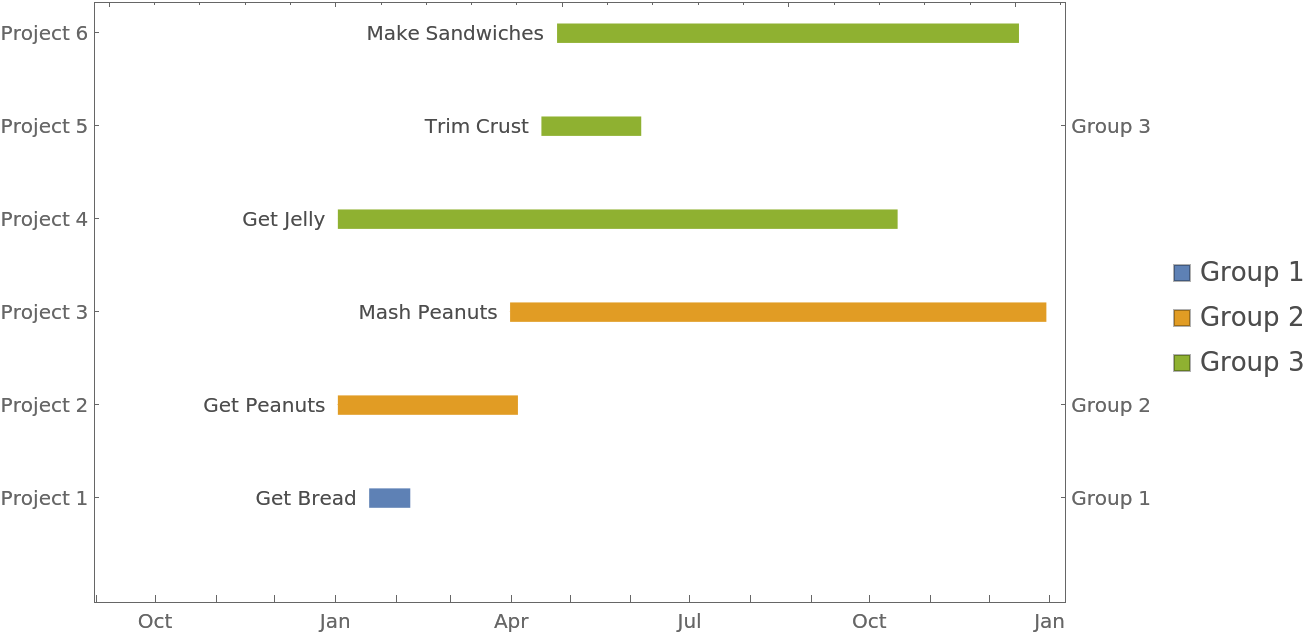 |
Here is a dataset with project data:
| In[2]:= | ![SeedRandom[7];
dsData = ResourceFunction[
"RandomTabularDataset"][{6, {"Group", "Project", "StartDate", "EndDate"}},
"Generators" -> {
"Group " <> ToString[#] & /@ Range[3],
RandomWord,
DateObject[DateList[#][[1 ;; 3]]] & /@ ResourceFunction["RandomDate"][#] &,
DateObject[DateList[#][[1 ;; 3]]] & /@ ResourceFunction["RandomDate"][#] &
}];
dsData = dsData[All, If[#StartDate > #EndDate, Join[#, <|"StartDate" -> #EndDate, "EndDate" -> #StartDate|>], #] &];
dsData[SortBy[{#Group, #StartDate, #EndDate} &]]](https://www.wolframcloud.com/obj/resourcesystem/images/2b0/2b0e3c48-b353-4196-ae2a-b822774a3d83/54c8a8842794e9f7.png) |
| Out[3]= | 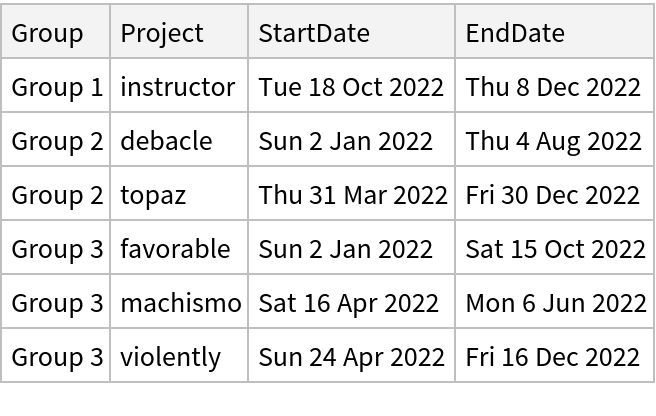 |
Here is the Gantt chart:
| In[4]:= |
| Out[4]= | 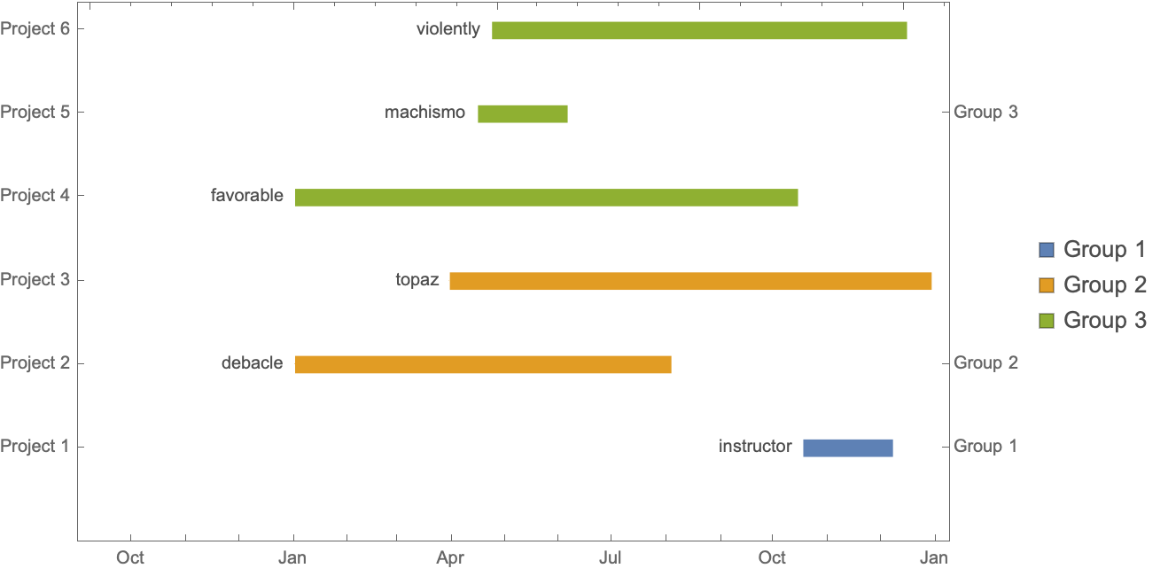 |
Create data without groups:
| In[5]:= | ![SeedRandom[1];
dsData = ResourceFunction[
"RandomTabularDataset"][{4, {"Project", "StartDate", "EndDate"}},
"Generators" -> {
RandomWord,
DateObject[DateList[#][[1 ;; 3]]] & /@ ResourceFunction["RandomDate"][#] &,
DateObject[DateList[#][[1 ;; 3]]] & /@ ResourceFunction["RandomDate"][#] &
}];
dsData = Sort@dsData[All, If[#StartDate > #EndDate, Join[#, <|"StartDate" -> #EndDate, "EndDate" -> #StartDate|>], #] &]](https://www.wolframcloud.com/obj/resourcesystem/images/2b0/2b0e3c48-b353-4196-ae2a-b822774a3d83/088081e484fc3b23.png) |
| Out[7]= | 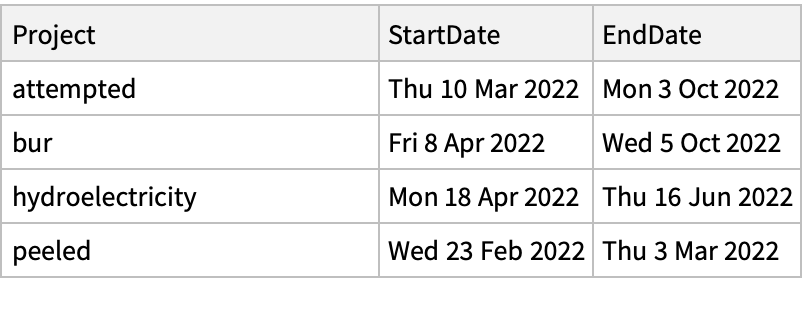 |
Make the Gantt chart:
| In[8]:= |
| Out[8]= |  |
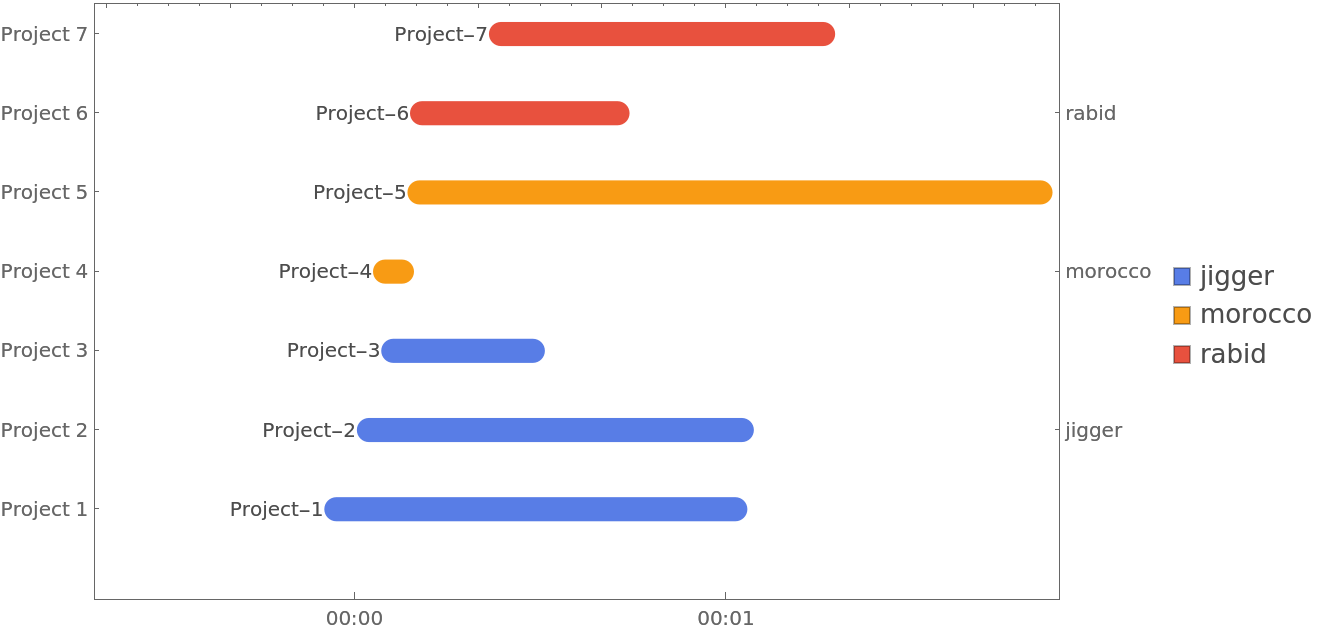
Create data without projects:
| In[9]:= | ![SeedRandom[66];
dsData = ResourceFunction[
"RandomTabularDataset"][{4, {"Group", "StartDate", "EndDate"}},
"Generators" -> {
RandomWord[2],
DateObject[DateList[#][[1 ;; 3]]] & /@ ResourceFunction["RandomDate"][#] &,
DateObject[DateList[#][[1 ;; 3]]] & /@ ResourceFunction["RandomDate"][#] &
}];
dsData = Sort@dsData[All, If[#StartDate > #EndDate, Join[#, <|"StartDate" -> #EndDate, "EndDate" -> #StartDate|>], #] &]](https://www.wolframcloud.com/obj/resourcesystem/images/2b0/2b0e3c48-b353-4196-ae2a-b822774a3d83/744b2295ba9080ee.png) |
| Out[11]= | 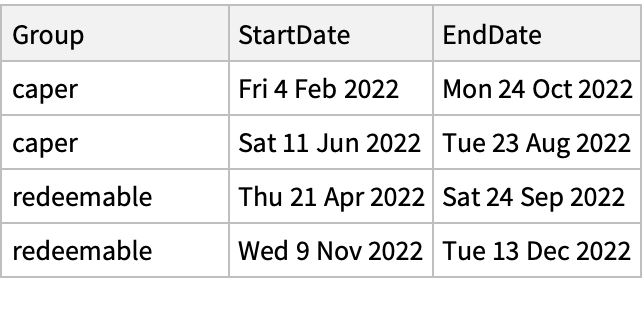 |
Make the Gantt chart:
| In[12]:= |
| Out[12]= |  |
Create data that only includes start and end dates:
| In[13]:= | ![SeedRandom[46];
dsData = ResourceFunction[
"RandomTabularDataset"][{4, {"StartDate", "EndDate"}},
"Generators" -> {
DateObject[DateList[#][[1 ;; 3]]] & /@ ResourceFunction["RandomDate"][#] &,
DateObject[DateList[#][[1 ;; 3]]] & /@ ResourceFunction["RandomDate"][#] &
}];
dsData = Sort@dsData[All, If[#StartDate > #EndDate, Join[#, <|"StartDate" -> #EndDate, "EndDate" -> #StartDate|>], #] &]](https://www.wolframcloud.com/obj/resourcesystem/images/2b0/2b0e3c48-b353-4196-ae2a-b822774a3d83/67219b663ebe8474.png) |
| Out[15]= | 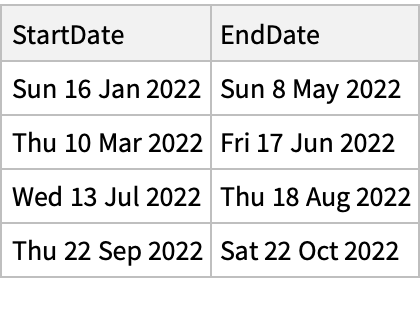 |
Make the Gantt chart:
| In[16]:= |
| Out[16]= | 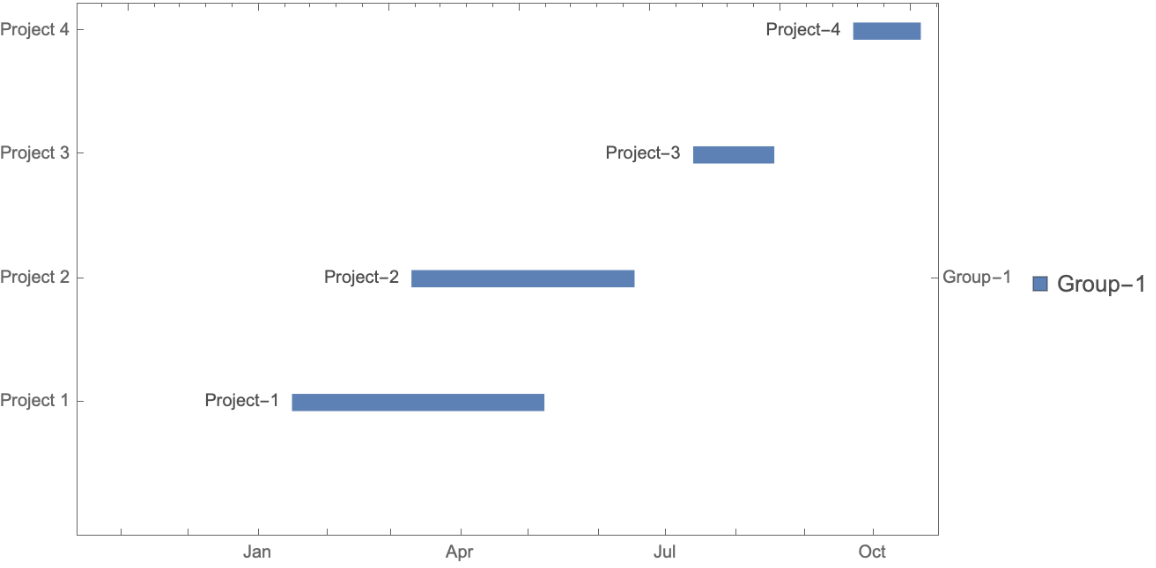 |
Make a random matrix with two columns and plot the Gantt chart for it:
| In[17]:= |
| Out[18]= | 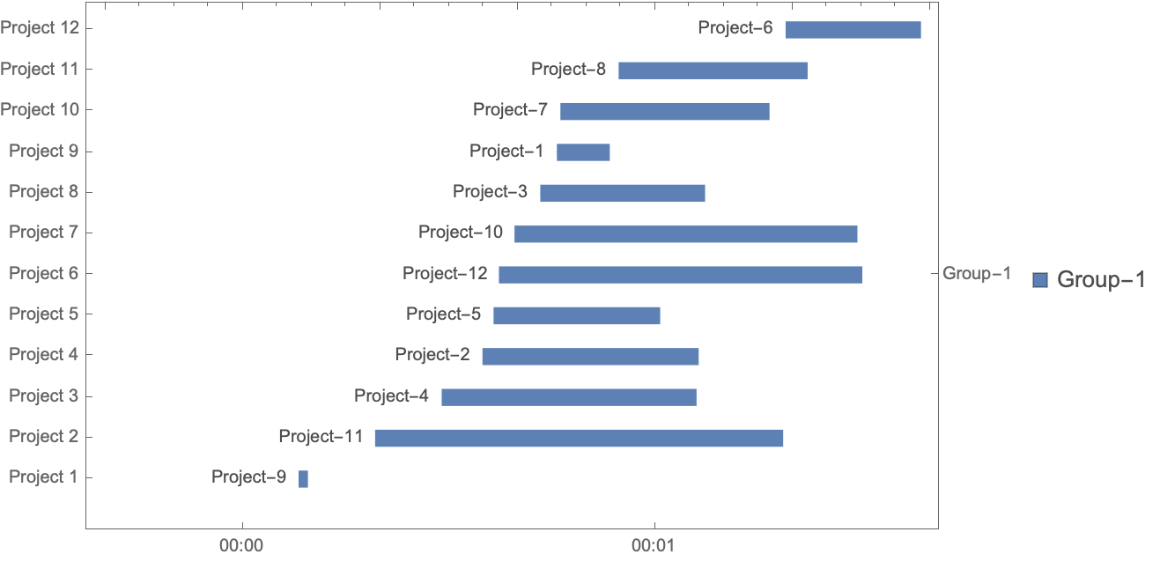 |
Here is a dataset with data for 64 projects:
| In[20]:= | ![SeedRandom[32];
dsData = ResourceFunction[
"RandomTabularDataset"][{64, {"Group", "Project", "StartDate", "EndDate"}},
"Generators" -> {
"Group " <> ToString[#] & /@ Range[8],
RandomWord,
DateObject[DateList[#][[1 ;; 3]]] & /@ ResourceFunction["RandomDate"][#] &,
DateObject[DateList[#][[1 ;; 3]]] & /@ ResourceFunction["RandomDate"][#] &
}];
dsData = dsData[All, If[#StartDate > #EndDate, Join[#, <|"StartDate" -> #EndDate, "EndDate" -> #StartDate|>], #] &];
dsData[SortBy[{#Group, #StartDate, #EndDate} &]];](https://www.wolframcloud.com/obj/resourcesystem/images/2b0/2b0e3c48-b353-4196-ae2a-b822774a3d83/7f90c0915bfb91db.png) |
See a sample of the data:
| In[21]:= |
| Out[22]= | 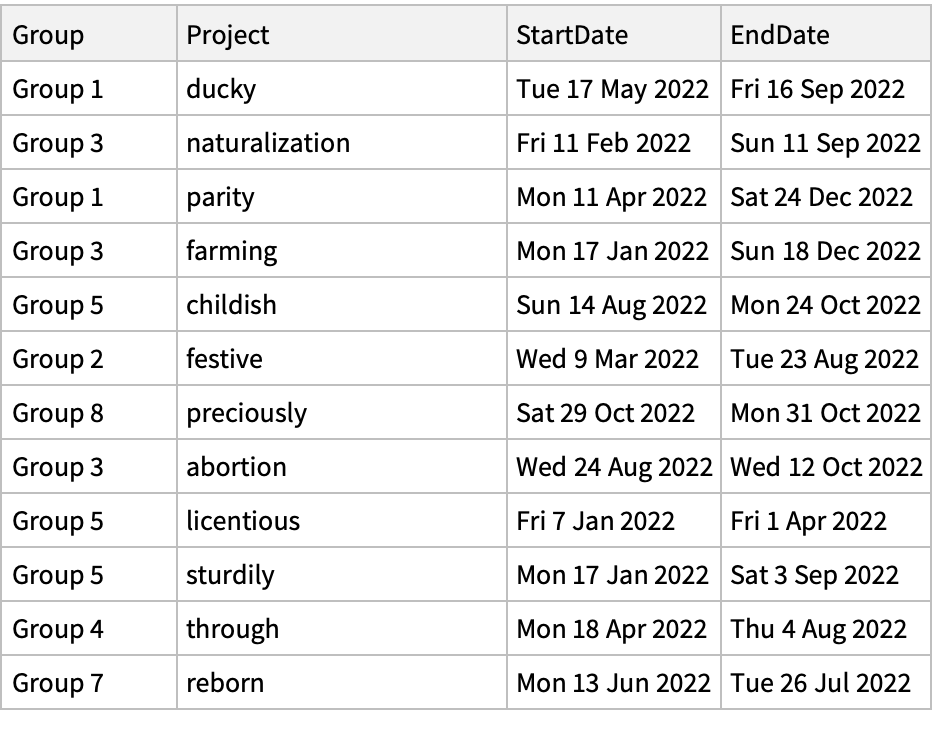 |
Here is the corresponding Gantt chart:
| In[23]:= |
| Out[23]= | 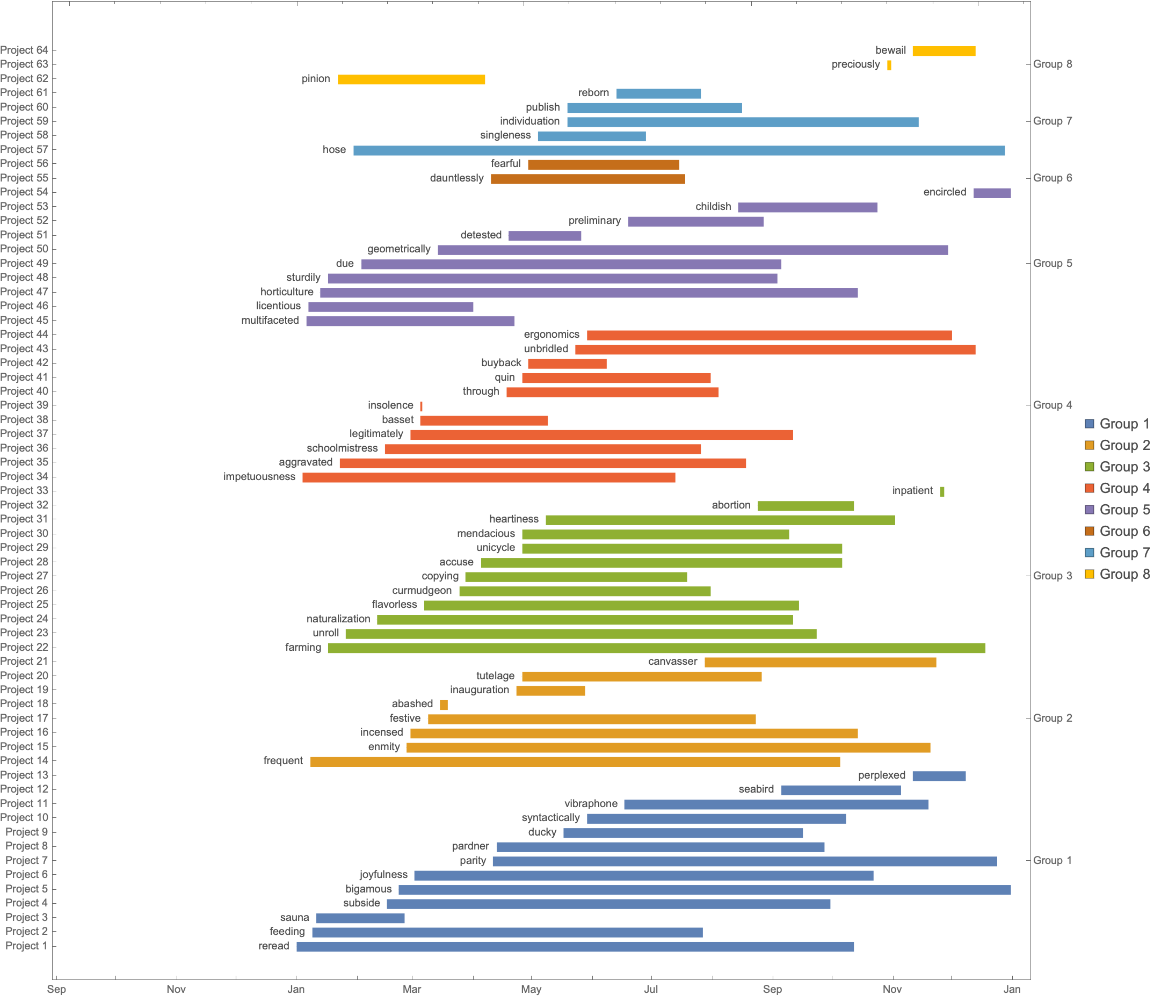 |
This work is licensed under a Creative Commons Attribution 4.0 International License
![(* Evaluate this cell to get the example input *) CloudGet["https://www.wolframcloud.com/obj/100de267-cb1f-4af3-8c81-48724c5f5c60"]](https://www.wolframcloud.com/obj/resourcesystem/images/2b0/2b0e3c48-b353-4196-ae2a-b822774a3d83/648e1e6aaf269cb0.png)