Wolfram Function Repository
Instant-use add-on functions for the Wolfram Language
Function Repository Resource:
Generate the power diagram of a set of circles
ResourceFunction["PowerDiagram"][{c1,c2,…}] gives a MeshRegion representing the power diagram of the circles c1,c2, …. | |
ResourceFunction["PowerDiagram"][{c1,c2,…},{{xmin,xmax},…}] clips the mesh to the bounds [xmin,xmax]×⋯. |
Generate the power diagram of a set of circles:
| In[1]:= |
| Out[1]= | 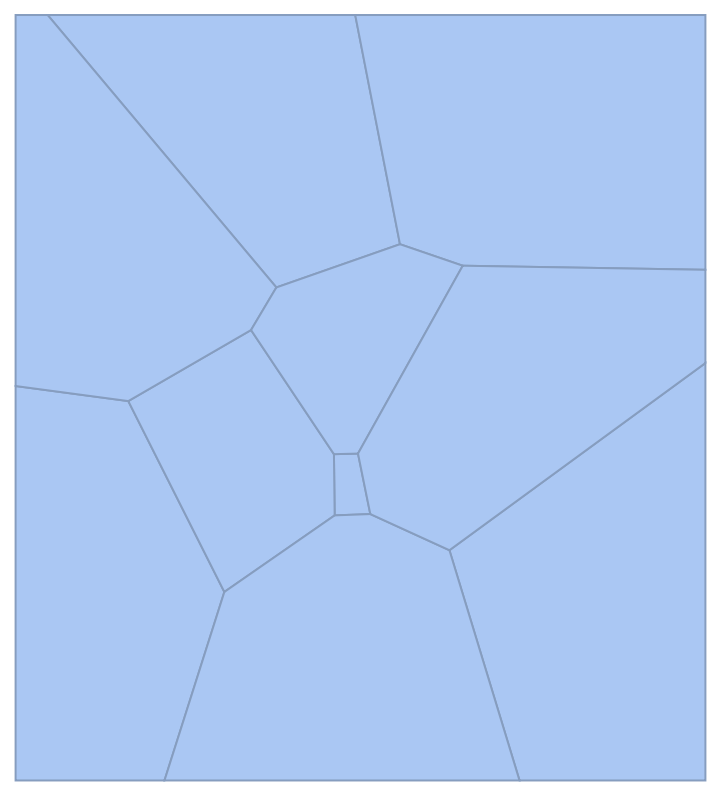 |
Show the power diagram with the generating circles:
| In[2]:= |
| Out[2]= | 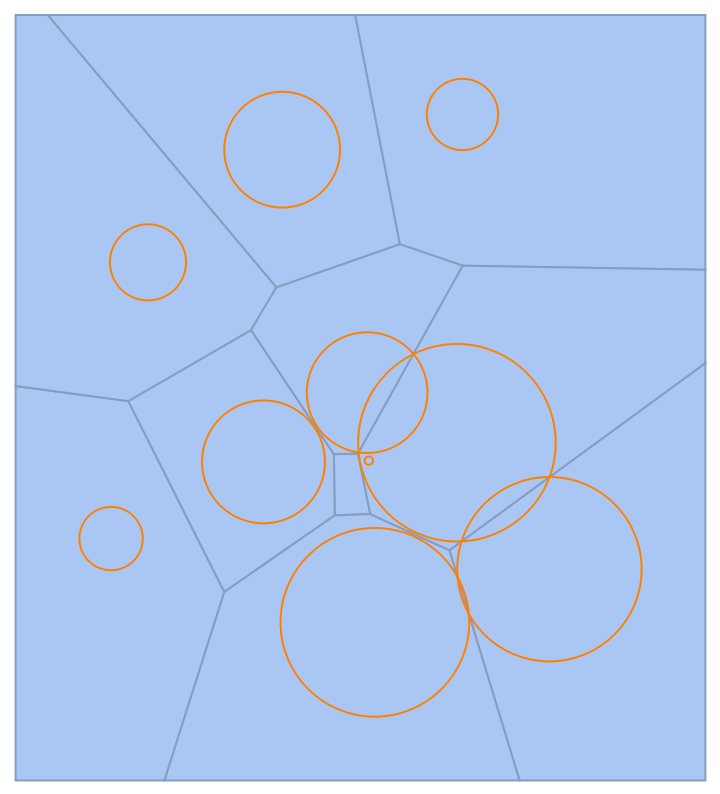 |
Create a power diagram from a set of disks:
| In[3]:= |
| Out[3]= | 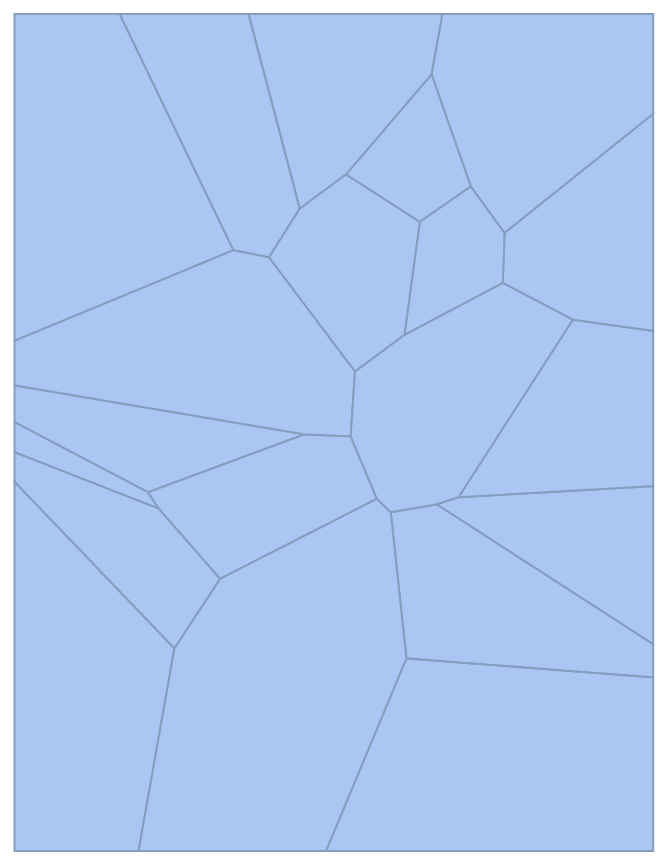 |
Basic properties:
| In[4]:= |
| Out[4]= |
Power diagrams are full dimensional:
| In[5]:= |
| Out[5]= |
Power diagrams are bounded by their clipping values:
| In[6]:= |
| Out[6]= |
Generate the power diagram of a mixture of Circle and Disk objects:
| In[7]:= | ![cl = Table[
RandomChoice[{Circle, Disk}][
RandomVariate[NormalDistribution[], 2], RandomReal[{0, 1/2}]], {10}];
ResourceFunction["PowerDiagram"][cl]](https://www.wolframcloud.com/obj/resourcesystem/images/a84/a8461ba6-2be8-4c61-afdd-6da8273806c7/25add84108f4849c.png) |
| Out[7]= | 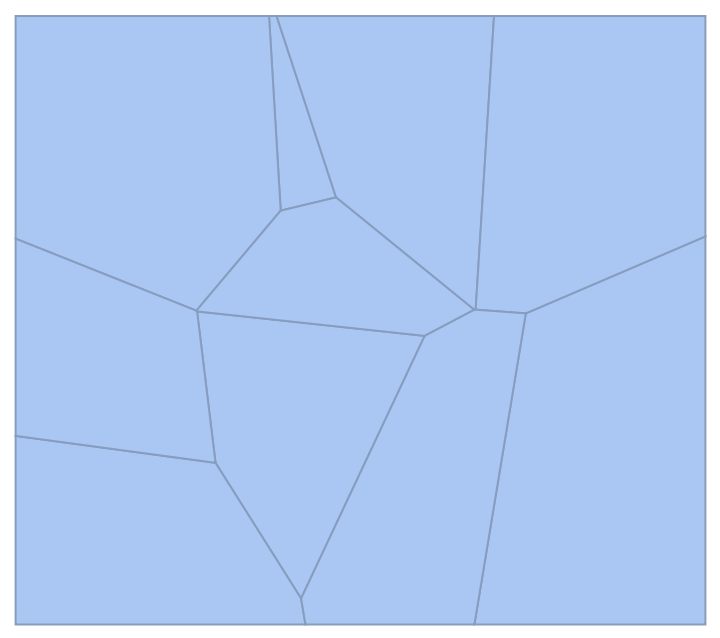 |
MeshCellHighlight allows you to specify highlighting for parts of a PowerDiagram:
| In[8]:= |
| Out[8]= | 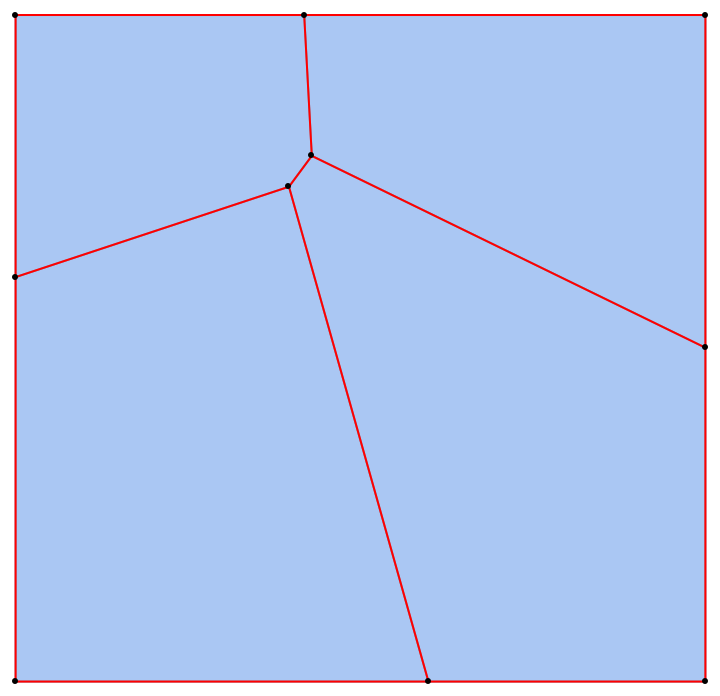 |
Individual cells can be highlighted using their cell index:
| In[9]:= |
| Out[9]= | 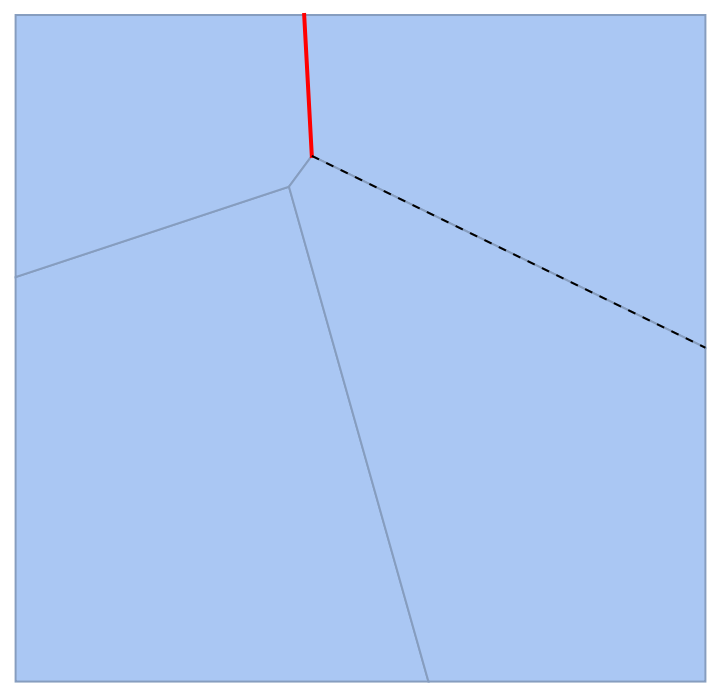 |
Or by the cell itself:
| In[10]:= |
| Out[10]= | 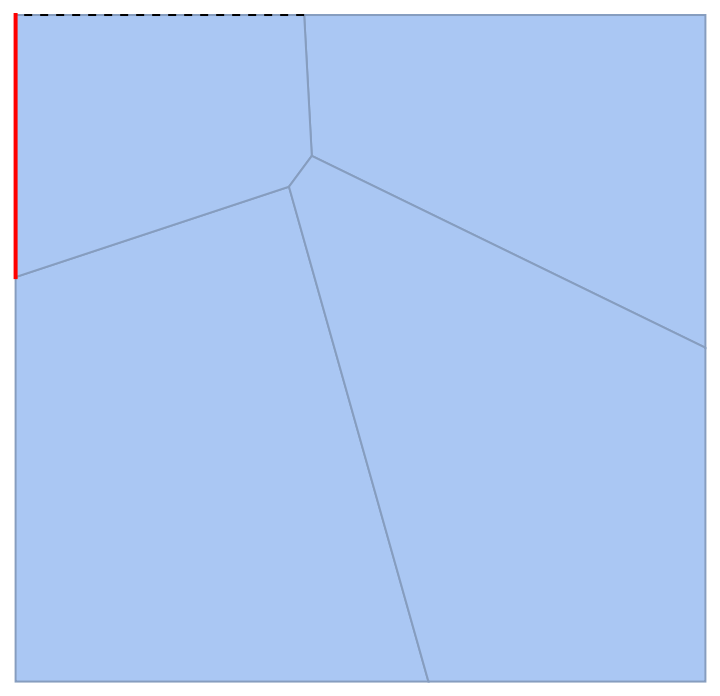 |
MeshCellLabel can be used to label parts of a PowerDiagram:
| In[11]:= |
| Out[11]= | 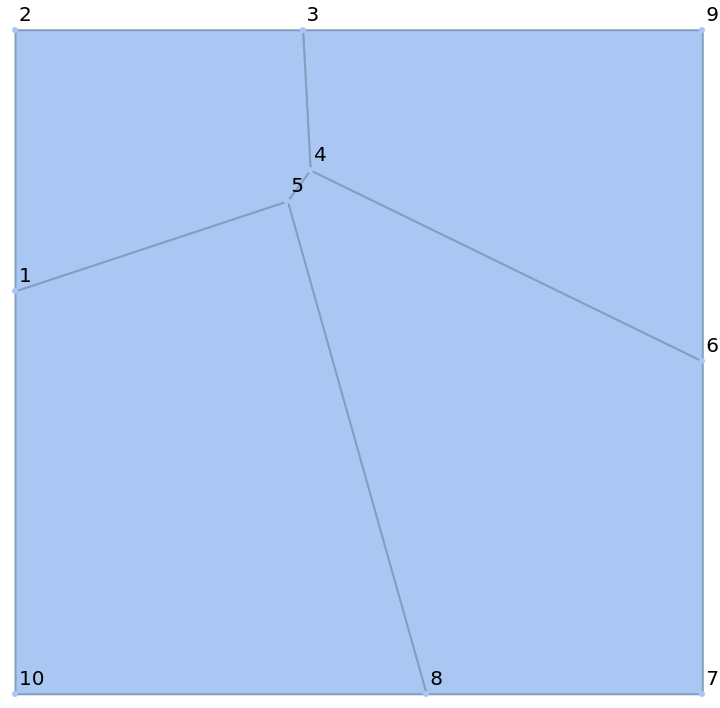 |
Individual cells can be labeled using their cell index:
| In[12]:= |
| Out[12]= | 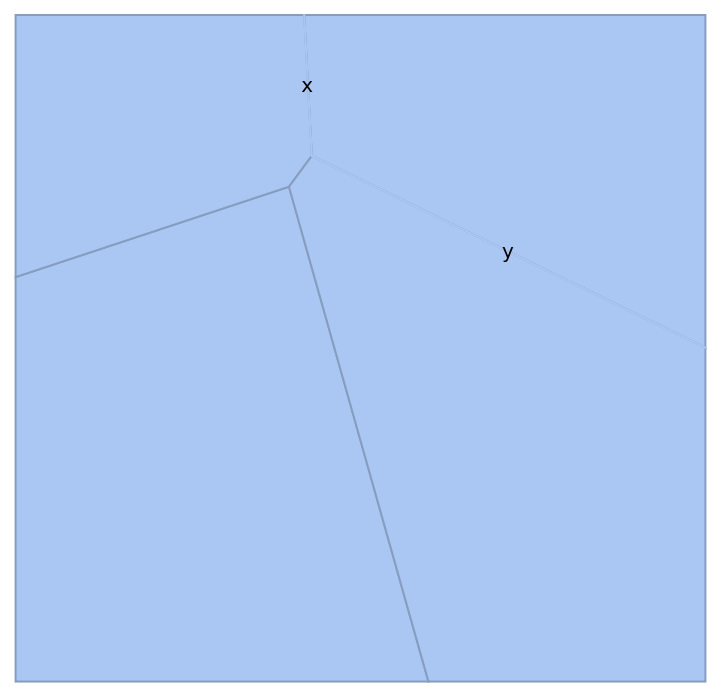 |
Or by the cell itself:
| In[13]:= |
| Out[13]= | 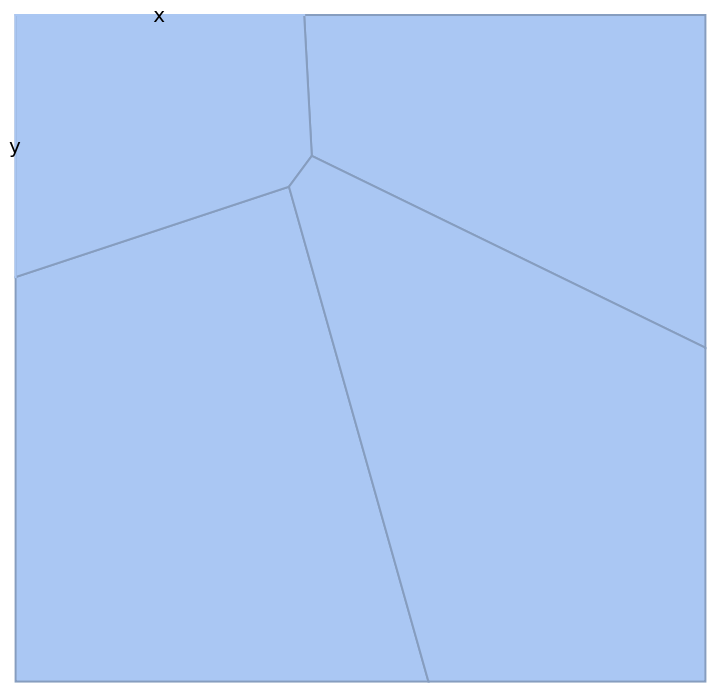 |
MeshCellMarker can be used to assign values to parts of a PowerDiagram:
| In[14]:= |
| Out[14]= | 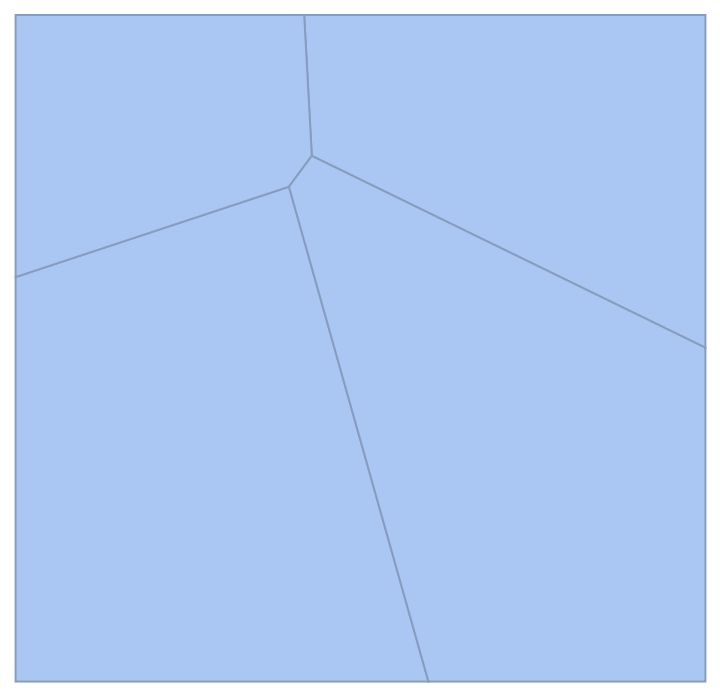 |
Use MeshCellLabel to show the markers:
| In[15]:= | ![ResourceFunction["PowerDiagram"][
Table[Disk[RandomReal[1, 2], RandomReal[]], {5}], MeshCellMarker -> {{0, 1} -> 1, {0, 2} -> 2, {0, 3} -> 3, {0, 4} -> 4, {0, 5} -> 5}, MeshCellLabel -> {0 -> "Marker"}]](https://www.wolframcloud.com/obj/resourcesystem/images/a84/a8461ba6-2be8-4c61-afdd-6da8273806c7/744d89c23532ef81.png) |
| Out[15]= |  |
MeshCellStyle allows you to specify styling for parts of a PowerDiagram:
| In[16]:= |
| Out[16]= |  |
Individual cells can be highlighted using their cell index:
| In[17]:= |
| Out[17]= | 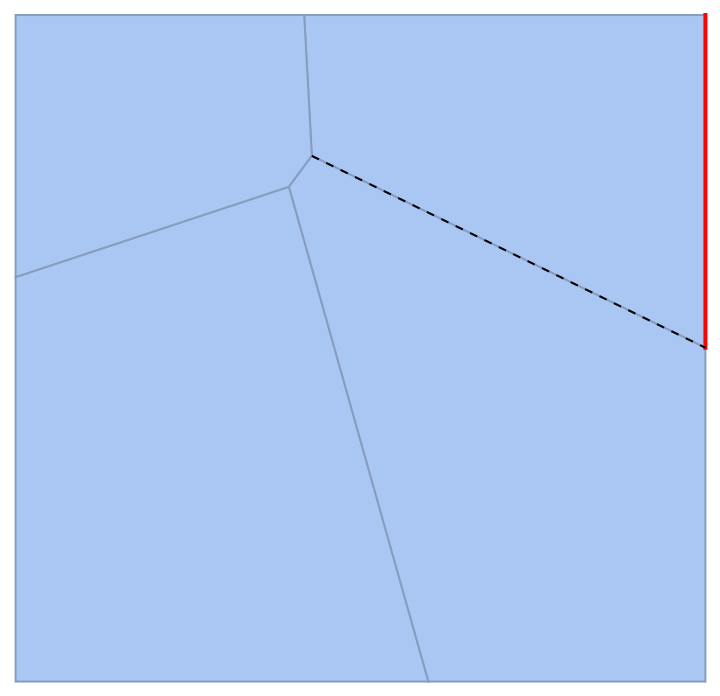 |
Or by the cell itself:
| In[18]:= |
| Out[18]= | 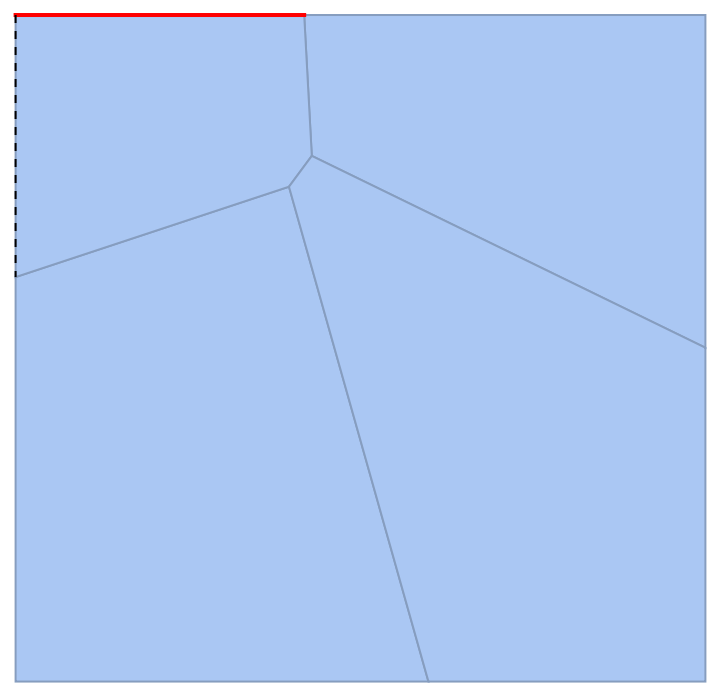 |
Use a theme with grid lines and a legend:
| In[19]:= |
| Out[19]= | 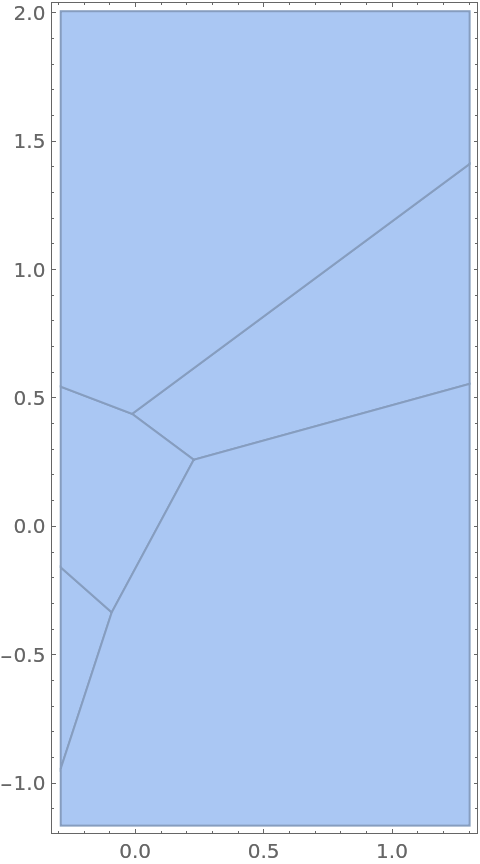 |
Use a theme to draw a wireframe:
| In[20]:= |
| Out[20]= | 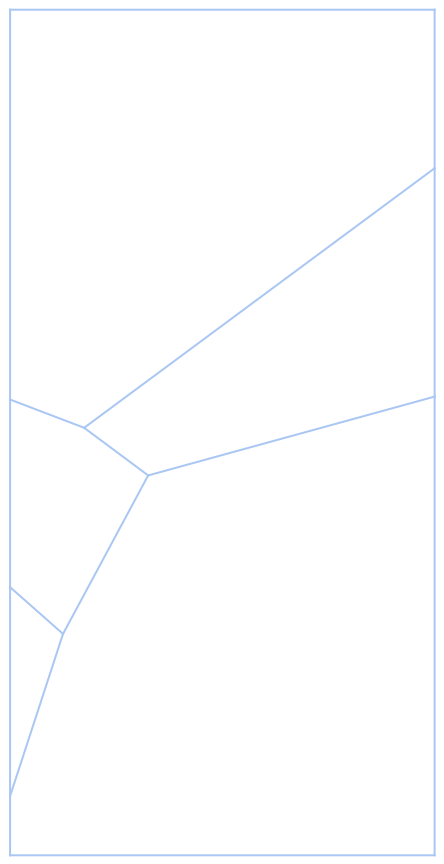 |
The output of PowerDiagram is always a full-dimensional MeshRegion:
| In[21]:= |
| Out[21]= |  |
| In[22]:= |
| Out[22]= |
The power diagram of two circles is composed of two half-planes divided by the radical line of the two circles:
| In[23]:= | ![radicalLine[Circle[c1_, r1_], Circle[c2_, r2_]] := With[{u = 1/2 (1 + (r1^2 - r2^2)/SquaredEuclideanDistance[c1, c2])}, InfiniteLine[(1 - u) c1 + u c2, Cross[c2 - c1]]]
Show[ResourceFunction[
"PowerDiagram"][{Circle[{0, 0}, 1], Circle[{2, 2}, 1/3]}], Graphics[{Brown, Circle[{0, 0}, 1], Circle[{2, 2}, 1/3], Directive[Dashed, Orange], radicalLine[Circle[{0, 0}, 1], Circle[{2, 2}, 1/3]]}]]](https://www.wolframcloud.com/obj/resourcesystem/images/a84/a8461ba6-2be8-4c61-afdd-6da8273806c7/635ae2b04353edaa.png) |
| Out[23]= | 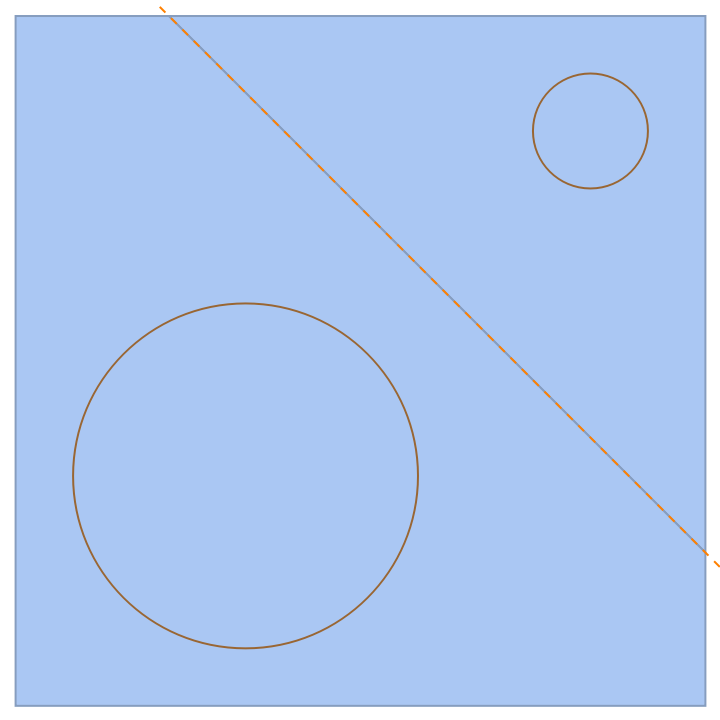 |
If one circle encloses the other, the cell corresponding to the inner circle is empty:
| In[24]:= | ![Show[ResourceFunction[
"PowerDiagram"][{Circle[{0, 0}, 1], Circle[{2/5, 1/2}, 1/6]}, {{-3/2, 3/2}, {-3/2, 3/2}}], Graphics[{Brown, Circle[{0, 0}, 1], Circle[{2/5, 1/2}, 1/6], Directive[Dashed, Orange], radicalLine[Circle[{0, 0}, 1], Circle[{2/5, 1/2}, 1/6]]}]]](https://www.wolframcloud.com/obj/resourcesystem/images/a84/a8461ba6-2be8-4c61-afdd-6da8273806c7/365298dbf5d90156.png) |
| Out[24]= | 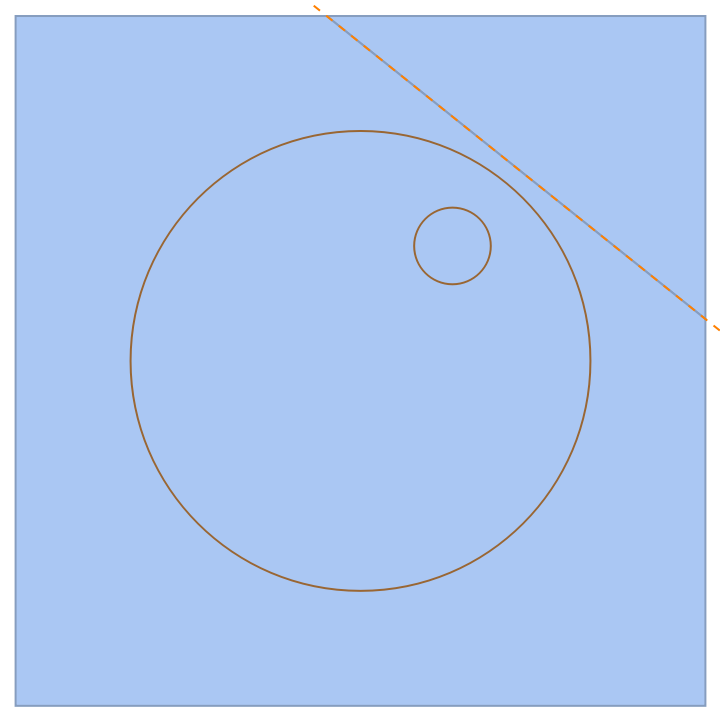 |
The power diagram of a set of circles all having the same radii is equivalent to the VoronoiMesh of the circles' centers:
| In[25]:= | ![circles = Table[Circle[RandomVariate[NormalDistribution[], 2], 0.2], {10}];
GraphicsRow[{ResourceFunction["PowerDiagram"][circles], VoronoiMesh[First /@ circles]}]](https://www.wolframcloud.com/obj/resourcesystem/images/a84/a8461ba6-2be8-4c61-afdd-6da8273806c7/3d34f8ca86fb94f2.png) |
| Out[25]= | 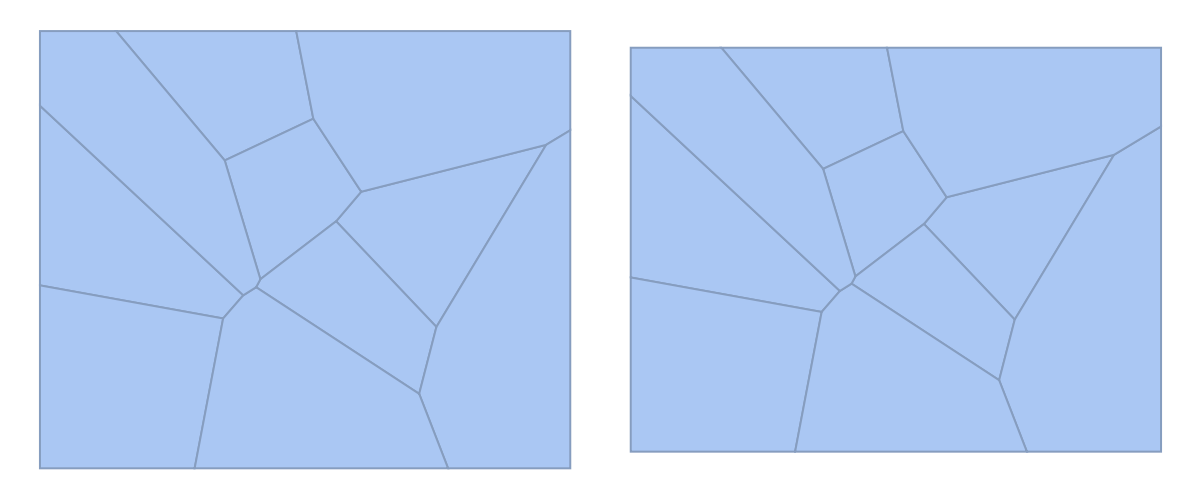 |
The resource function PowerTriangulation is the dual of PowerDiagram:
| In[26]:= | ![circles = Table[Circle[RandomReal[{-7/2, 7/2}, 2], RandomReal[1/3]], {30}];
pt = HighlightMesh[
ResourceFunction["PowerTriangulation"][circles], {Style[0, Black], Style[1, Orange], Style[2, Opacity[0.5]]}];
pd = HighlightMesh[
ResourceFunction["PowerDiagram"][circles], {Style[1, Green], Style[2, Opacity[0.2]]}];
Show[pt, pd, Graphics[{Brown, circles}]]](https://www.wolframcloud.com/obj/resourcesystem/images/a84/a8461ba6-2be8-4c61-afdd-6da8273806c7/7363100618433599.png) |
| Out[29]= | 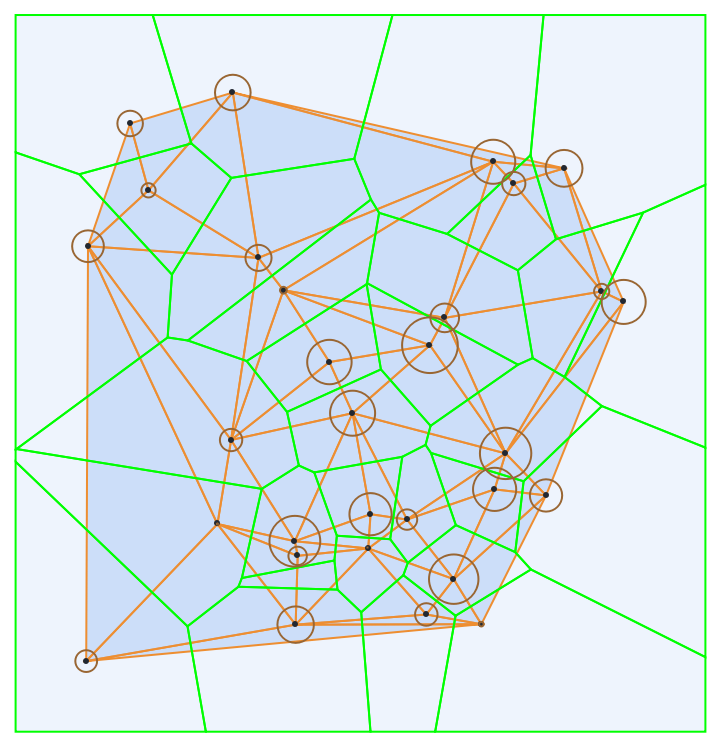 |
This work is licensed under a Creative Commons Attribution 4.0 International License