Details and Options
ResourceFunction["PlotGrid"] enables the creation of plots with shared frame ticks.
In
ResourceFunction["PlotGrid"][{[plt1,1,…},…}], the
plti,j can be
Graphics expressions or
Legended graphics expressions.
The
plti,j can also be
Null or
None, in which case the corresponding grid space is left empty.
ResourceFunction["PlotGrid"] automatically hides frame ticks and labels on shared edges.
The graphics returned by ResourceFunction["PlotGrid"] is freely resizable, with all plots scaling appropriately.
ResourceFunction["PlotGrid"] accepts the same options as
Graphics, with the following additions and changes:
In addition to all standard settings, the following settings can be given for
AspectRatio:
| Automatic | automatic value based on the ItemSize setting and aspect ratios of invididual plots |
| GeometricMean | use the geometric mean of all aspect ratios as AspectRatio |
| Mean | use the arithmetic mean of all aspect ratios as AspectRatio |
| {{i1,j1}→spec1,…} | ensure that the plots at position i1,j1 has the AspectRatio specified by spec1 |
| {gridSpec,{i1,j1}→spec1,…} | target the AspectRatio specified by gridSpec for the entire plot grid |
With the default setting
AspectRatio→Automatic, multiplying the
ItemSize specifications for one dimension by a number scales the aspect ratio by the same amount.
Settings of the form
AspectRatio→{…,{ik,jk}→speck,…} effectively forces the plot at position
ik,jk to have a certain aspect ratio.
In
AspectRatio→{…,{ik,jk}→speck,…}, the
speck can be any of the following:
In
AspectRatio→{…,{ik,jk}→speck,…}, the position specifications
{ik,jk} can be any of the following:
| {ik,jk} | the plot at position ik,jk |
| All | use the setting for all plots |
| Automatic | use the setting for as many plots as possible |
Due to technical limitations, settings of the form
AspectRatio→{…,{ik,jk}→speck,…} are only supported if neither the
ItemSize nor the
Spacings settings contain any specifications in printers points.
Given a setting
AspectRatio→{…,{ik,jk}→speck,…},
ResourceFunction["PlotGrid"] attempts to fulfill the constraints by varying the aspect ratio of the entire grid, as well as the dimensions of rows/columns with
ItemSize set to
Automatic.
Not all settings for
AspectRatio can be realized. In particular, specifying the
AspectRatio for too many individual plots or the
ItemSize for too many rows/columns may result in an overconstrained problem without any solutions.
Adding a specification of the form
Automatic→spec to the setting for
AspectRatio will never result in an overconstrained problem.
The labels specified by
FrameLabel are drawn outside potential frame labels of the inner plots.
With the default setting
FrameStyle→Automatic, the style is inherited from the first plot of the grid.
For
ItemSize, the following settings can be given for an individual row/column:
| Automatic | use an automatically determined size |
| size | use the specified size relative to other rows/columns |
| Scaled | size item relative to the plot range |
| ImageScaled | size item relative to the image size |
| Scaled[s] | size by plot range, scaled by a factor s |
| ImageScaled[s] | size by image size, scaled by a factor s |
| Offset[size] | size in printers points |
| Offset[offset,spec] | add offset printers points to the size specified by spec |
Specifying n for one item and 1 for the remaining ones causes it to be n times as big as the rest.
When different types of scalings, e.g.
Scaled and
ImageScaled[2], are mixed,
ResourceFunction["PlotGrid"] effectively tries to convert all specifications to pure size specifications with reasonable conversion factors.
At least one row and one column must use a relative
ItemSize setting.
Reference sizes for
Scaled and
ImageScaled type specifications are only computed from non-spanning plots and can therefore not be used for rows/columns where every plot is spanning.
For
Spacings, the following settings can be given for an individual gap between rows/columns:
| size | size in printers points |
| Scaled[s] | fraction s of the plot grid width |
The options
ItemSize and
Spacings support the full range of sequence specifications described in the respective documentation pages.
The setting for
PlotRange controls the horizontal plot ranges per column and the vertical plots ranges per row.
For each row/column, the following settings can be given for
PlotRange:
| Inherited | do not adjust the plot range of the individual plots |
| Max | use a plot range containing all individual ranges within the row/column |
| Min | use a plot range contained within all individual ranges within the row/column |
| spec | use a standard PlotRange setting |
| {lower,uppper} | use separate settings for the lower and upper bounds |
The setting
Min sets the plot range of all plots in a row/column to the largest range contained within all plot ranges of the individual plots. Similarly, the setting
Max sets the plot range to the smallest range containing all individual ranges.
With the default setting
PlotRange→Inherited, the plot ranges of all plots will be left unchanged.
A common setting is
PlotRange→Max, which ensures that the vertical/horizontal plot ranges of all plots within each row/column are consistent and that all data are shown.
The option
PlotRange supports the same specifications to specify individual rows/columns as described in the documentation of
ItemSize.
For
PlotLabels, the following settings can be given:
| None | add no labels |
| spec | use the same specification for all plots |
| {spec1,…} | use different specifications for each plot |
| {{spec1,1,…},…} | use several labels for a plot |
| {{{spec1,1,1,…},…},…} | use several top-level label lists |
| Placed[{…},pos] | place labels at the specified position |
In
PlotLabels→spec,
Placed wrappers can be placed at any level to specify label positioning, with the innermost specification taking precedence.
The form
PlotLabels→ {{{spec1,1,1,…},…},…} is useful in the form
PlotLabels→{spec,{{spec1,1,1,…},…}}, where
spec is applied to all plots, and the
speci,j,k are applied to individual plots
plotj.
In case of ambiguity, label specifications given as nested lists are interpreted as several labels per plot instead of multiple top-level label lists. To ensure the specification is interpreted differently, an empty specification of the form
{{}} can be added, as in
PlotLabels→{spec,{spec1,1,…},{{}}}.
In
PlotLabels, the following settings can be given for an individual label specification:
| Column→format | automatically number plot based on format, with plots ordered by columns |
| Row→format | number plots ordered by rows |
| lbl | use lbl as label |
| Placed[spec,pos] | place label at the specified position |
In
type→format type
PlotLabels specifications, the format can be a string or wrapped string, where the first letter/number is replaced by the corresponding number for each plot based on the following table:
| a | number plots using a, b, c, … |
| A | number plots using A, B, C, … |
| i | number plots using i, ii, iii, … |
| I | number plots using I, II, III, … |
| 1 | number plots using 1, 2, 3, … |
The position in
Placed[spec,pos] type
PlotLabels specifications supports similar settings as used by
PlotLegends placement; in particular, the following settings can be used:
| Left,Above,… | symbolic specifications |
| {x,y} | explicit settings for horizontal and vertical positioning |
| ImageScaled[{x,y}] | numeric position which does not try to avoid the frame of the plots |
| Offset[{dx,dy},spec] | position offset by the specified number of printers points |
For numeric position specifications, values below 0 are left of/below the plot, values above 1 are right of/above the plot, and values in between are inside the plot frame.
If no position is specified for a label,
{Left,Top} is used as default.
By default, label placement tries to avoid the frame of the plot, placing labels either inside the plot range or outside the frame. Using
ImageScaled[pos] type coordinates overrides this behavior.
Labels can also be specified for individual plots using
Labeled wrappers of the form
Labeled[plot,lbl,…].
| Automatic | automatically combine labels vertically or horizontally |
| func | use func to arrange labels |
| (Automatic→func) | wrap the arranged labels with func |
In
LabelingFunction→func,
func is called with a list of all labels for each position.
In
LabelingFunction→(Automatic→func),
func is called with a single row/column construct that contains all labels for a given position.
In the setting for
Prolog and
Epilog,
{i,j}→pos can be used for any of the coordinates to indicate that the position
pos is to be interpreted in the coordinate system of the plot with index
{i,j}. This enables the creation of annotations linking positions of different plots.
Position specifications of the form
{i,j}→pos in
Prolog and
Epilog support any of the standard position specifications for
pos, such as
{x,y},
Scaled[…],
ImageScaled[…],
Offset[…], and any mixture of those.
In the setting for
Prolog and
Epilog, "normal" position specifications are taken to be in the coordinate system of the plot grid itself, with runs from 0 to 1 on both axes. This range excludes the outer frame labels.
For "ShowFrameLabels", the following settings can be given for an individual plot:
| Automatic | show frame labels if there is no adjacent plot |
| Full | show frame labels if there is a gap or no adjacent plot |
| All or True | show all frame labels |
| None or False | show no frame labels |
| {hspec,vspec} | use separate settings for the horizontal and vertical frame edges |
| {{left,right},{bottom,top}} | use different settings for each side |
| {side1→spec1,…} | use the specified setting for the specified side |
| {def,side1→spec1,…} | use def for sides where no explicit value is given |
The option
"ShowFrameLabels" supports the same specifications to specify individual items as described in the documentation of
ItemStyle.
In the setting for
"ShowFrameLabels",
Directive can be used instead of
List to indicate that a specification should be interpreted as one instead of a sequence for different items.
With the default setting
"ShowFrameLabels"→Full, labels are hidden for grids with merged axes, but stay visible for layouts with spacing between the plots.
The options
"HideOuterTickLabels" and
"MergeAxes" operate on the boundaries between rows/columns of plots and support the same sequence specifications as described for
Spacings.
For each pair of neighboring rows/columns, the following settings can be given for "HideOuterTickLabels":
| sideSpec | Automatic | which sides the hiding should be applied to |
| methodSpec | Full | when to apply the hiding based on the existence of neighboring plots and spacings |
| threshold | Automatic | up to which distance from the edge to hide individual tick labels |
| {sideSpec,methodSpec,threshold} | {Automatic,Full,Automatic} | specify values for all three parts of the setting |
In {sideSpec,methodSpec,threshold}, any subset of the settings can be omitted, e.g. {sideSpec,threshold} or {methodSpec} are both valid.
The hiding strategy for "HideOuterTickLabels" consists of three steps: In each pair of neighboring rows/columns, decide to which side(s) (if any) to apply the hiding based on sideSpec. Look whether there is a neighboring plot or spacing, and decide whether still to hide tick labels based on methodSpec. Use threshold to hide the tick labels that are too close to the edge.
In "HideOuterTickLabels"→{sideSpec,…}, the following settings can be given for sideSpec:
| Automatic | hide the tick labels on the bottom/left plots |
| First | hide the tick labels on the plots that appear first in the grid |
| Last | hide the tick labels on the plots that appear last in the grid |
| All or True | hide on both sides |
| None or False | hide none of the labels |
In "HideOuterTickLabels"→{…,methodSpec,…}, the following settings can be given for methodSpec:
| Automatic | apply hiding everywhere there is a neighboring plot |
| Full | apply hiding only if there is a neighboring plot with no spacing |
| All or True | apply hiding to all sides |
| None or False | do not apply hiding to any side |
In "HideOuterTickLabels"→{…,threshold}, the following settings can be given for threshold:
| Automatic | automatically choose threshold |
| thres | a distance threshold in printers points |
| Scaled[thres] | a distance threshold as a fraction of the plot range |
The default setting
"HideOuterTickLabels"→Full is equivalent to specifying
{Automatic,Full,Automatic} and hides the tick labels of directly adjacent plots (on the left/bottom plot, respectively) if they are closer than 10 printers points from the edge, assuming
PerformanceGoal→"Quality" is set.
The distance check for thresholds given in printers points is made assuming the initial size of the grid and may not be accurate if the grid is resized afterwards.
In case of ambiguity, settings are always interpreted as
methodSpec first instead of
sideSpec. This means that
"HideOuterTickLabels"→All is equivalent to
{Automatic,All,Automatic}, and not
{All,Full,Automatic}.
For each pair of neighboring rows/columns, the following settings can be given for "MergeAxes":
| False | do not merge the axes |
| "type" | use a named merge indicator |
| "type"→size | use the specified size for the merge indicator |
| {expr1,expr2} | use the specified expression as merge indicators on either size of the gap |
| {expr,Automatic} | use a rotated version of one expression for both sides |
| expr | use a single expression |
| {spec,width} | specify the width of the indicator in printers points |
| Style[spec,style1,…] | apply a custom style to the merge indicators |
| None | draw no extra primitives |
The following named merge indicators are supported:
| "ZigZag" |  |
| "Cut" |  |
| "Wave" |  |
| "Dotted" |  |
| "Line" |  |
In "type"→size, the size specifies the length of the feature (e.g. the length of the dashed line) of the indicator in printers points. The default size is 10 printers points.
The merge indicator inherits the style from the frames of the two plots, with each half inheriting the style of the respective plot. For
expr type specifications, the style of the left/top plot is inherited. Custom styles specified via
Style[spec,style1,…] take precedence over these inherited styles.
In general, any expression can be used as merge indicator. For proper alignment, a
Graphics expression should be used, with the
{0,0} point at the point where the primitive connects to the frame. To ensure sizing works as expected,
AspectRatio→Full should be set. The indicator will be sized to span the entire gap, so most indicators should only fill half of the plot range.
Due to antialiasing, the alignment of the merge indicators might not be perfect for all sizes of the resulting plot grid. Resizing it slightly will fix the issue in those cases.
In the settings for
"HideOuterTickLabels" and
"MergeAxes",
Directive can be used instead of
List to indicate that a specification should be interpreted as one instead of a sequence for different items.
For
AspectRatio, "ShowFrameLabels", "HideOuterTickLabels" and "MergeAxes", settings can be specified on a per-plot basis using
Frame[plot,opts] type wrappers, e.g.
Frame[plot,"ShowFrameLabels"→None].
| "Quality" | favor high-quality results over fast-to-render ones |
| "Speed" | reduce number of custom frame ticks to improve performance, especially while resizing |
The setting of
PerformanceGoal affects the defaults of the
"HideOuterTickLabels" threshold and of the
"AllCustomTicks" Method suboption.
The following
Method suboptions can be given:
| "FixFrameTicks" | True | whether to attempt to fix the length of custom ticks |
| "AllCustomTicks" | Automatic | whether to use custom ticks for all frame ticks |
With the default setting
"FixFrameTicks"→True, the tick lengths of custom tick specifications are rescaled to work around a bug caused by using
AspectRatio→Full with custom ticks.
The workaround used by
"FixFrameTicks"→True estimates the effective aspect ratio of the plots, and may therefore result in suboptimal results if the grid is significantly resized after creation.
The setting
"AllCustomTicks" can be used to control whether a custom tick function should be used for all sides that are set to
Automatic,
True or
All to ensure a more uniform result. This might be necessary since the ticks generated by those settings cannot be fully reproduced in all cases.
The default setting
"AllCustomTicks"→Automatic uses custom ticks only in the event that any default tick specification already needed to be replaced, e.g. to hide the outer tick labels, and only if
PerformanceGoal→"Quality" is set.
ResourceFunction["PlotGrid"] returns a
Graphics expression or a
Legended graphics expression.
ResourceFunction["PlotGrid"] will move all legends that are outside of the individual plots to the outside of the entire grid, while leaving those inside in place.
ResourceFunction["PlotGrid"] sets
CoordinatesToolOptions to enable extraction of coordinates from any of the plots. The format of the points is
{{i,j},{x,y}}, where
i,j are the indices of the plot and
x,y the coordinates in the coordinate system of the plot. (this does not work in version 12.3, where the tool is disabled to prevent a front-end crash)
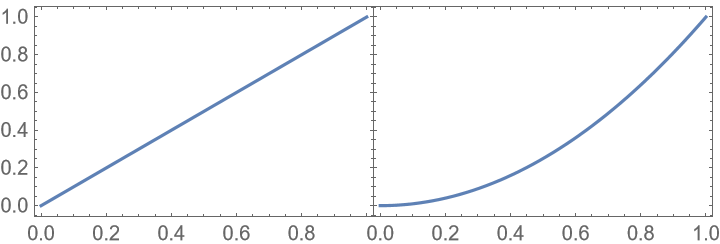
![ResourceFunction["PlotGrid"][
{
{
Plot[x, {x, 0, 1}, Frame -> True],
Plot[x^2, {x, 0, 1}, Frame -> True]
}
}
]](https://www.wolframcloud.com/obj/resourcesystem/images/2ee/2ee44ba7-10c5-4a2b-acc2-773011f57547/63219189a62c7377.png)
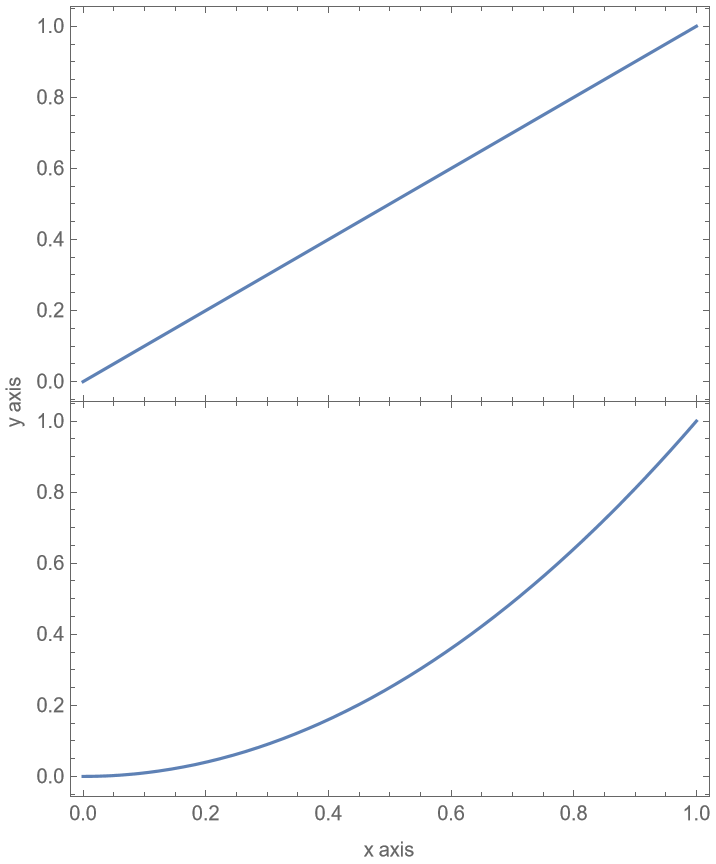
![ResourceFunction["PlotGrid"][
{
{Plot[x, {x, 0, 1}, Frame -> True]},
{Plot[x^2, {x, 0, 1}, Frame -> True]}
},
FrameLabel -> {"x axis", "y axis"}
]](https://www.wolframcloud.com/obj/resourcesystem/images/2ee/2ee44ba7-10c5-4a2b-acc2-773011f57547/16fce76999b343cd.png)
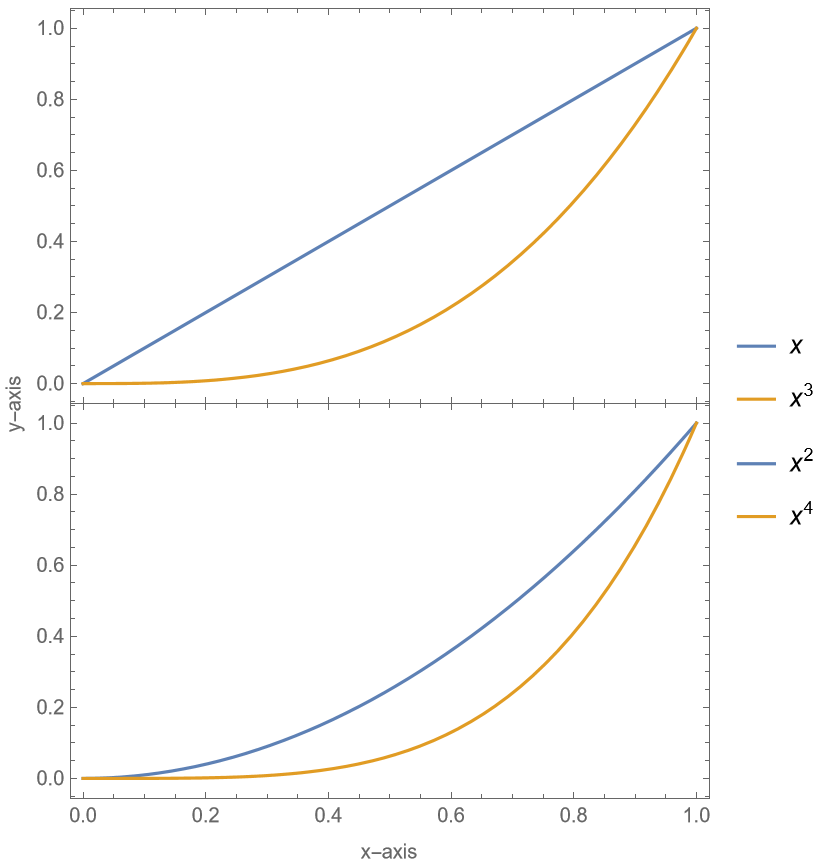
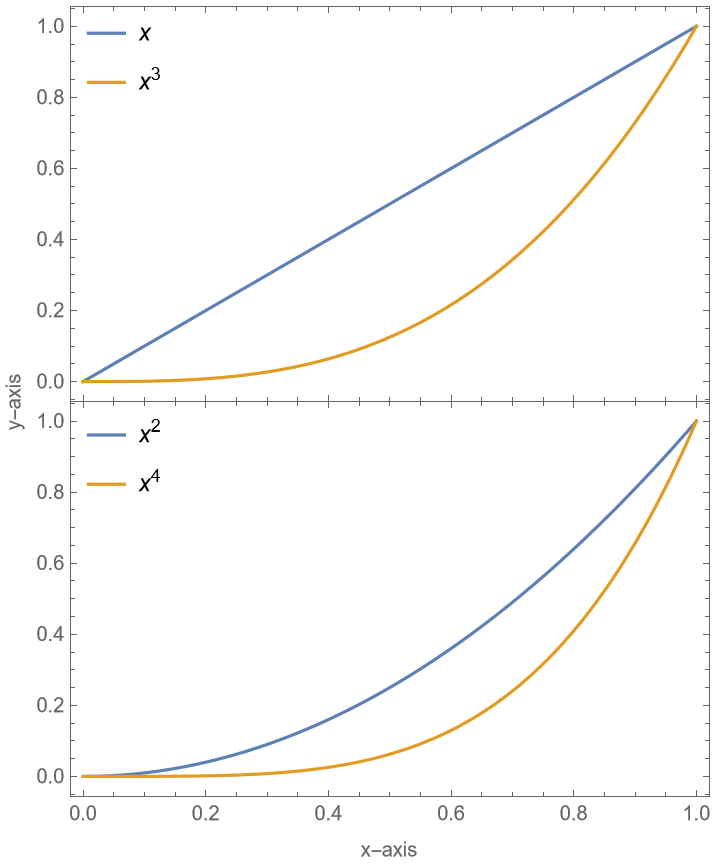
![ResourceFunction["PlotGrid"][
{
{
Plot[
{x, x^3},
{x, 0, 1},
Frame -> True,
PlotLegends -> "Expressions"
]
},
{
Plot[
{x^2, x^4},
{x, 0, 1},
Frame -> True,
PlotLegends -> "Expressions"
]
}
},
FrameLabel -> {"x-axis", "y-axis"}
]](https://www.wolframcloud.com/obj/resourcesystem/images/2ee/2ee44ba7-10c5-4a2b-acc2-773011f57547/07584d24c9f57450.png)
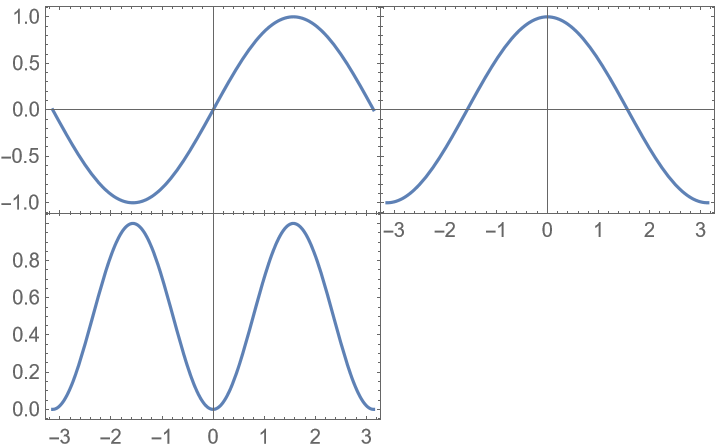
![ResourceFunction["PlotGrid"][
{
{
Plot[Sin[x], {x, -\[Pi], \[Pi]}, Frame -> True],
Plot[Cos[x], {x, -\[Pi], \[Pi]}, Frame -> True]
},
{Plot[Sin[x]^2, {x, -\[Pi], \[Pi]}, Frame -> True], Null}
}
]](https://www.wolframcloud.com/obj/resourcesystem/images/2ee/2ee44ba7-10c5-4a2b-acc2-773011f57547/58caa90082ec1473.png)
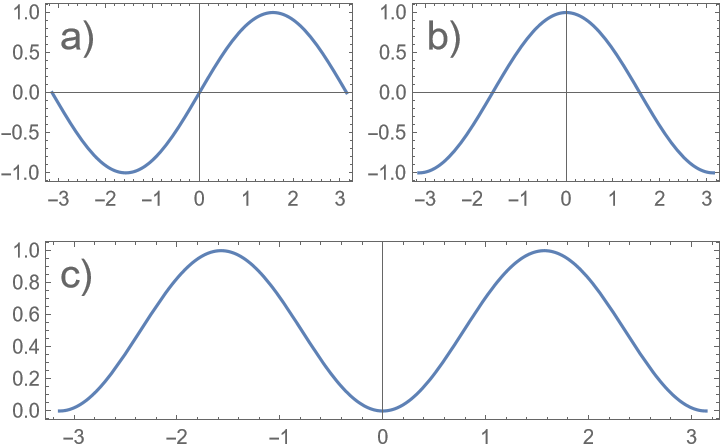
![ResourceFunction["PlotGrid"][
{
{
Plot[Sin[x], {x, -\[Pi], \[Pi]}, Frame -> True],
Plot[Cos[x], {x, -\[Pi], \[Pi]}, Frame -> True]
},
{Plot[Sin[x]^2, {x, -\[Pi], \[Pi]}, Frame -> True], SpanFromLeft}
},
Spacings -> 30,
PlotLabels -> Row -> Style["a)", 20]
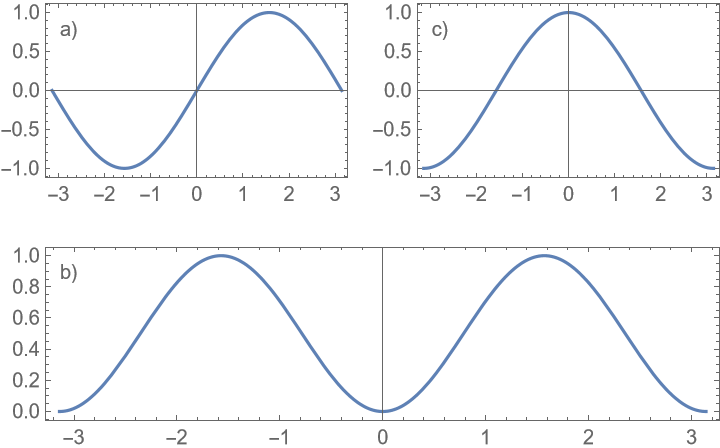
]](https://www.wolframcloud.com/obj/resourcesystem/images/2ee/2ee44ba7-10c5-4a2b-acc2-773011f57547/2e1a7a3e9779d523.png)
![ResourceFunction["PlotGrid"][
{
{
Plot[
{x, x^3},
{x, 0, 1},
Frame -> True,
PlotLegends -> Placed["Expressions", {Left, Top}]
]
},
{
Plot[
{x^2, x^4},
{x, 0, 1},
Frame -> True,
PlotLegends -> Placed["Expressions", {Left, Top}]
]
}
},
FrameLabel -> {"x-axis", "y-axis"}
]](https://www.wolframcloud.com/obj/resourcesystem/images/2ee/2ee44ba7-10c5-4a2b-acc2-773011f57547/707dfef5f3adc5e8.png)
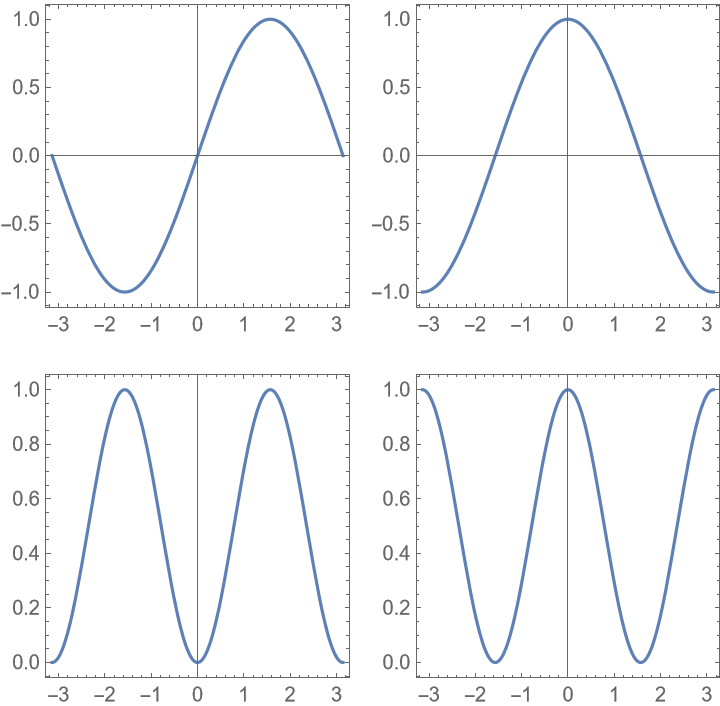
![ResourceFunction["PlotGrid"][
{
{
Plot[Sin[x], {x, -\[Pi], \[Pi]}, Frame -> True],
Plot[Cos[x], {x, -\[Pi], \[Pi]}, Frame -> True]
},
{
Plot[Sin[x]^2, {x, -\[Pi], \[Pi]}, Frame -> True],
Plot[Cos[x]^2, {x, -\[Pi], \[Pi]}, Frame -> True]
}
},
Spacings -> Scaled[0.1],
ItemSize -> {2, 1},
AspectRatio -> 1
]](https://www.wolframcloud.com/obj/resourcesystem/images/2ee/2ee44ba7-10c5-4a2b-acc2-773011f57547/10daa790b2b600c1.png)
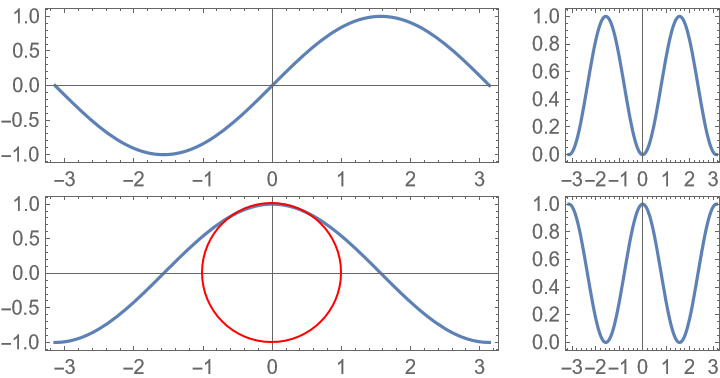
![ResourceFunction["PlotGrid"][
{
{
Plot[Sin[x], {x, -\[Pi], \[Pi]}, Frame -> True],
Plot[Sin[x]^2, {x, -\[Pi], \[Pi]}, Frame -> True]
},
{
Plot[Cos[x], {x, -\[Pi], \[Pi]}, Frame -> True, Epilog -> {Red, Circle[]}],
Plot[Cos[x]^2, {x, -\[Pi], \[Pi]}, Frame -> True]
}
},
Spacings -> Scaled[0.1],
AspectRatio -> {2, 1} -> Automatic
]](https://www.wolframcloud.com/obj/resourcesystem/images/2ee/2ee44ba7-10c5-4a2b-acc2-773011f57547/1fadf139bd201f89.png)
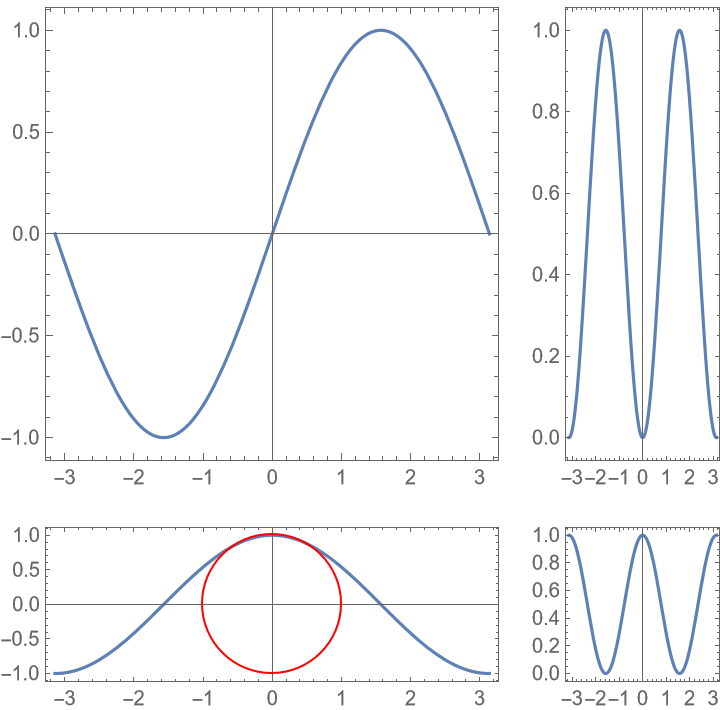
![ResourceFunction["PlotGrid"][
{
{
Plot[Sin[x], {x, -\[Pi], \[Pi]}, Frame -> True],
Plot[Sin[x]^2, {x, -\[Pi], \[Pi]}, Frame -> True]
},
{
Frame[
Plot[Cos[x], {x, -\[Pi], \[Pi]}, Frame -> True, Epilog -> {Red, Circle[]}],
AspectRatio -> Automatic
],
Plot[Cos[x]^2, {x, -\[Pi], \[Pi]}, Frame -> True]
}
},
Spacings -> Scaled[0.1],
AspectRatio -> 1
]](https://www.wolframcloud.com/obj/resourcesystem/images/2ee/2ee44ba7-10c5-4a2b-acc2-773011f57547/18e4dc569100da46.png)
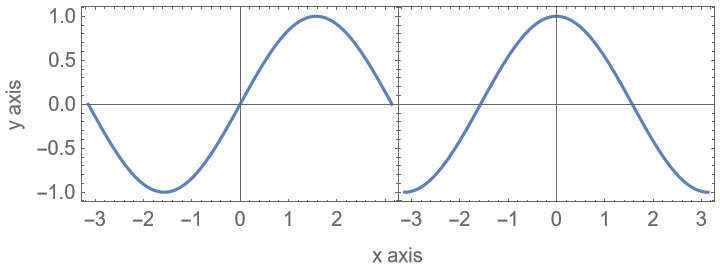
![ResourceFunction["PlotGrid"][
{
{
Plot[Sin[x], {x, -\[Pi], \[Pi]}, Frame -> True],
Plot[Cos[x], {x, -\[Pi], \[Pi]}, Frame -> True]
}
},
FrameLabel -> {"x axis", "y axis"}
]](https://www.wolframcloud.com/obj/resourcesystem/images/2ee/2ee44ba7-10c5-4a2b-acc2-773011f57547/331938b475481c1a.png)
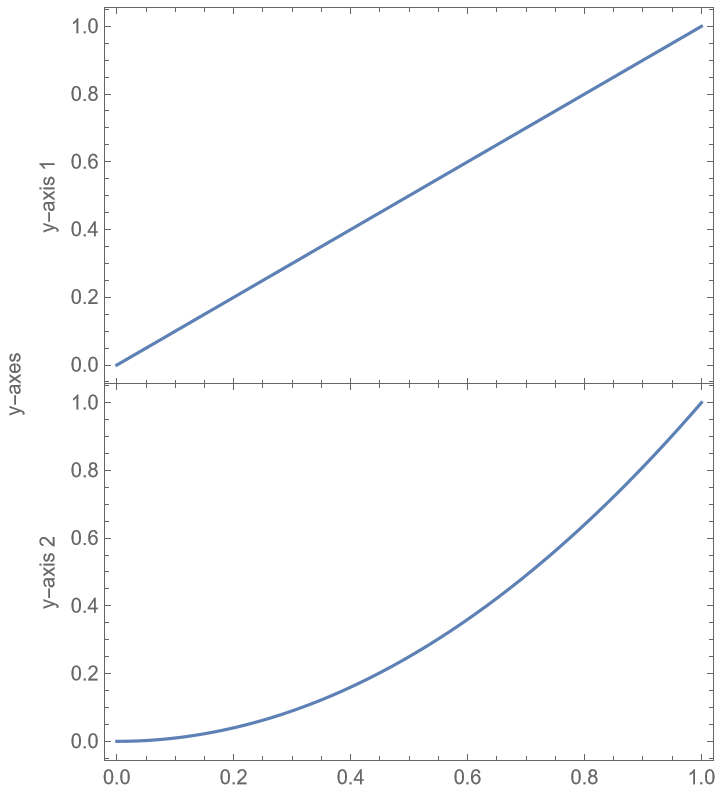
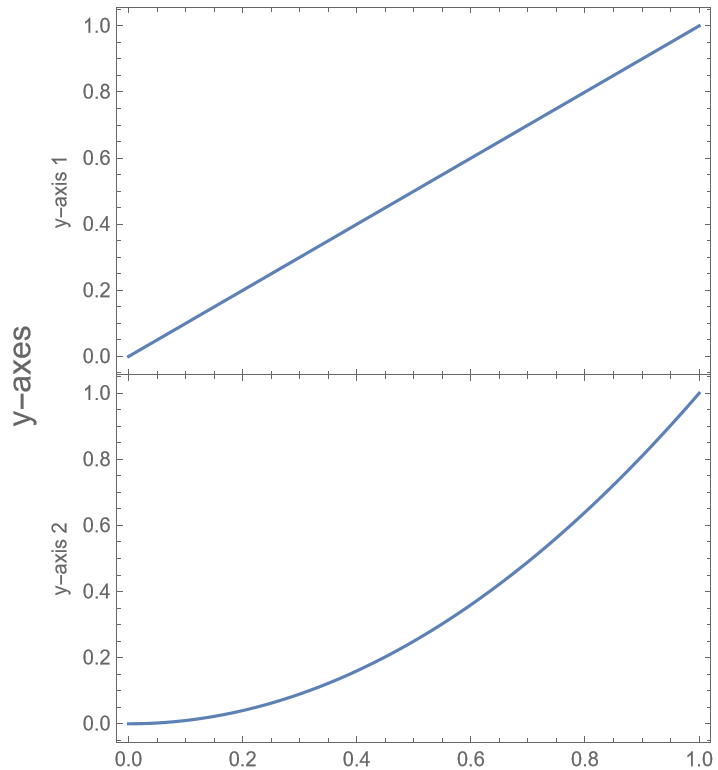
![ResourceFunction["PlotGrid"][
{
{
Plot[
x, {x, 0, 1}, Frame -> True, FrameLabel -> {None, "y-axis 1"}
]
},
{
Plot[
x^2,
{x, 0, 1},
Frame -> True,
FrameLabel -> {None, "y-axis 2"}
]
}
},
FrameLabel -> {None, "y-axes"}
]](https://www.wolframcloud.com/obj/resourcesystem/images/2ee/2ee44ba7-10c5-4a2b-acc2-773011f57547/2e576baa6e053e43.png)
![ResourceFunction["PlotGrid"][
{
{
Plot[
x, {x, 0, 1}, Frame -> True, FrameLabel -> {None, "y-axis 1"}
]
},
{
Plot[
x^2,
{x, 0, 1},
Frame -> True,
FrameLabel -> {None, "y-axis 2"}
]
}
},
FrameLabel -> {None, "y-axes"},
FrameStyle -> FontSize -> 16
]](https://www.wolframcloud.com/obj/resourcesystem/images/2ee/2ee44ba7-10c5-4a2b-acc2-773011f57547/06238b6f32c65333.png)
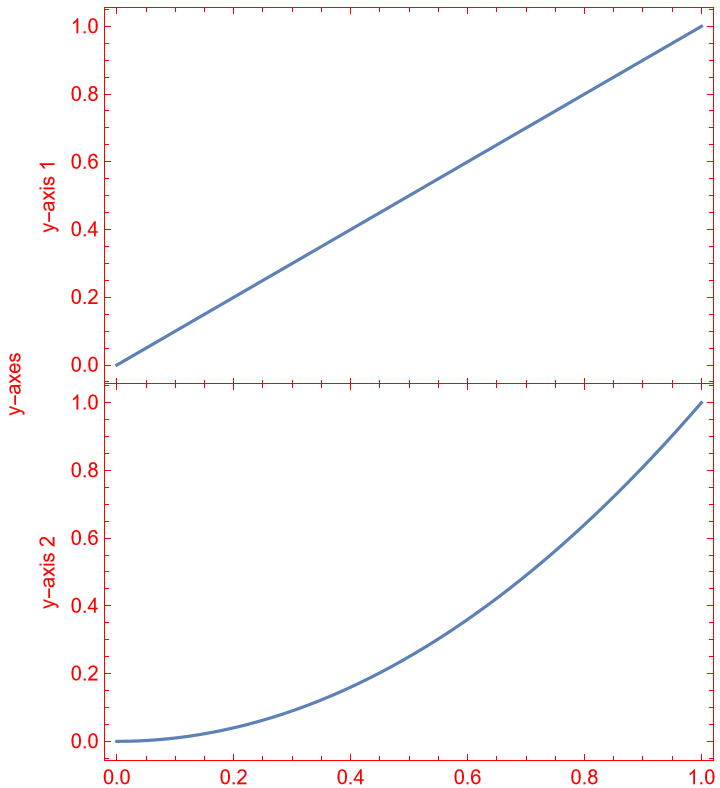
![ResourceFunction["PlotGrid"][
{
{
Plot[
x,
{x, 0, 1},
Frame -> True,
FrameLabel -> {None, "y-axis 1"},
FrameStyle -> Red
]
},
{
Plot[
x^2,
{x, 0, 1},
Frame -> True,
FrameLabel -> {None, "y-axis 2"},
FrameStyle -> Red
]
}
},
FrameLabel -> {None, "y-axes"}
]](https://www.wolframcloud.com/obj/resourcesystem/images/2ee/2ee44ba7-10c5-4a2b-acc2-773011f57547/2794972bf74eec3c.png)
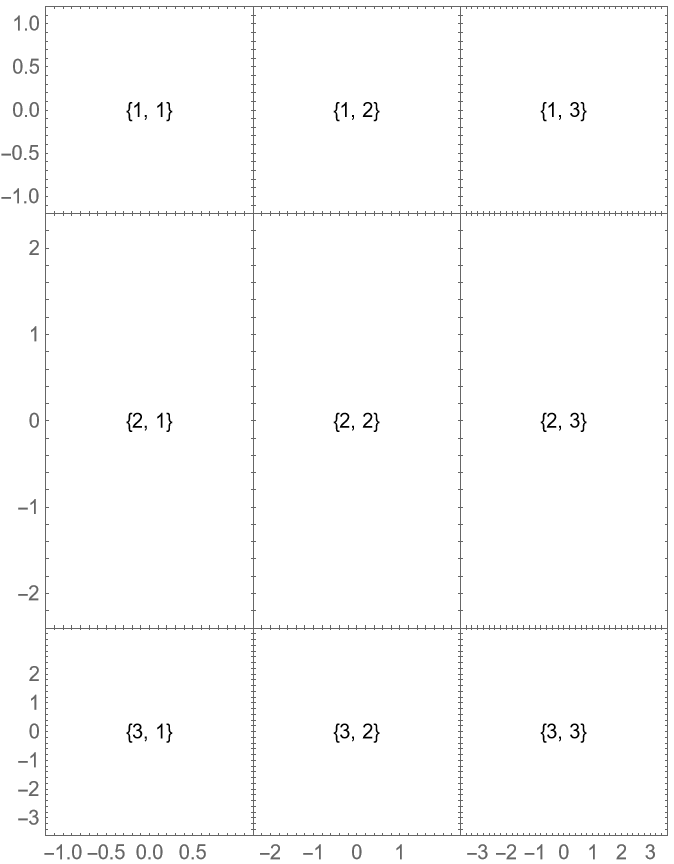
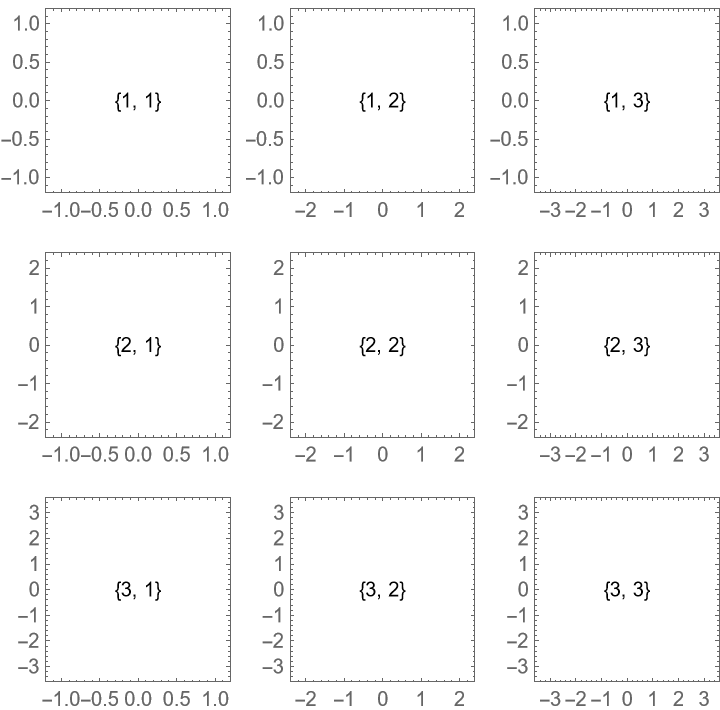
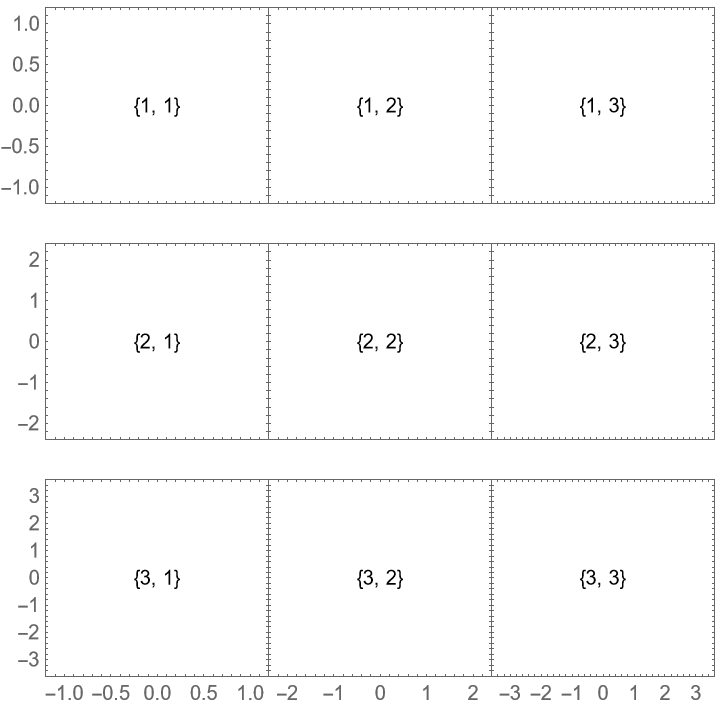
![ResourceFunction["PlotGrid"][
Table[
Graphics[
Text[{i, j}],
PlotRange -> 1.2 {{-j, j}, {-i, i}},
Frame -> True
],
{i, 3},
{j, 3}
],
ItemSize -> {Automatic, {2 -> 2}}
]](https://www.wolframcloud.com/obj/resourcesystem/images/2ee/2ee44ba7-10c5-4a2b-acc2-773011f57547/7981d823fea4ad6d.png)
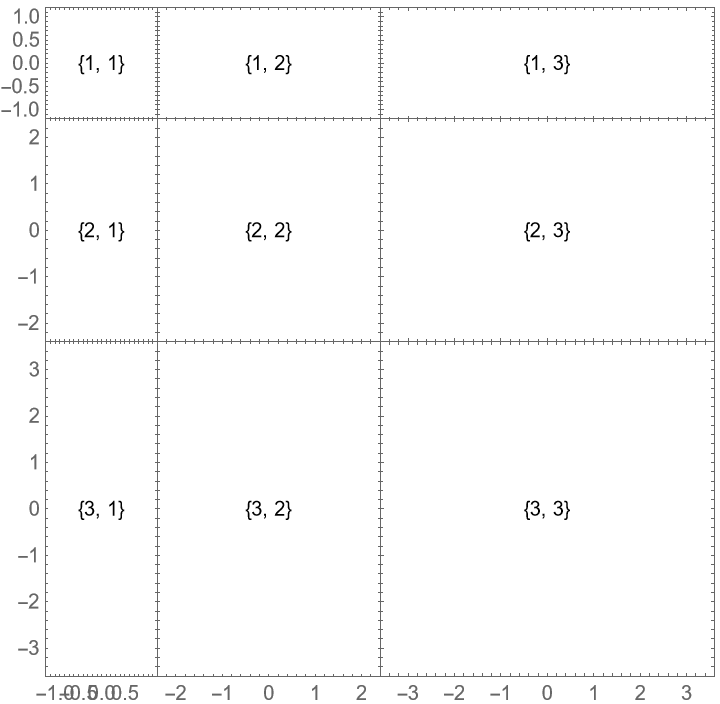
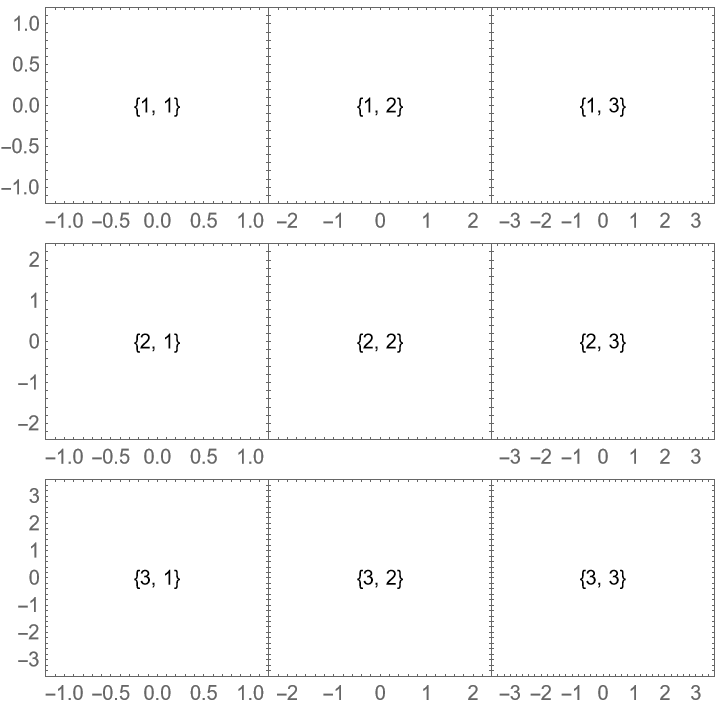
![ResourceFunction["PlotGrid"][
Table[
Graphics[
Text[{i, j}],
PlotRange -> 1.2 {{-j, j}, {-i, i}},
Frame -> True
],
{i, 3},
{j, 3}
],
ItemSize -> Scaled
]](https://www.wolframcloud.com/obj/resourcesystem/images/2ee/2ee44ba7-10c5-4a2b-acc2-773011f57547/32bcb4ea2a75d45f.png)
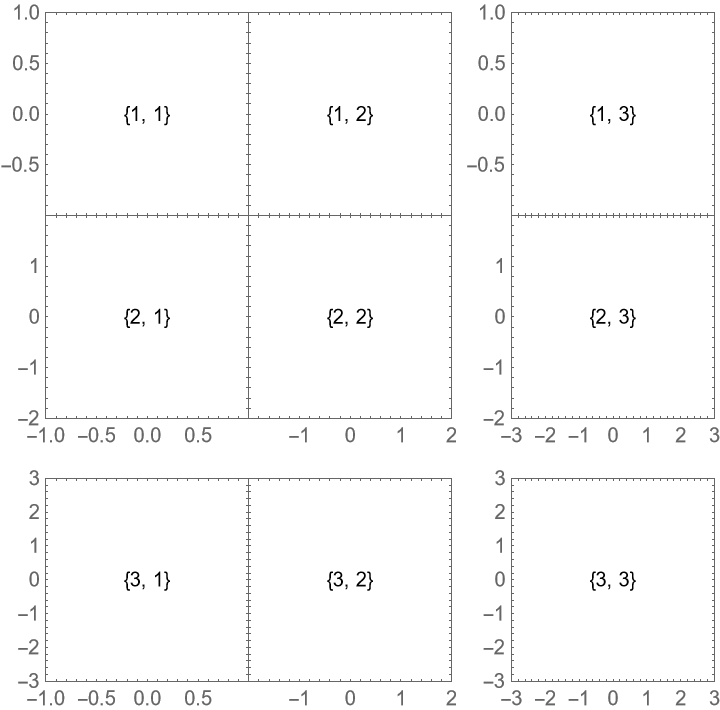
![ResourceFunction["PlotGrid"][
Table[
Graphics[
Text[{i, j}],
PlotRange -> 1.2 {{-j, j}, {-i, i}},
Frame -> True
],
{i, 3},
{j, 3}
],
Spacings -> 30
]](https://www.wolframcloud.com/obj/resourcesystem/images/2ee/2ee44ba7-10c5-4a2b-acc2-773011f57547/0bb5105116f25ff2.png)
![ResourceFunction["PlotGrid"][
Table[
Graphics[
Text[{i, j}],
PlotRange -> 1.2 {{-j, j}, {-i, i}},
Frame -> True
],
{i, 3},
{j, 3}
],
Spacings -> {None, Scaled[0.1]}
]](https://www.wolframcloud.com/obj/resourcesystem/images/2ee/2ee44ba7-10c5-4a2b-acc2-773011f57547/4d5db3ec310e7850.png)
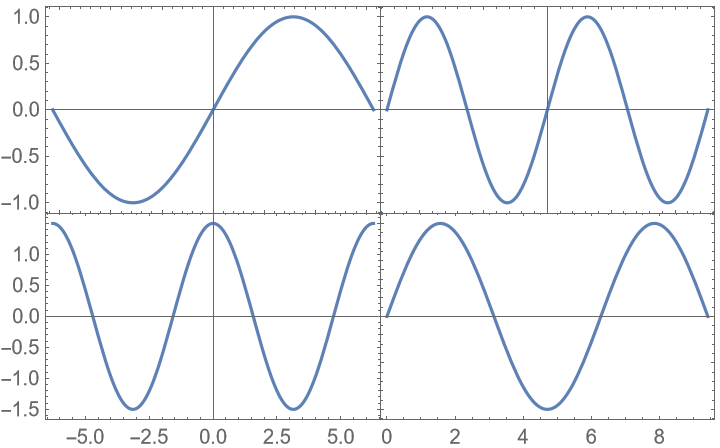
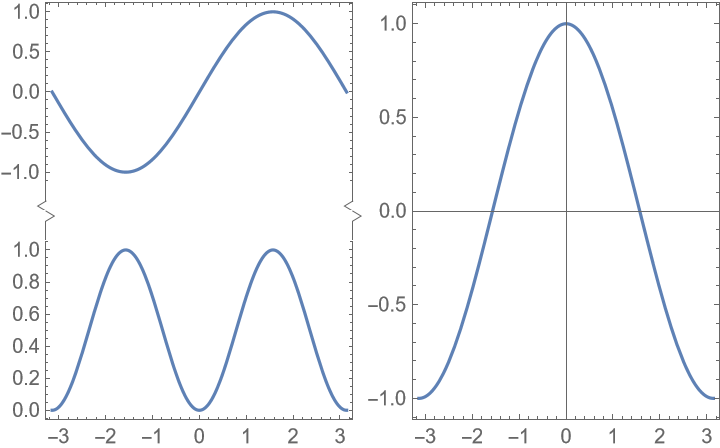
![ResourceFunction["PlotGrid"][
{
{
Plot[Sin[x], {x, -\[Pi], \[Pi]}, Frame -> True],
Plot[2 Sin[x], {x, -2 \[Pi], 2 \[Pi]}, Frame -> True]
},
{
Plot[1.5 Cos[x], {x, -2 \[Pi], 2 \[Pi]}, Frame -> True],
Plot[Sin[x], {x, -0 \[Pi], 3 \[Pi]}, Frame -> True]
}
}
]](https://www.wolframcloud.com/obj/resourcesystem/images/2ee/2ee44ba7-10c5-4a2b-acc2-773011f57547/4d4dfa221be56907.png)
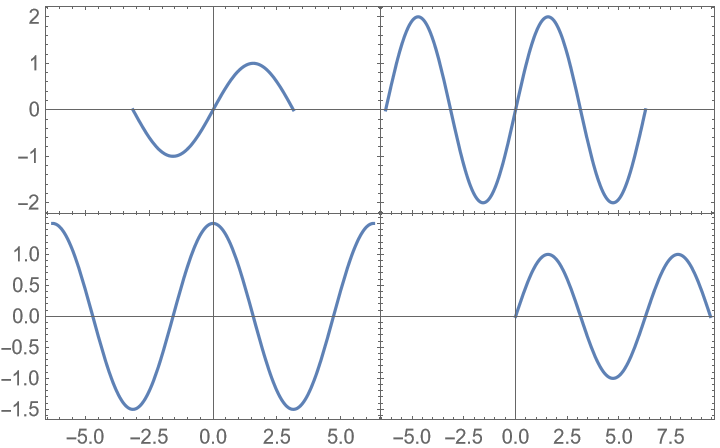
![ResourceFunction["PlotGrid"][
{
{
Plot[Sin[x], {x, -\[Pi], \[Pi]}, Frame -> True],
Plot[2 Sin[x], {x, -2 \[Pi], 2 \[Pi]}, Frame -> True]
},
{
Plot[1.5 Cos[x], {x, -2 \[Pi], 2 \[Pi]}, Frame -> True],
Plot[Sin[x], {x, -0 \[Pi], 3 \[Pi]}, Frame -> True]
}
},
PlotRange -> Max
]](https://www.wolframcloud.com/obj/resourcesystem/images/2ee/2ee44ba7-10c5-4a2b-acc2-773011f57547/68ee01f1037401e3.png)
![ResourceFunction["PlotGrid"][
{
{
Plot[Sin[x], {x, -\[Pi], \[Pi]}, Frame -> True],
Plot[Cos[x], {x, -\[Pi], \[Pi]}, Frame -> True]
},
{Plot[Sin[x]^2, {x, -\[Pi], \[Pi]}, Frame -> True], SpanFromLeft}
},
Spacings -> 35,
PlotLabels -> Automatic -> "a)"
]](https://www.wolframcloud.com/obj/resourcesystem/images/2ee/2ee44ba7-10c5-4a2b-acc2-773011f57547/157261affb0568a1.png)
![ResourceFunction["PlotGrid"][
{
{
Plot[Sin[x], {x, -\[Pi], \[Pi]}, Frame -> True],
Plot[Cos[x], {x, -\[Pi], \[Pi]}, Frame -> True]
},
{Plot[Sin[x]^2, {x, -\[Pi], \[Pi]}, Frame -> True], SpanFromLeft}
},
Spacings -> 35,
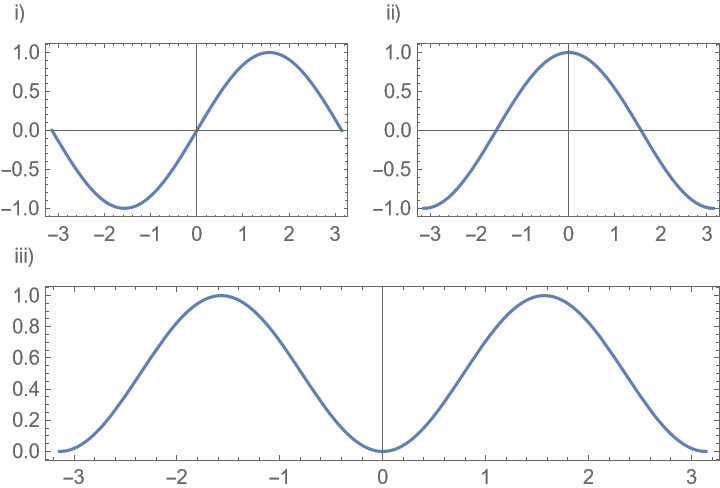
PlotLabels -> Placed[Row -> "i)", {Left, Above}]
]](https://www.wolframcloud.com/obj/resourcesystem/images/2ee/2ee44ba7-10c5-4a2b-acc2-773011f57547/45e2542de3426e7a.png)
![ResourceFunction["PlotGrid"][
{
{
Labeled[
Plot[Sin[x], {x, -\[Pi], \[Pi]}, Frame -> True],
"A label",
{Left, Top}
],
Plot[Cos[x], {x, -\[Pi], \[Pi]}, Frame -> True]
},
{Plot[Sin[x]^2, {x, -\[Pi], \[Pi]}, Frame -> True], SpanFromLeft}
},
Spacings -> 35,
PlotLabels -> Placed[Row -> "i)", {Left, Above}],
LabelStyle -> Black
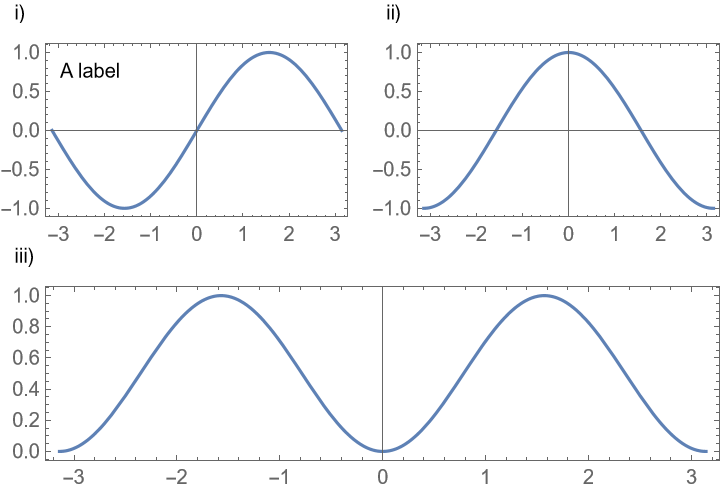
]](https://www.wolframcloud.com/obj/resourcesystem/images/2ee/2ee44ba7-10c5-4a2b-acc2-773011f57547/0a18f64310cebd72.png)
![ResourceFunction["PlotGrid"][
{
{
Plot[Sin[x], {x, -\[Pi], \[Pi]}, Frame -> True],
Plot[Cos[x], {x, -\[Pi], \[Pi]}, Frame -> True]
},
{Plot[Sin[x]^2, {x, -\[Pi], \[Pi]}, Frame -> True], SpanFromLeft}
},
Spacings -> 30,
PlotLabels -> {
Placed[{"Label 1.1", "Label 1.2"}, {Left, Above}],
Placed[{"Label 2.1", "Label 2.2"}, {After, Center}],
"Label 3"
},
LabelingFunction -> (Framed[Column@#, Background -> White] &)
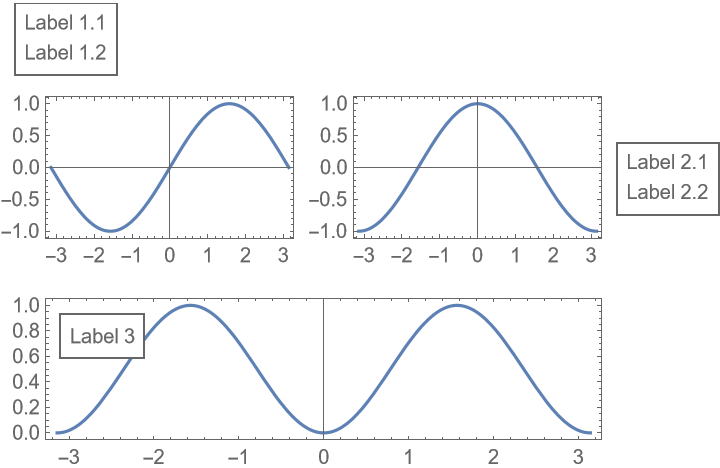
]](https://www.wolframcloud.com/obj/resourcesystem/images/2ee/2ee44ba7-10c5-4a2b-acc2-773011f57547/59338fa9985a41bd.png)
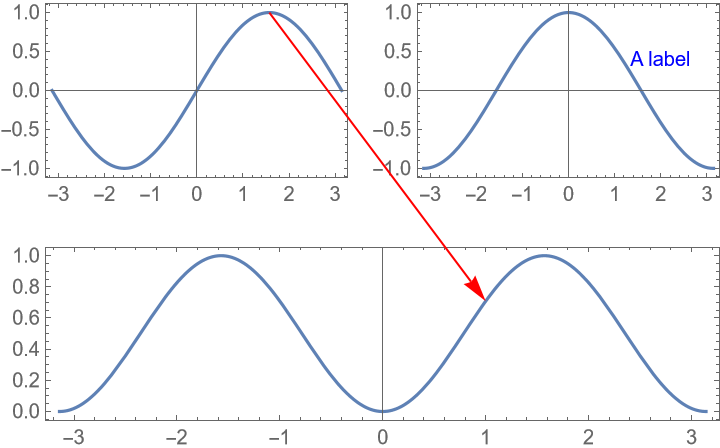
![ResourceFunction["PlotGrid"][
{
{
Plot[Sin[x], {x, -\[Pi], \[Pi]}, Frame -> True],
Plot[Cos[x], {x, -\[Pi], \[Pi]}, Frame -> True]
},
{Plot[Sin[x]^2, {x, -\[Pi], \[Pi]}, Frame -> True], SpanFromLeft}
},
Spacings -> 35,
Epilog -> {
Blue, Text["A label", {1, 2} -> {2, 0.4}],
Red, Arrow@{{1, 1} -> {\[Pi]/2, 1}, {2, 1} -> {1, Sin[1]^2}}
}
]](https://www.wolframcloud.com/obj/resourcesystem/images/2ee/2ee44ba7-10c5-4a2b-acc2-773011f57547/09c41ee293c5ba15.png)
![ResourceFunction["PlotGrid"][
{
{
Plot[Sin[x], {x, -\[Pi], \[Pi]}, Frame -> True],
Plot[Cos[x], {x, -\[Pi], \[Pi]}, Frame -> True]
},
{Plot[Sin[x]^2, {x, -\[Pi], \[Pi]}, Frame -> True], SpanFromLeft}
},
Spacings -> 35,
Epilog -> {
EdgeForm@Black, FaceForm@None, Rectangle[{1, 1} -> ImageScaled@{0, 0}, {1, 2} -> ImageScaled@{1, 1}],
Red, Arrow@{{1, 1} -> Scaled@{1, 0}, {2, 1} -> {1, Sin[1]^2}},
Green, Circle[{2, 1} -> Offset[{10, -10}, Scaled@{0, 1}], Offset[10]]
}
]](https://www.wolframcloud.com/obj/resourcesystem/images/2ee/2ee44ba7-10c5-4a2b-acc2-773011f57547/6296061545a64b2f.png)

![ResourceFunction["PlotGrid"][
Table[
Graphics[
Text[{i, j}],
PlotRange -> 1.2 {{-j, j}, {-i, i}},
Frame -> True
],
{i, 3},
{j, 3}
],
Spacings -> {None, 20},
"ShowFrameLabels" -> Automatic
]](https://www.wolframcloud.com/obj/resourcesystem/images/2ee/2ee44ba7-10c5-4a2b-acc2-773011f57547/0844d5643ff0b547.png)
![ResourceFunction["PlotGrid"][
MapAt[
Frame[#, "ShowFrameLabels" -> None] &,
Table[
Graphics[
Text[{i, j}],
PlotRange -> 1.2 {{-j, j}, {-i, i}},
Frame -> True
],
{i, 3},
{j, 3}
],
{2, 2}
],
Spacings -> {None, 20}
]](https://www.wolframcloud.com/obj/resourcesystem/images/2ee/2ee44ba7-10c5-4a2b-acc2-773011f57547/3efc692904f8f0f8.png)
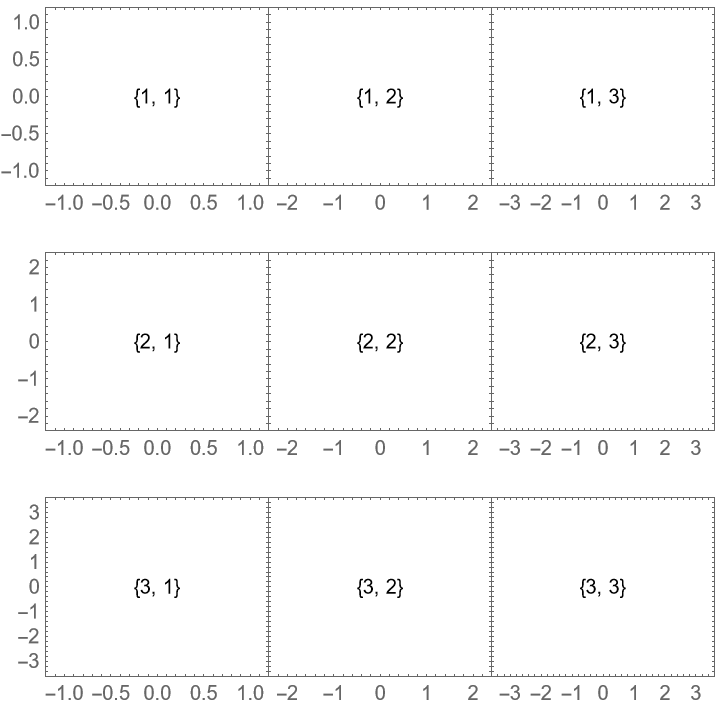
![ResourceFunction["PlotGrid"][
Table[
Graphics[
Text[{i, j}],
PlotRange -> {{-j, j}, {-i, i}},
Frame -> True
],
{i, 3},
{j, 3}
],
Spacings -> {{None, 30}, {None, 30}},
"HideOuterTickLabels" -> Directive[All, Full]
]](https://www.wolframcloud.com/obj/resourcesystem/images/2ee/2ee44ba7-10c5-4a2b-acc2-773011f57547/4a7891b5ac6452b9.png)
![ResourceFunction["PlotGrid"][
{
{
Plot[Sin[x], {x, -\[Pi], \[Pi]}, Frame -> True, Axes -> False],
Plot[Cos[x], {x, -\[Pi], \[Pi]}, Frame -> True]
},
{Plot[Sin[x]^2, {x, -\[Pi], \[Pi]}, Frame -> True, Axes -> False], SpanFromAbove}
},
Spacings -> 30,
"MergeAxes" -> {False, "ZigZag"}
]](https://www.wolframcloud.com/obj/resourcesystem/images/2ee/2ee44ba7-10c5-4a2b-acc2-773011f57547/34ab8cb4f358ec83.png)
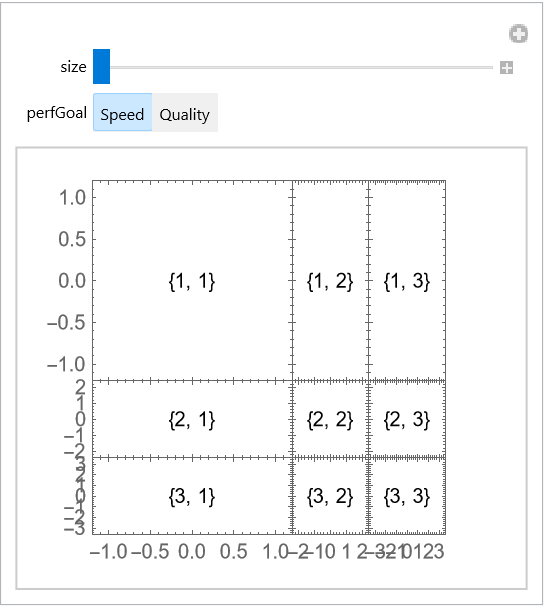
![Manipulate[
ResourceFunction["PlotGrid"][
Table[
Graphics[
Text[{i, j}],
PlotRange -> 1.2 {{-j, j}, {-i, i}},
Frame -> True
],
{i, 3},
{j, 3}
],
ItemSize -> {{Offset[100]}, {Offset[100]}},
ImageSize -> Dynamic[size],
PerformanceGoal -> perfGoal
],
{size, 200, 600},
{perfGoal, {"Speed", "Quality"}}
]](https://www.wolframcloud.com/obj/resourcesystem/images/2ee/2ee44ba7-10c5-4a2b-acc2-773011f57547/7cd88778950b32b5.png)
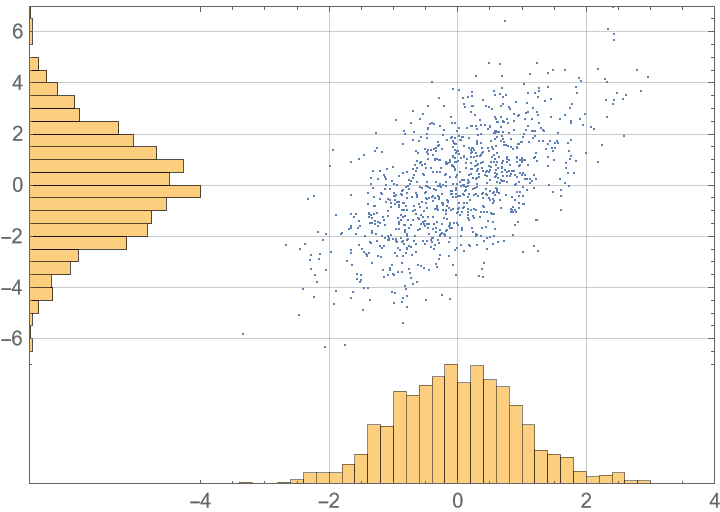
![data =
RandomVariate[
BinormalDistribution[{0, 0}, {1, 2}, 0.6], 1000
];
ResourceFunction["PlotGrid"][
{
{Histogram[data[[All, 2]], 20, Sequence[
BarOrigin -> Left, Frame -> True, FrameTicks -> {{True, False}, {False, False}}, PlotRange -> {Automatic, {-7, 7}}, PlotRangePadding -> 0, GridLines -> {None, Automatic}]],
ListPlot[data, Sequence[
Axes -> False, Frame -> True, GridLines -> Automatic, PlotRangePadding -> 0, PlotRange -> {{-4, 4}, {-7, 7}}]]},
{Graphics[{}, Frame -> True, FrameTicks -> None],
Histogram[data[[All, 1]],
20, Sequence[
Frame -> True, FrameTicks -> {{False, False}, {True, False}}, PlotRange -> {{-4, 4}, Automatic}, PlotRangePadding -> 0, GridLines -> {Automatic, None}]]
}
},
ItemSize -> {{1, 3}, {3, 1}},
"MergeAxes" -> None
]](https://www.wolframcloud.com/obj/resourcesystem/images/2ee/2ee44ba7-10c5-4a2b-acc2-773011f57547/05cc43657b9a0dec.png)
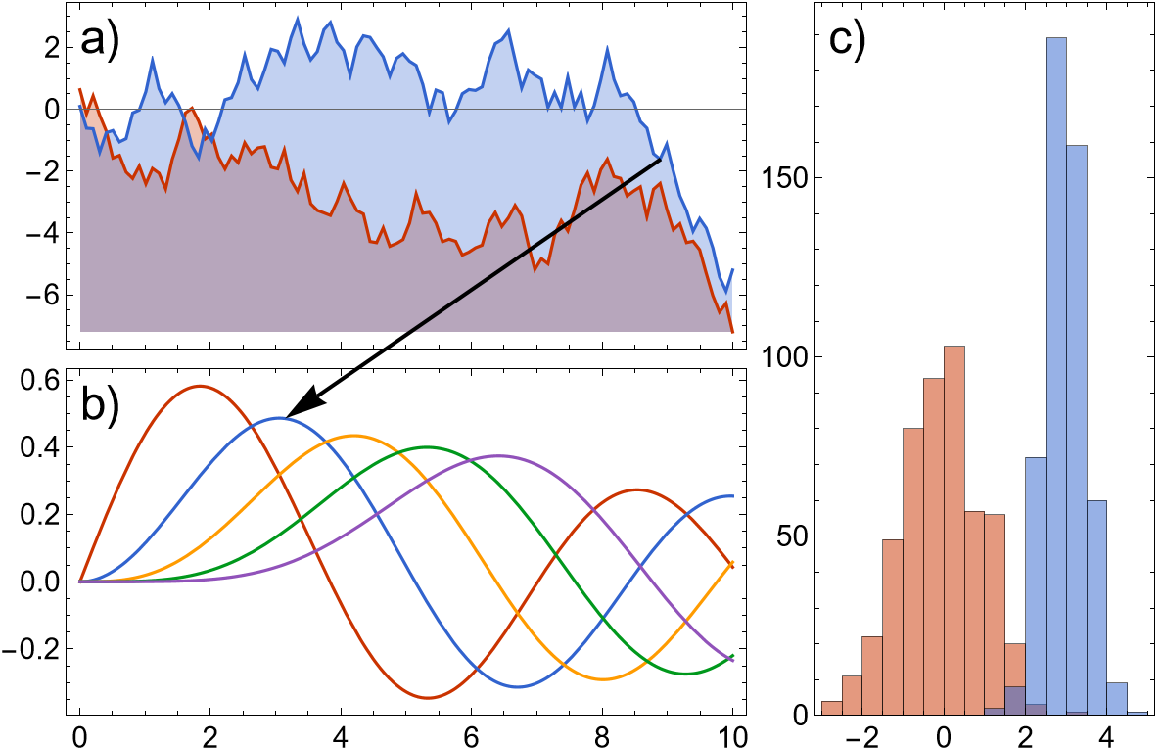
![SeedRandom[1];
data1 = Accumulate /@ RandomReal[{-1, 1}, {2, 100}];
data2 = {
RandomVariate[NormalDistribution[0, 1], 500],
RandomVariate[NormalDistribution[3, 1/2], 500]
};
func3 = Table[BesselJ[n, x], {n, 5}];
ResourceFunction["PlotGrid"][
{{
ListLinePlot[
data1,
Sequence[
Frame -> True, PlotTheme -> "VibrantColors", Filling -> Bottom, DataRange -> {0, 10}, BaseStyle -> {FontSize -> 15}, FrameStyle -> Black]
],
Histogram[
data2,
Sequence[
Frame -> True, PlotTheme -> "VibrantColors", BaseStyle -> {FontSize -> 15}, FrameStyle -> Black]
]
},
{
Plot[
Evaluate@func3,
{x, 0, 10},
Sequence[
Frame -> True, PlotTheme -> "VibrantColors", BaseStyle -> {FontSize -> 15}, FrameStyle -> Black]
], SpanFromAbove}},
Spacings -> {35, 10},
"ShowFrameLabels" -> {{Automatic}, {Full}},
PlotLabels -> Automatic -> Style["a)", Large, Black],
ItemSize -> {{2, 1}, 1.59},
ImageSize -> 590,
Epilog -> {Black, Thick, Arrow@{{1, 1} -> {8.9, data1[[2, 89]]}, {2, 1} -> Block[{x = Pi}, {x, func3[[2]]}]}}
]](https://www.wolframcloud.com/obj/resourcesystem/images/2ee/2ee44ba7-10c5-4a2b-acc2-773011f57547/5ab9b0c951ab37f0.png)