Options (65)
AspectRatio (8)
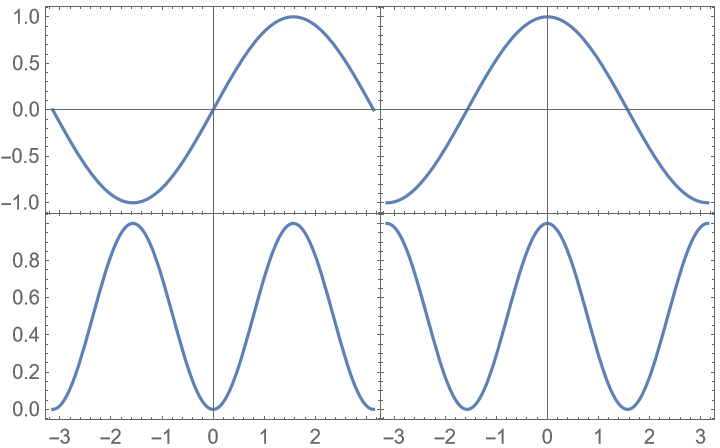
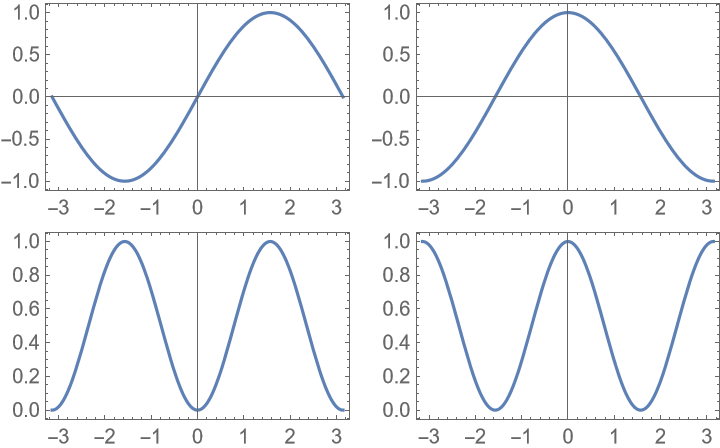
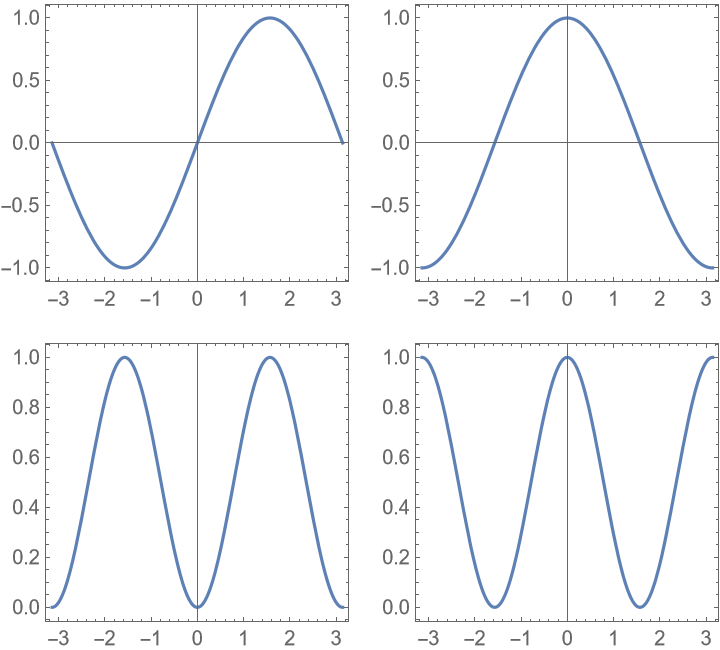
With the default setting AspectRatio→Automatic, the aspect ratio of the resulting grid is based on a combination of the ItemSize setting and the AspectRatio settings of the individual plots:
Changing the AspectRatio of the plots changes the resulting aspect ratio:
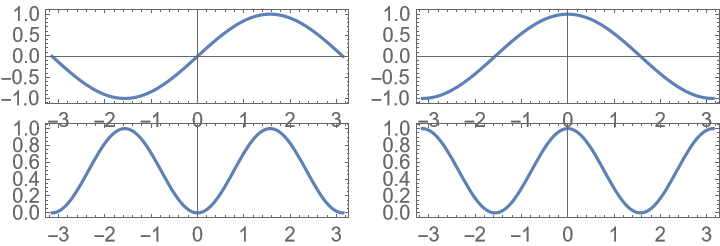
Changing the ItemSize setting affects the aspect ratio:
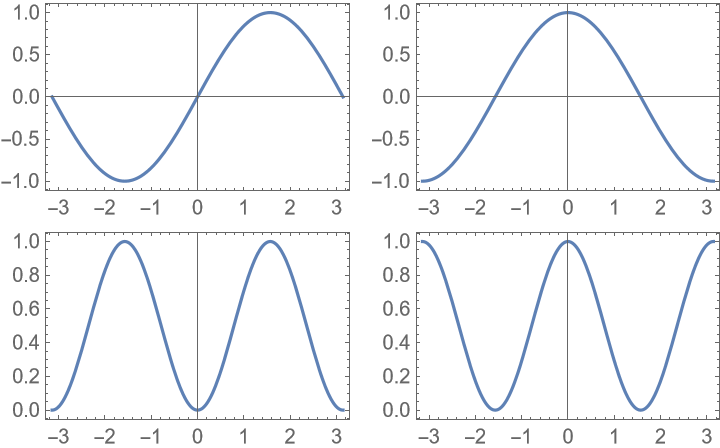
Base the aspect ratio only on the aspect ratios of the individual plots:
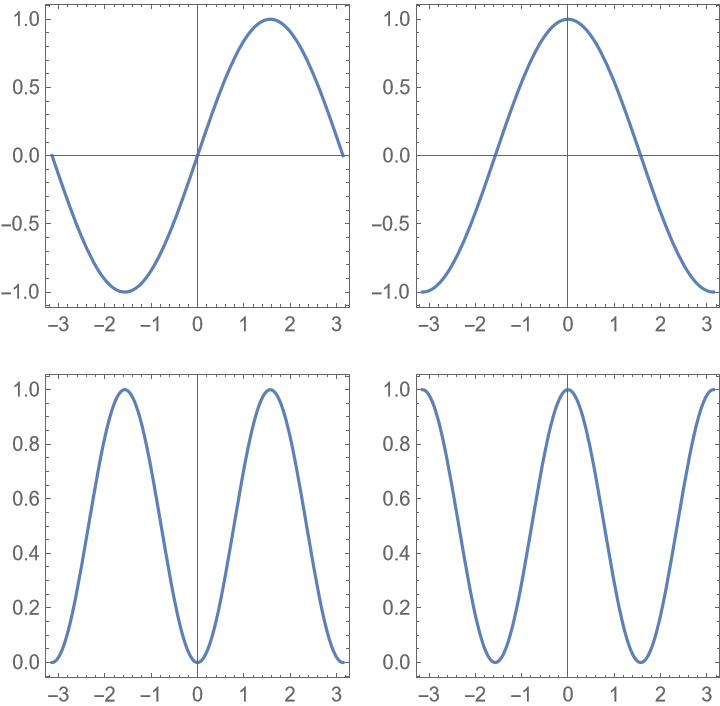
Target a specific aspect ratio:
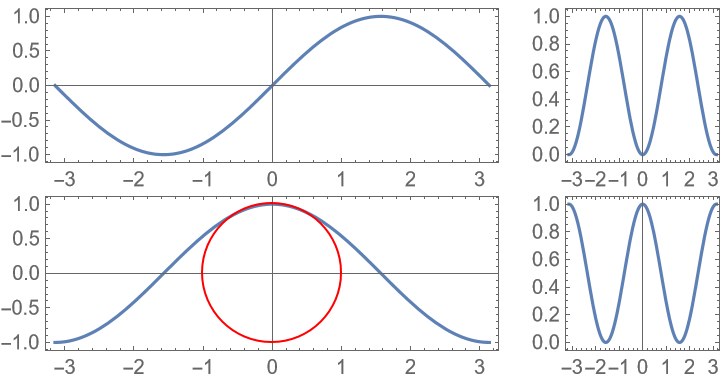
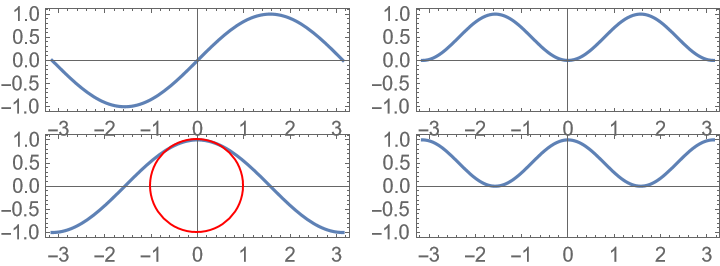
Make it so the bottom left plot effectively has AspectRatio→Automatic, so that the circle is really a circle:
Trying to make all plots have AspectRatio→Automatic is not always possible:
Equalizing the PlotRange settings will usually resolve the problem:
Another possibility is to only apply the aspect ratio target to as many plots as possible:
Only rows/columns with ItemSize set to Automatic will be resized to hit the aspect ratio targets:
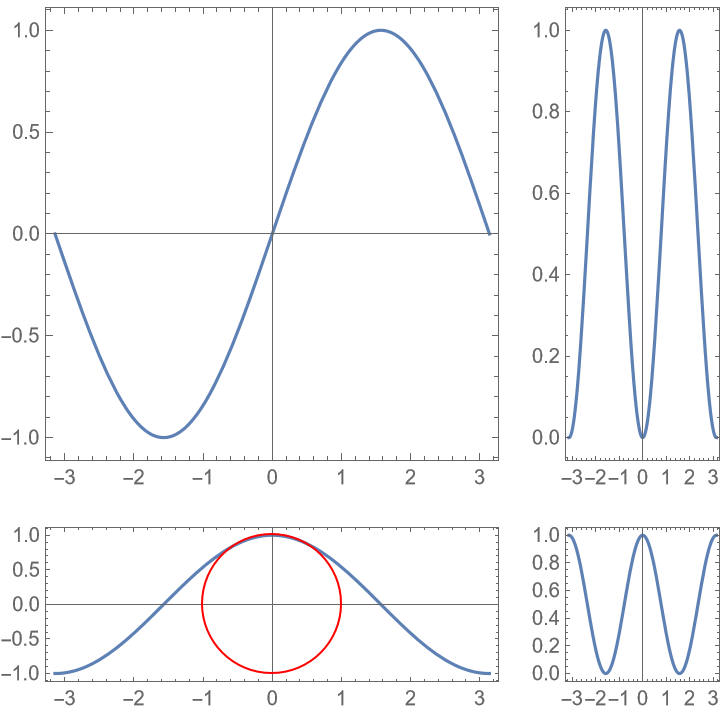
Use a Frame[…] type wrapper to specify the target aspect ratio for the plot with the circle, and specify a target for the overall aspect ratio:
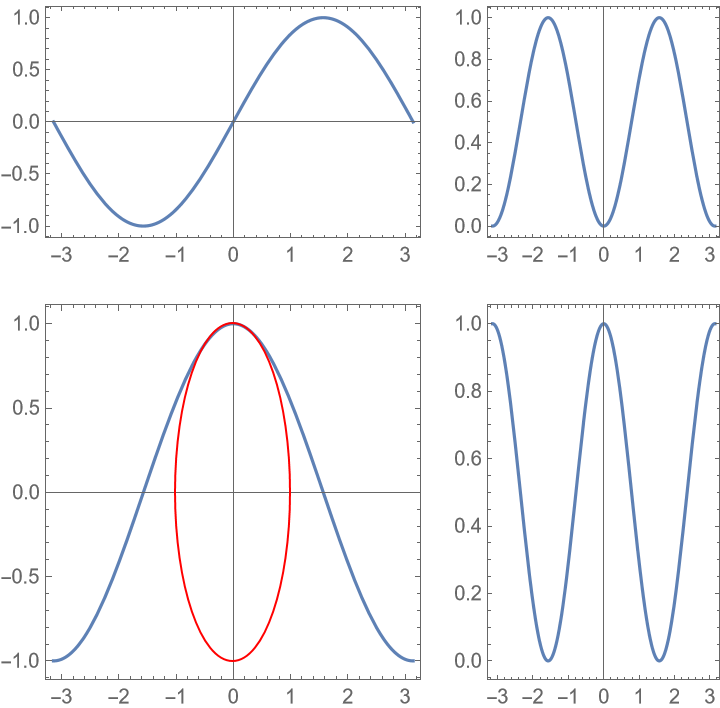
Use a mixture of different target aspect ratios and specify the overall aspect ratio of the grid:
FrameLabel (2)
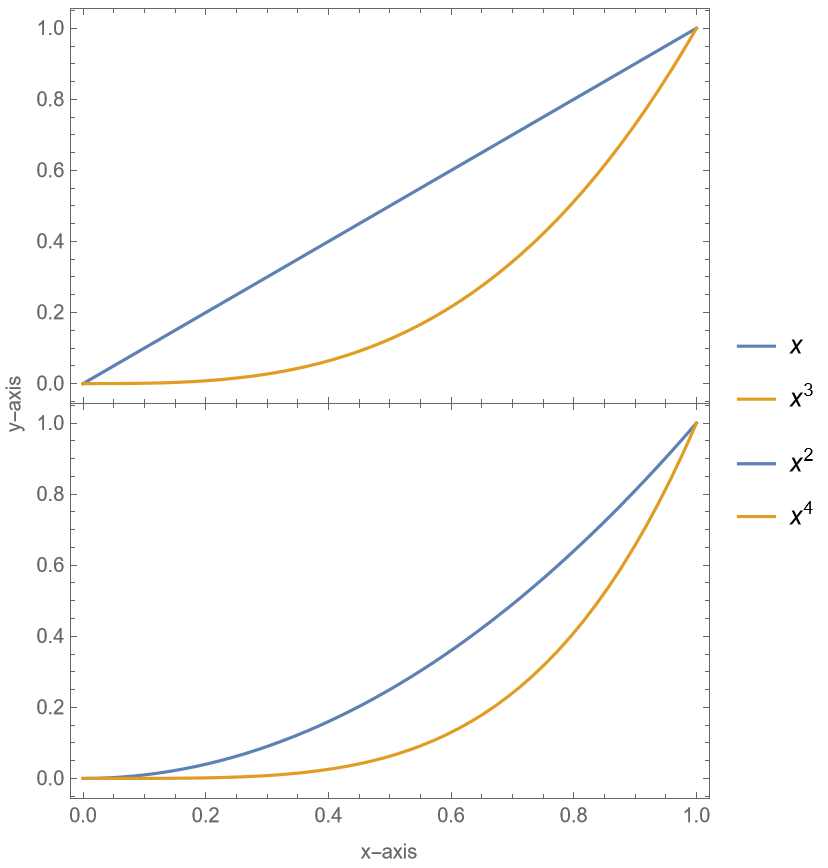
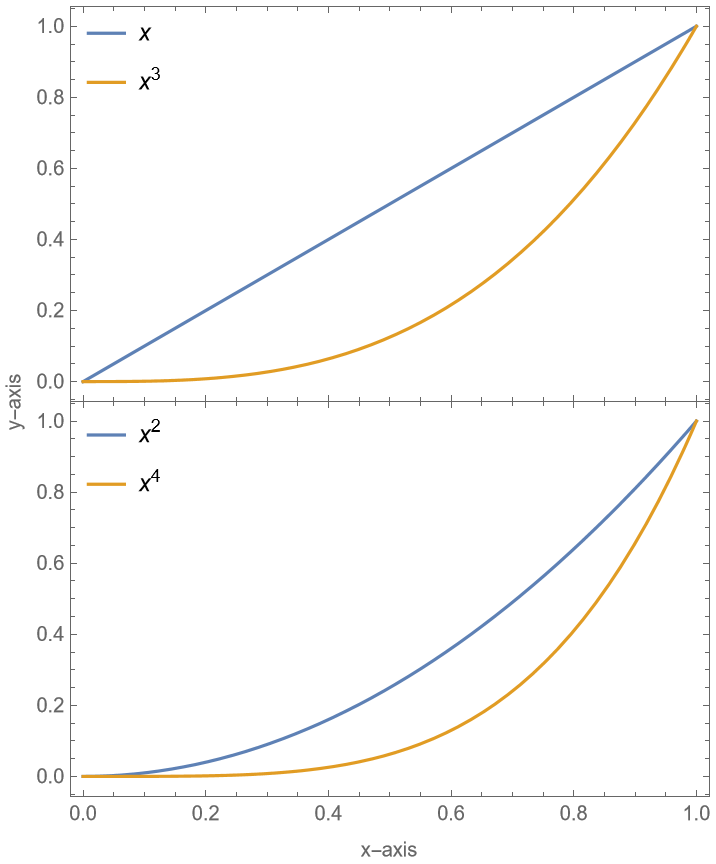
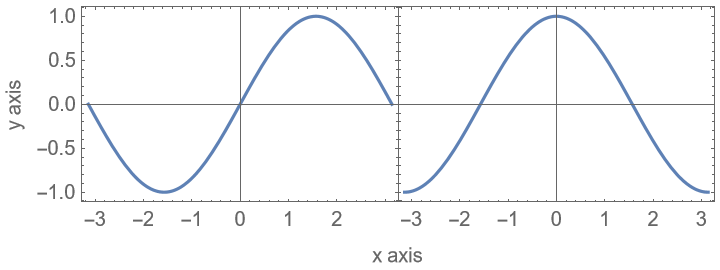
Labels specified by FrameLabel are centered with respect to the full plot grid:
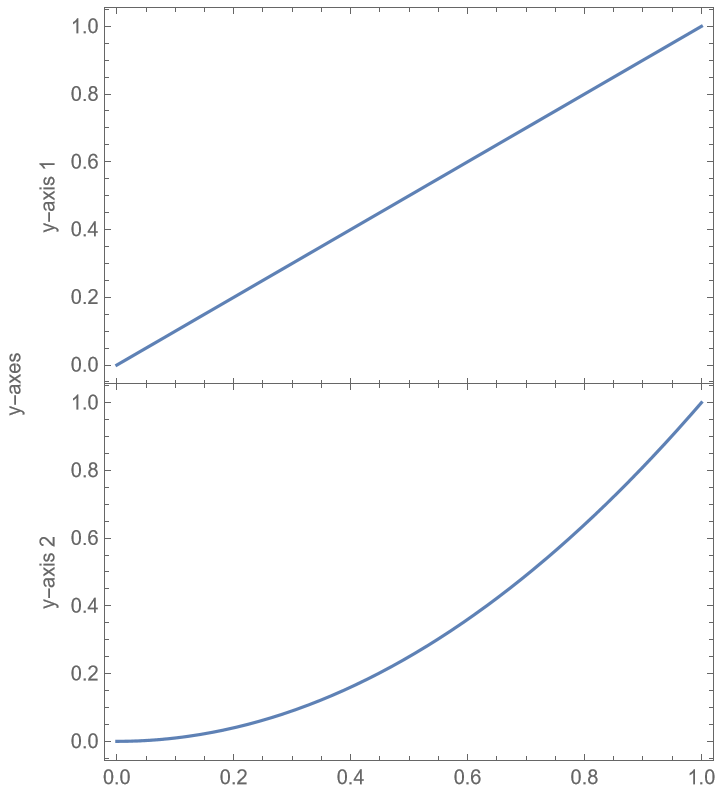
Label both individual frame axes and the whole group:
FrameStyle (2)
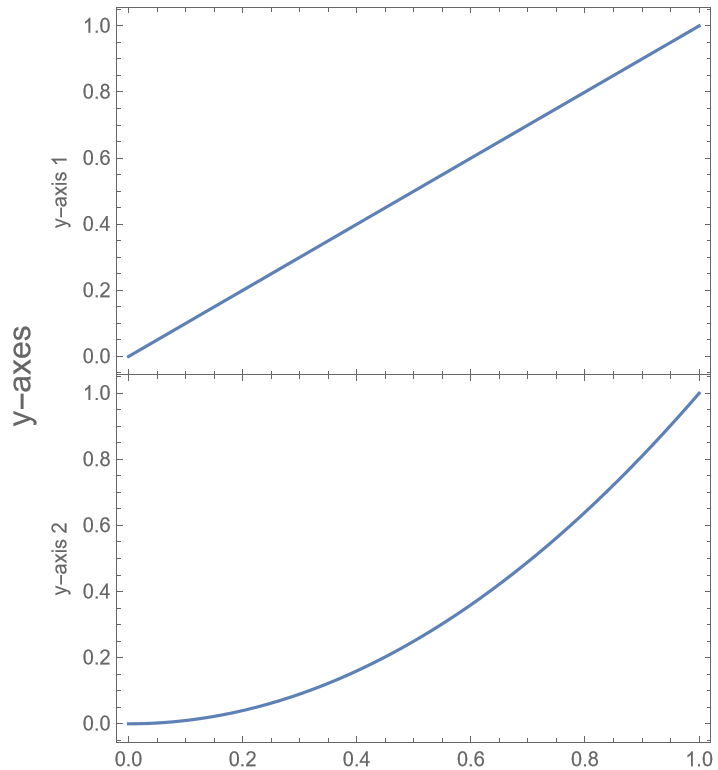
The setting for FrameStyle affects the frame labels shared by all plots:
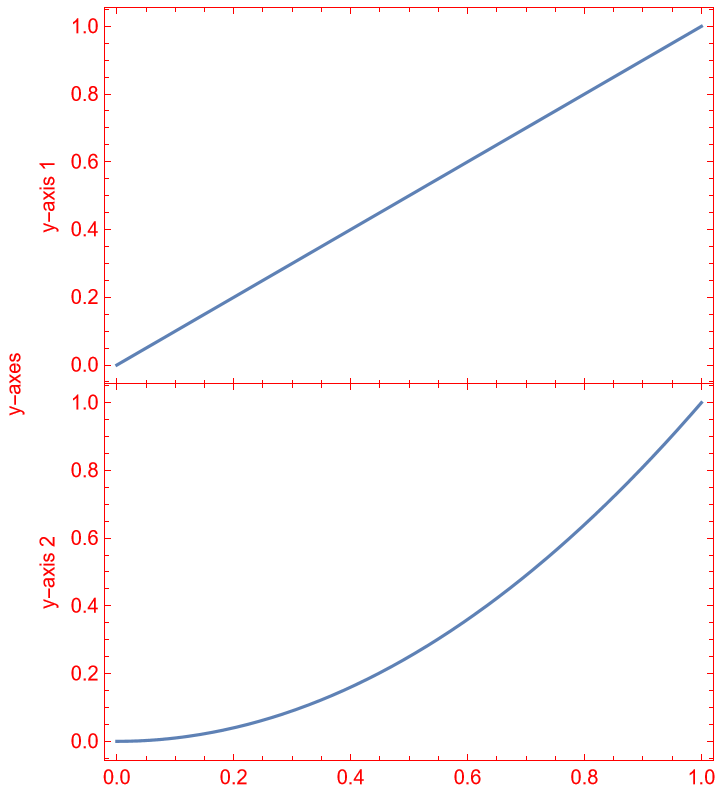
With the default setting FrameStyle→Automatic, the style is inherited from the first plot:
ItemSize (5)
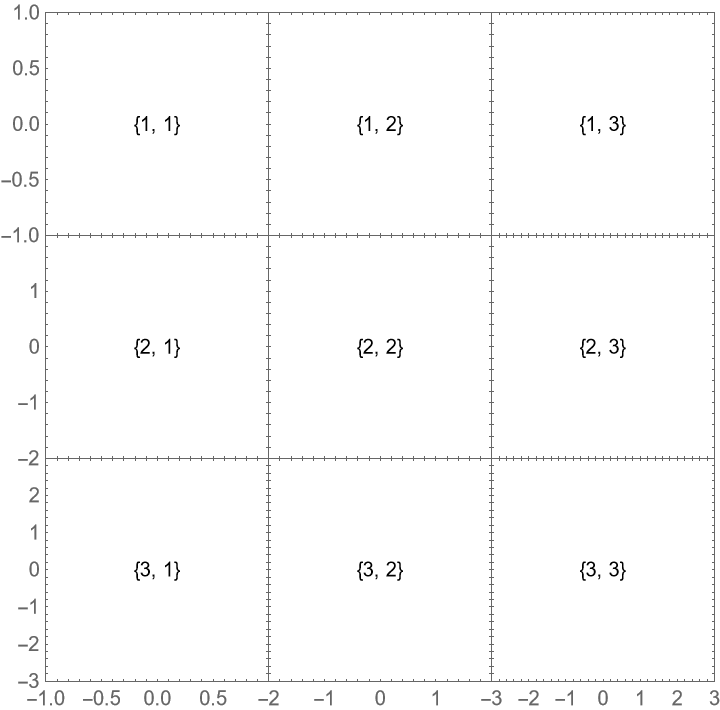
With the default setting ItemSize→Automatic, all rows and columns have the same size:
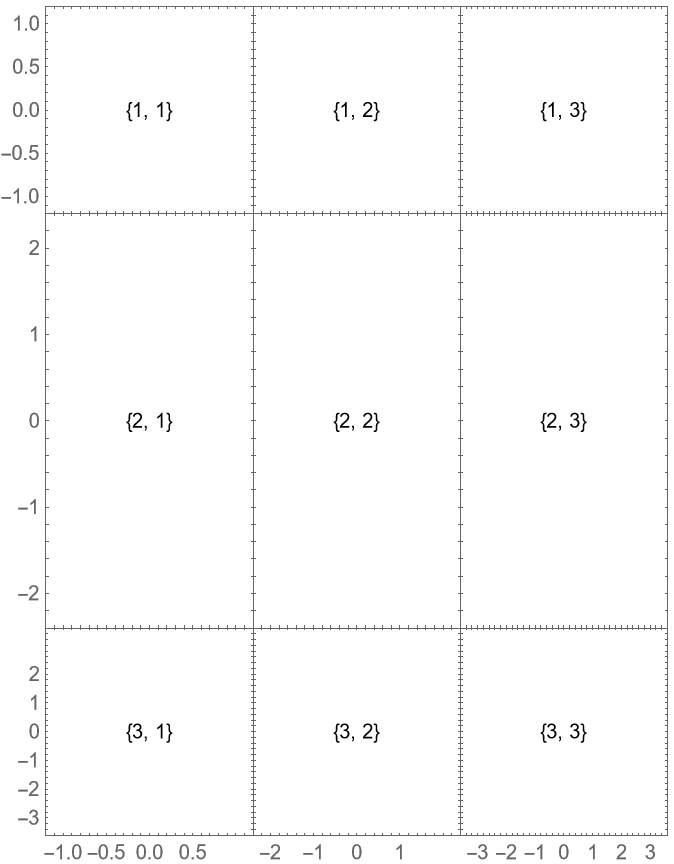
Make the middle row twice as high:
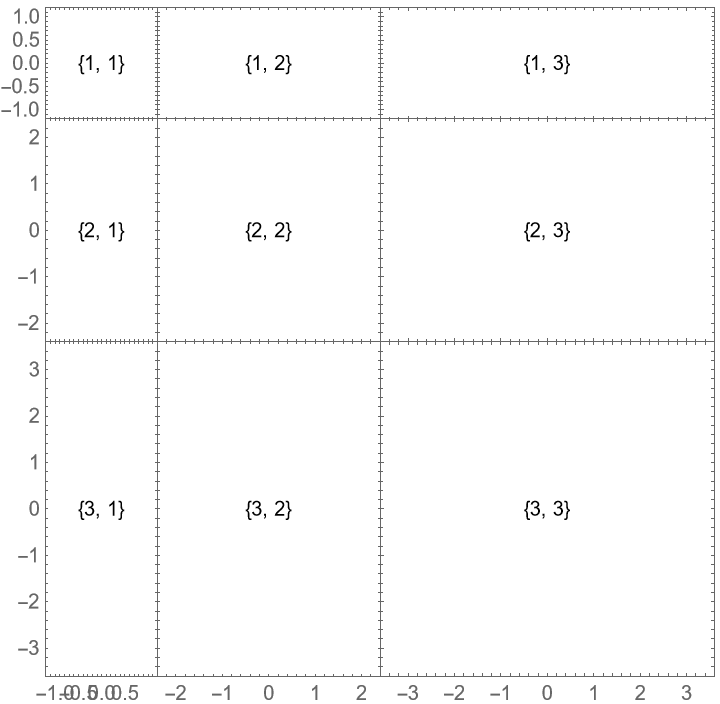
Size the rows and columns according to the plot ranges:
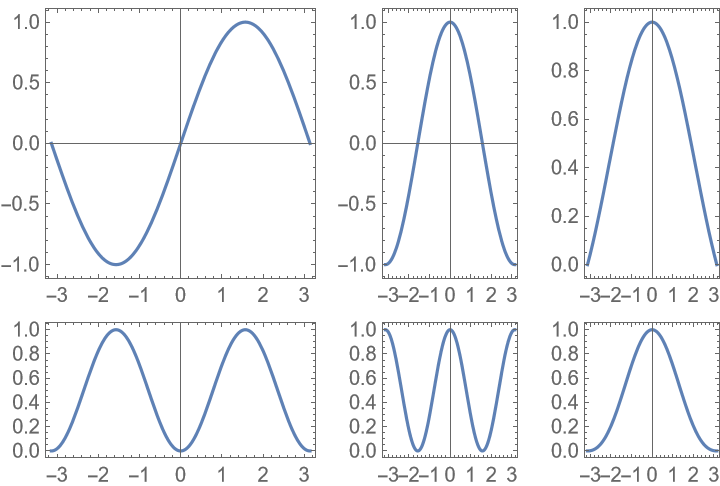
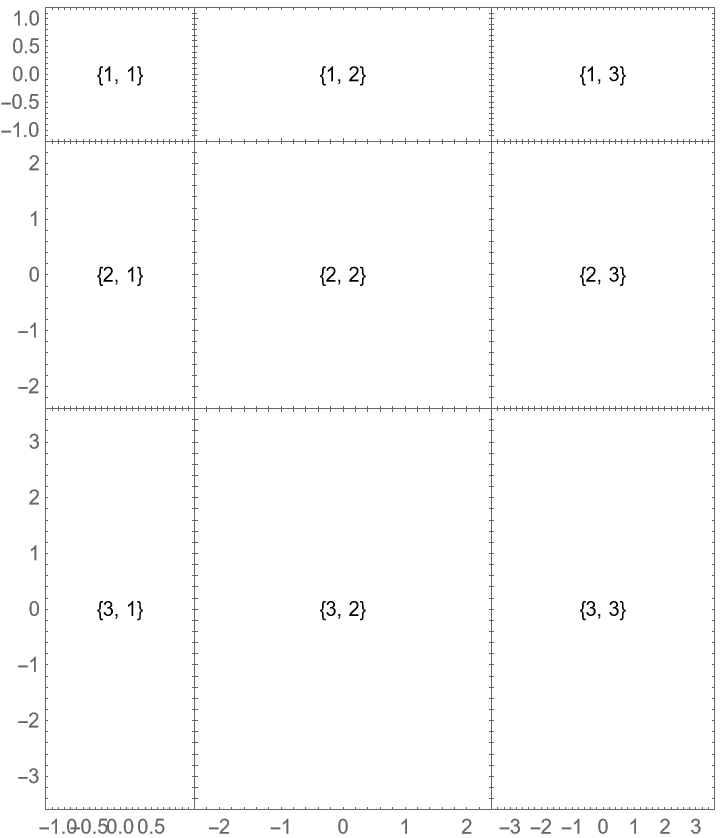
Size the rows and columns according to the plot ranges, but make the third column half as wide:
Make the first row and column 100 printers points big:
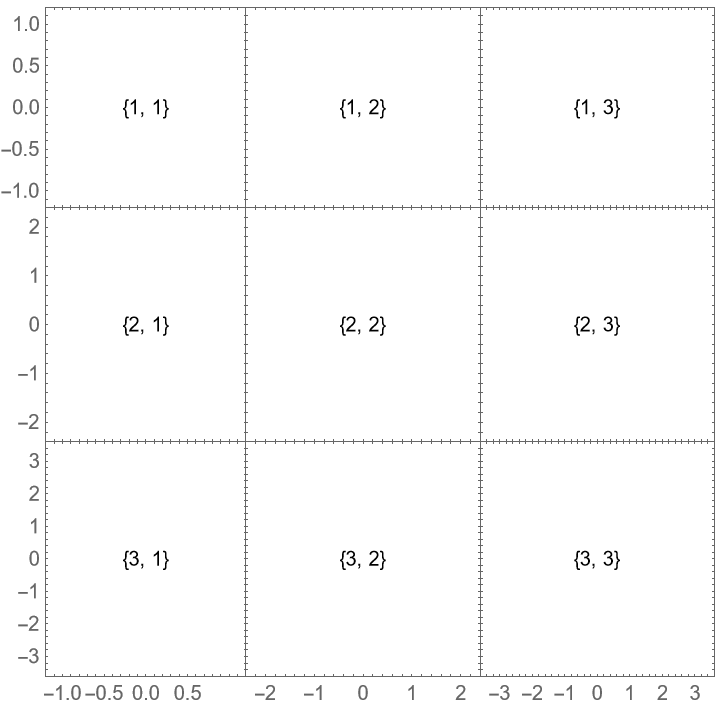
The remaining space is dynamically filled by the remaining rows and columns:
Spacings (5)
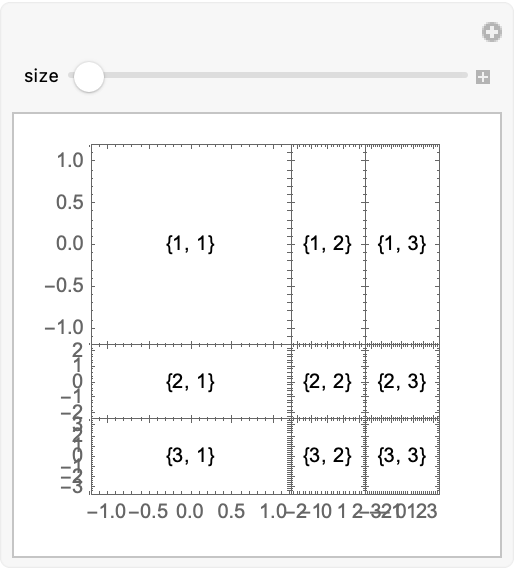
With the default setting Spacings→None, no space is left between rows and columns:
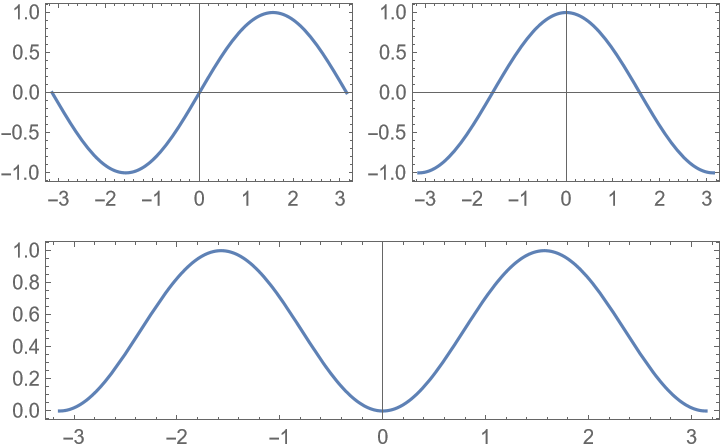
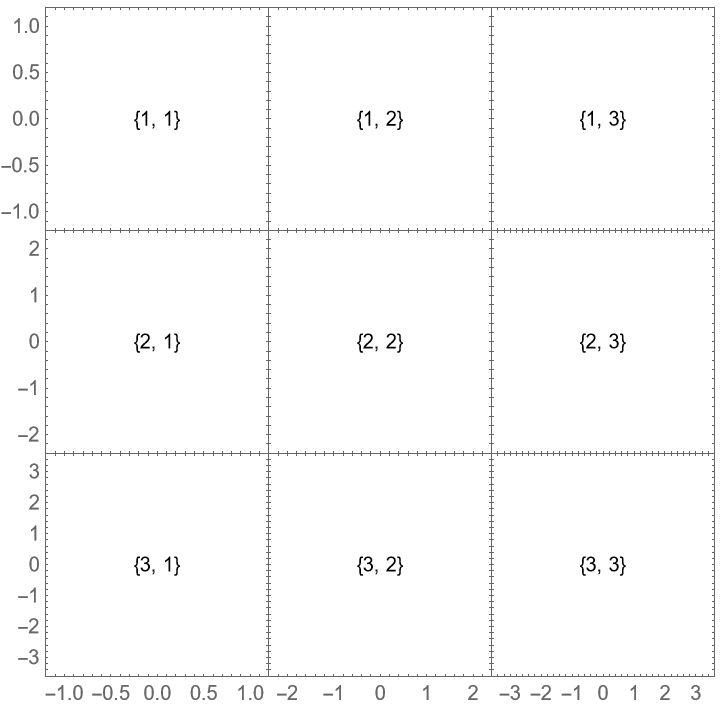
Separate plots by 30 printers points:
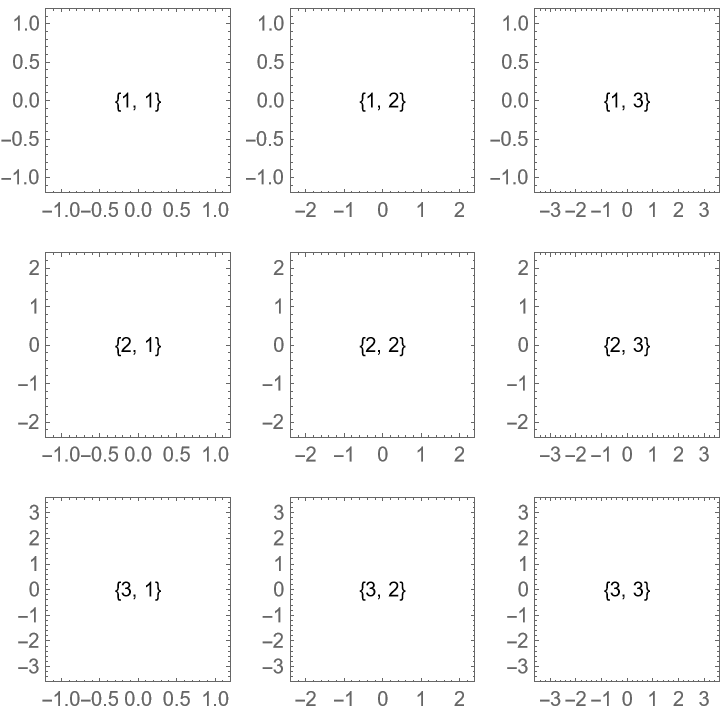
Separate plots by 10% of the total plot grid width:
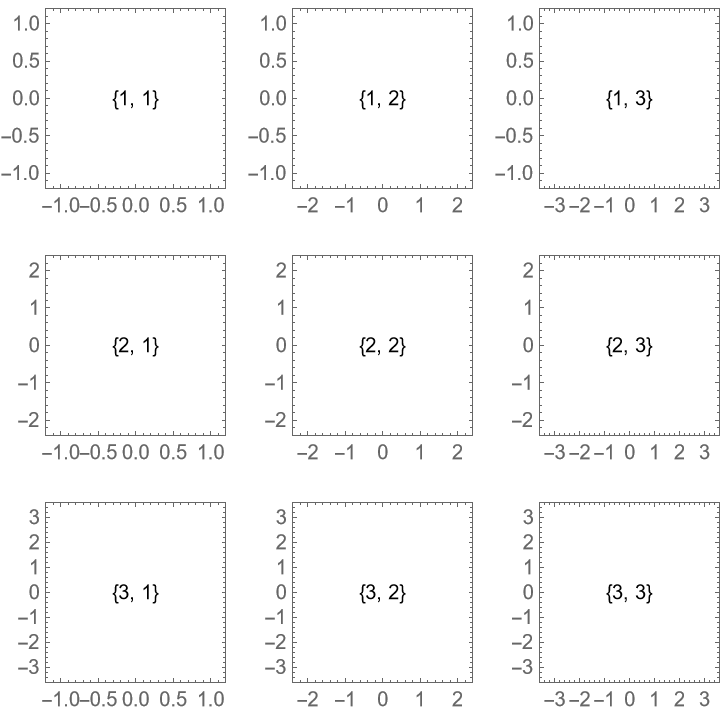
Only insert space between rows:
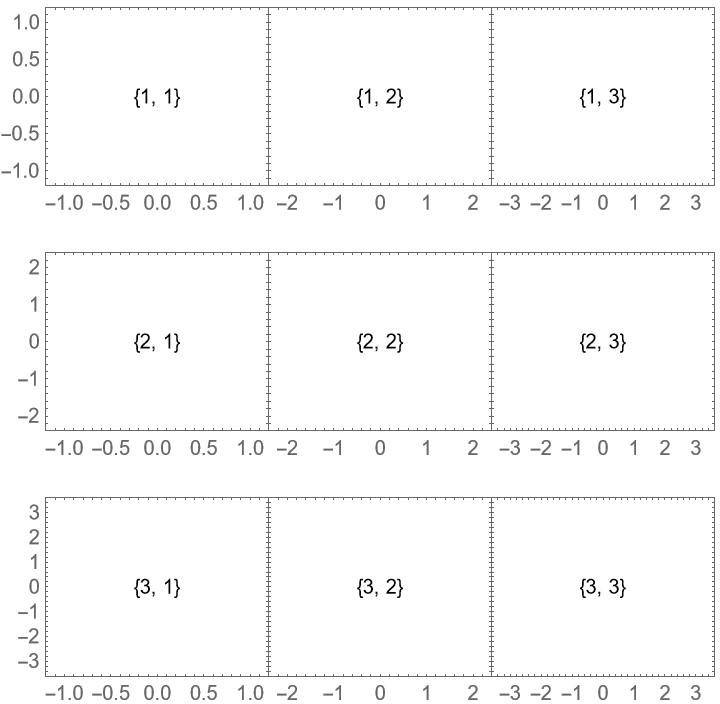
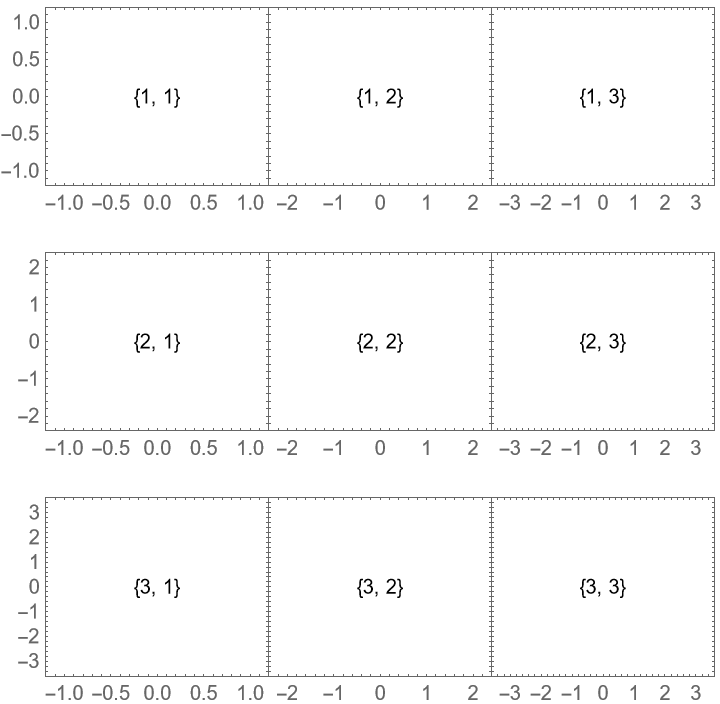
With "ShowFrameLabels"→Full, frame labels and ticks are shown if there is a gap:
PlotRange (5)
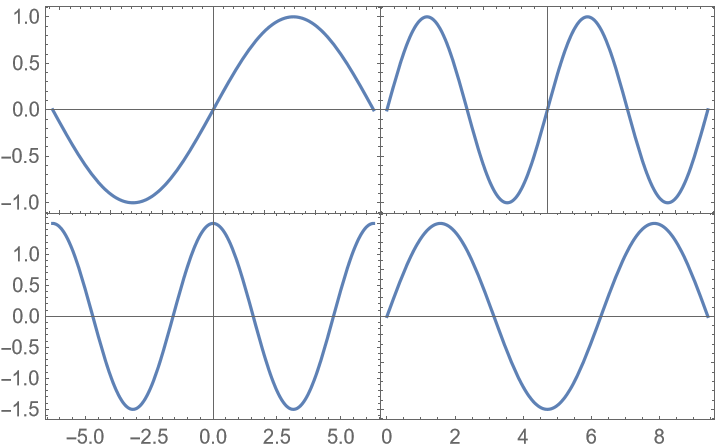
With the default setting PlotRange→Inherited, the plot ranges of the plots are left unmodified:
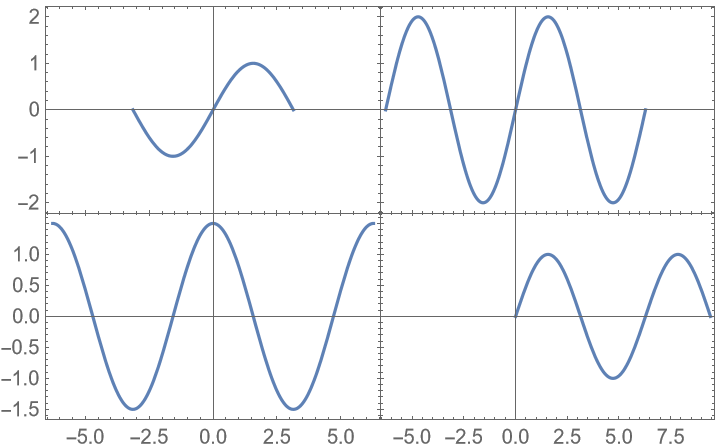
Ensure that the plot ranges of the plots are consistent while showing all data:
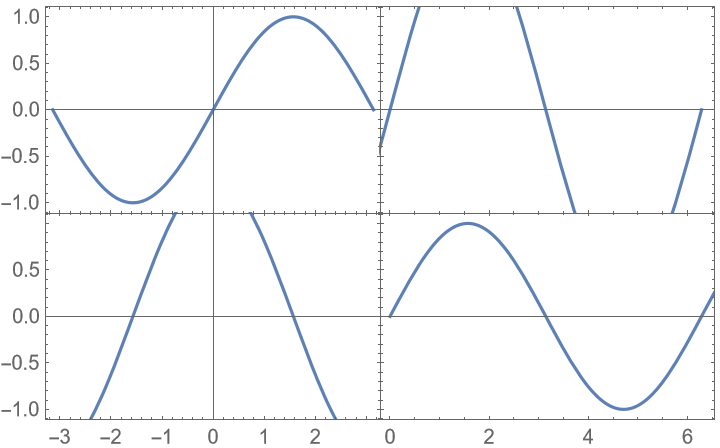
Use a reduced plot range to ensure all plots are filled out:
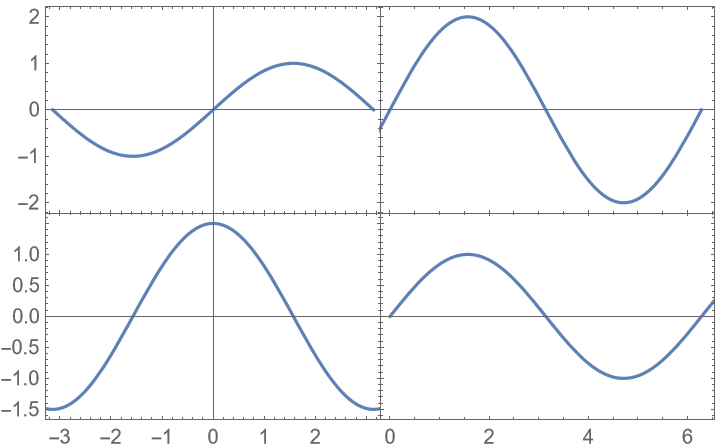
Show everything in the vertical range, but crop the horizontal range to the common part of the ranges:
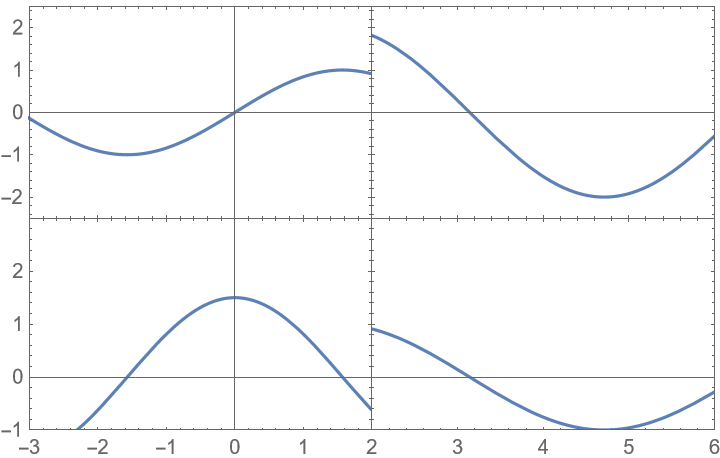
Use explicit settings for the plot ranges, using Directive instead of {…} to prevent ambiguity:
PlotLabels (8)
With the default setting PlotLabels→None, the plots are not labeled:
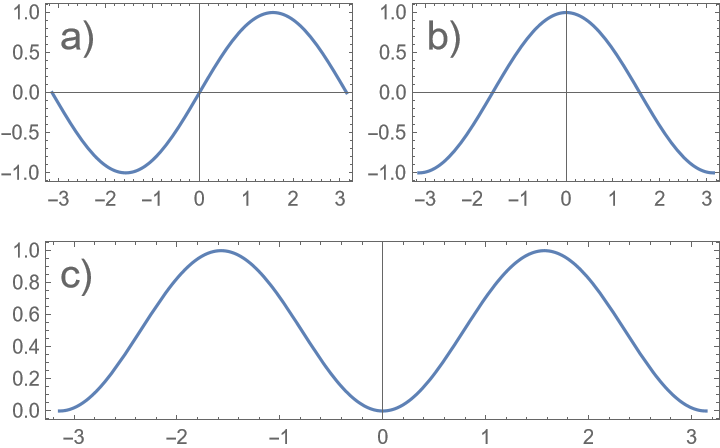
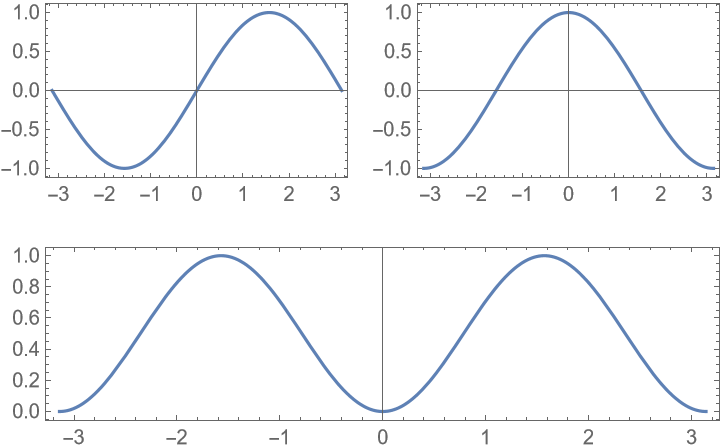
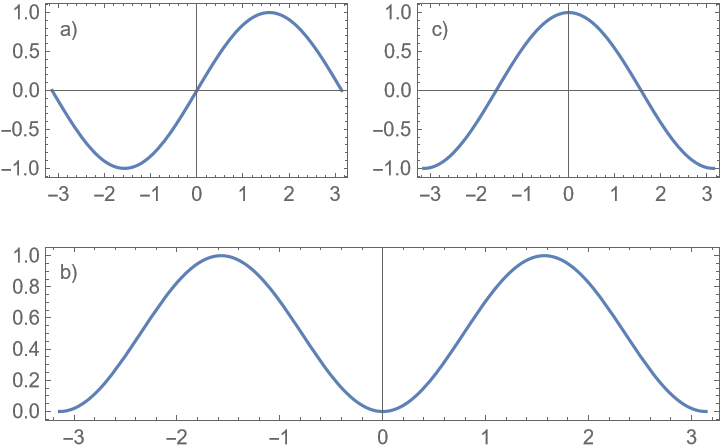
Label the plots columns first using a), b), …:
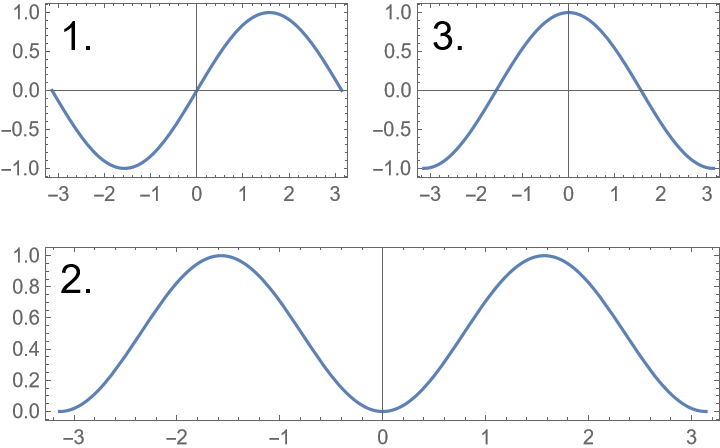
Apply styling to the labels and use sequential numbers:
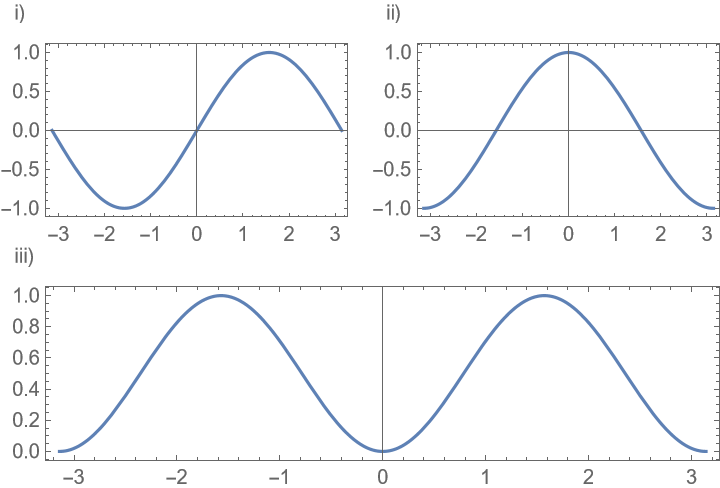
Place the labels outside the plots and number rows first:
The base style of the labels is affected by LabelStyle:
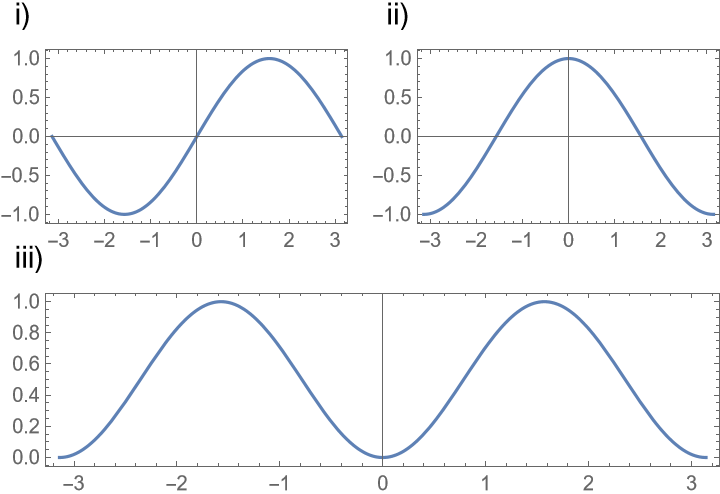
Add an additional custom label to one of the plots using a Labeled wrapper:
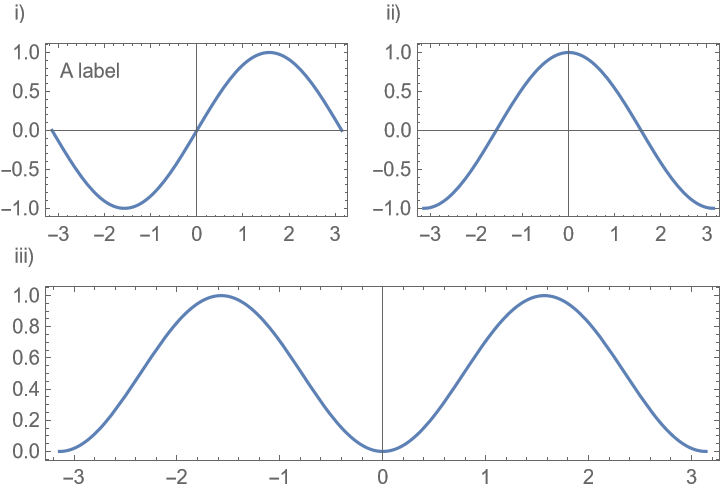
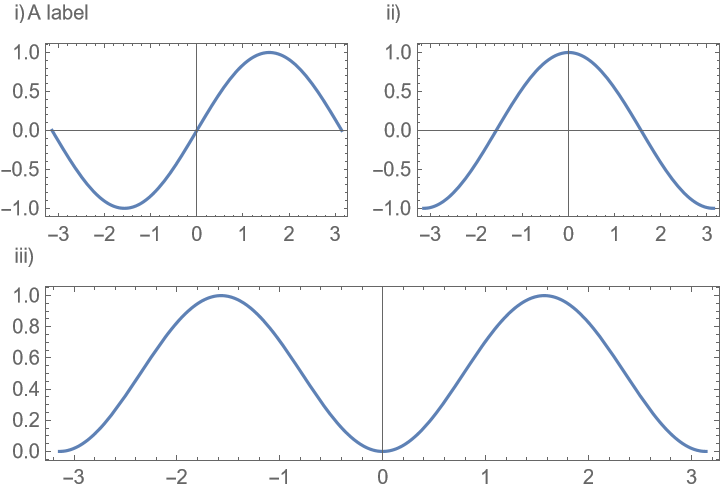
If the same position is specified for multiple labels, overlap is automatically avoided:
Number plots automatically, but add an additional description to each plot:
LabelingFunction (4)
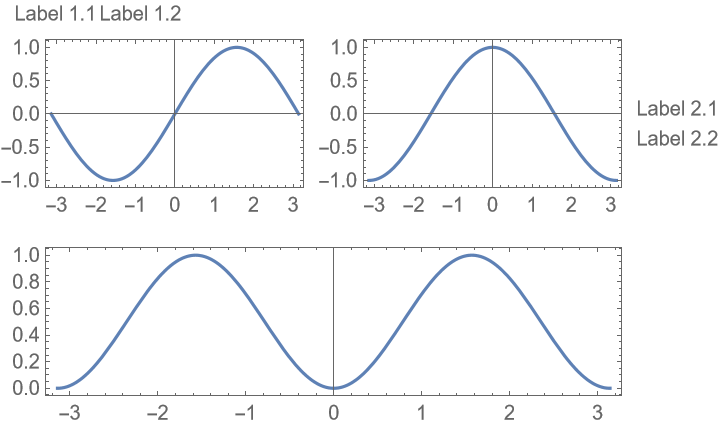
With the default setting LabelingFunction→Automatic, labels with the same position are put into a row/column, depending on the position of the labels:
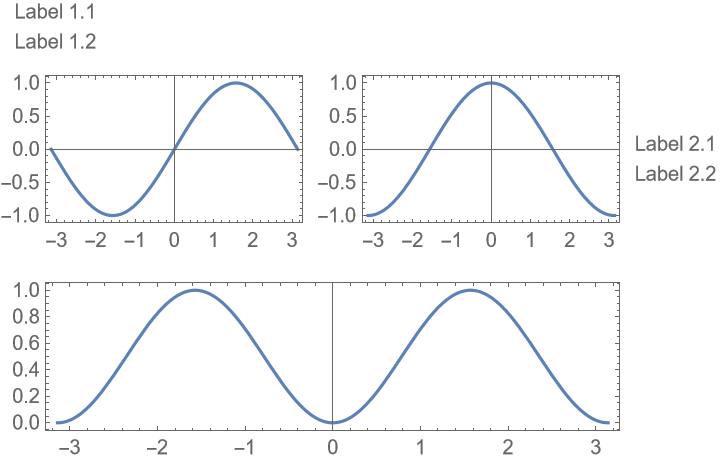
Stack all labels vertically:
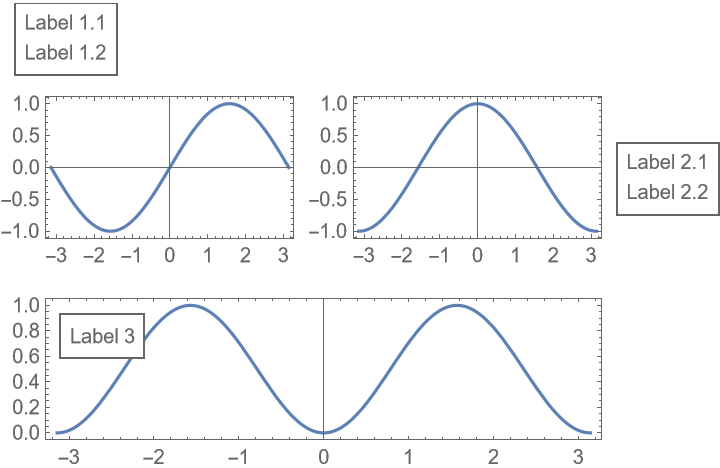
Put frames around the labels:
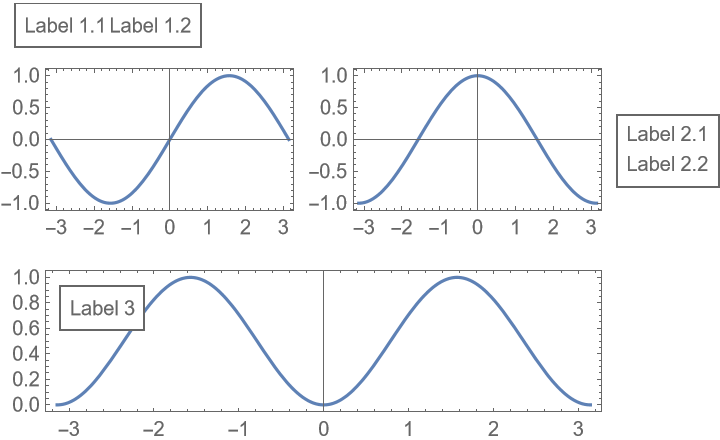
Put frames around the labels, but preserve the automatic layout:
Prolog & Epilog (2)
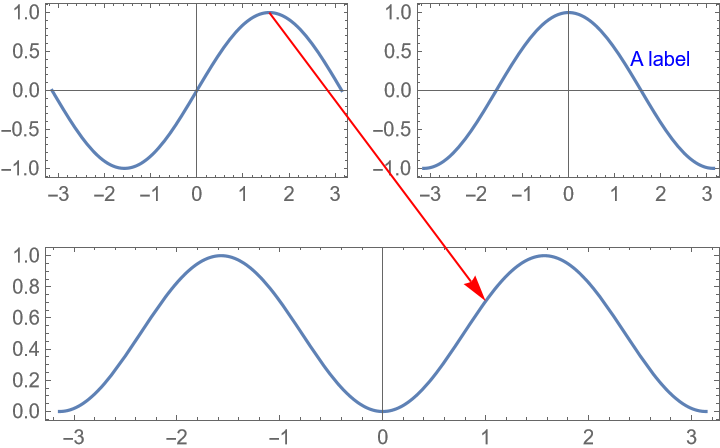
Positions inside Prolog and Epilog can be of the form {i,j}→pos to specify positions relative to the plot with index {i,j}:
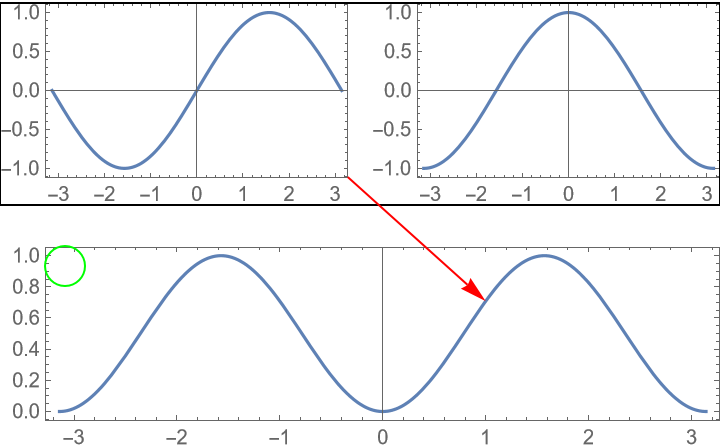
Positions can also be of type Scaled[…], ImageScaled[…], and Offset[…]:
ShowFrameLabels (6)
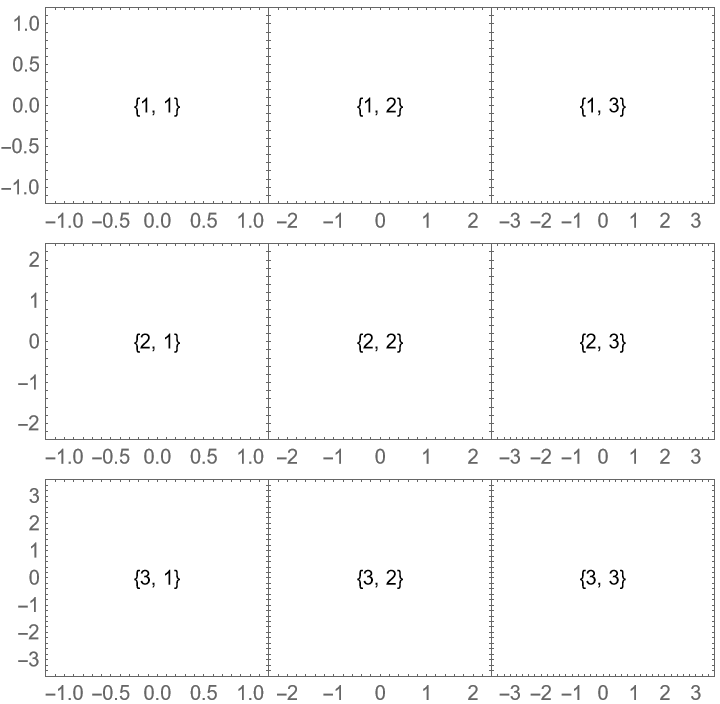
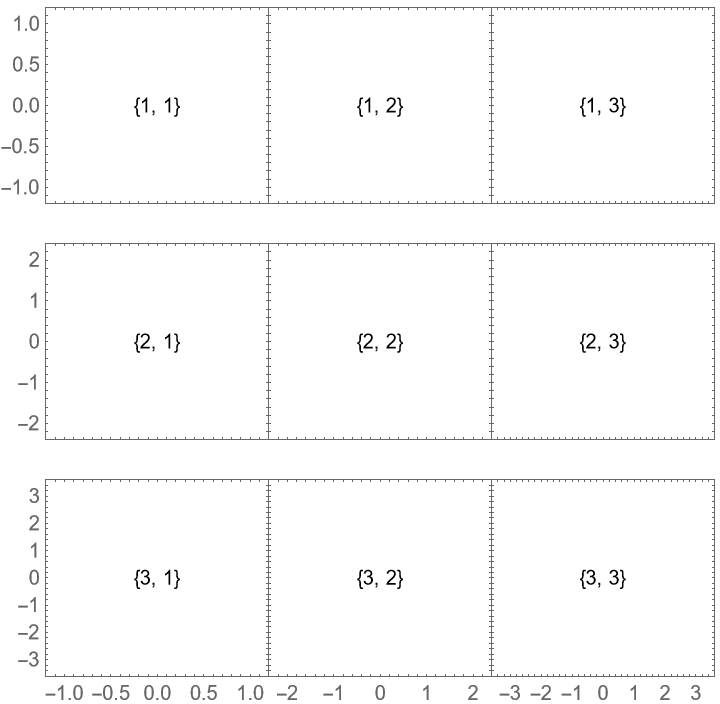
With the default setting "ShowFrameLabels"→Full, frame ticks and labels are shown if there is no adjacent plot or a spacing:
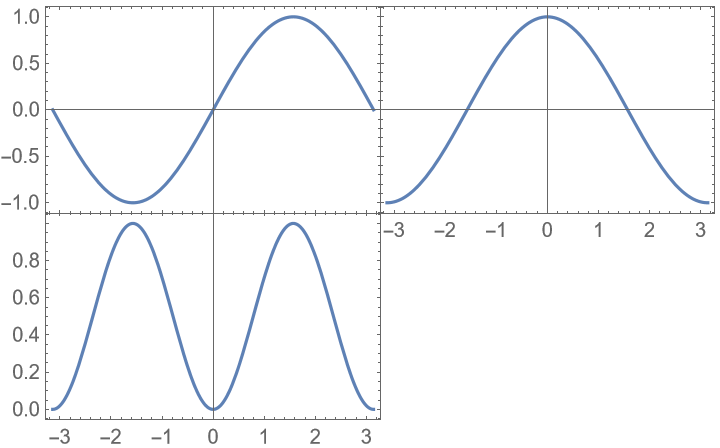
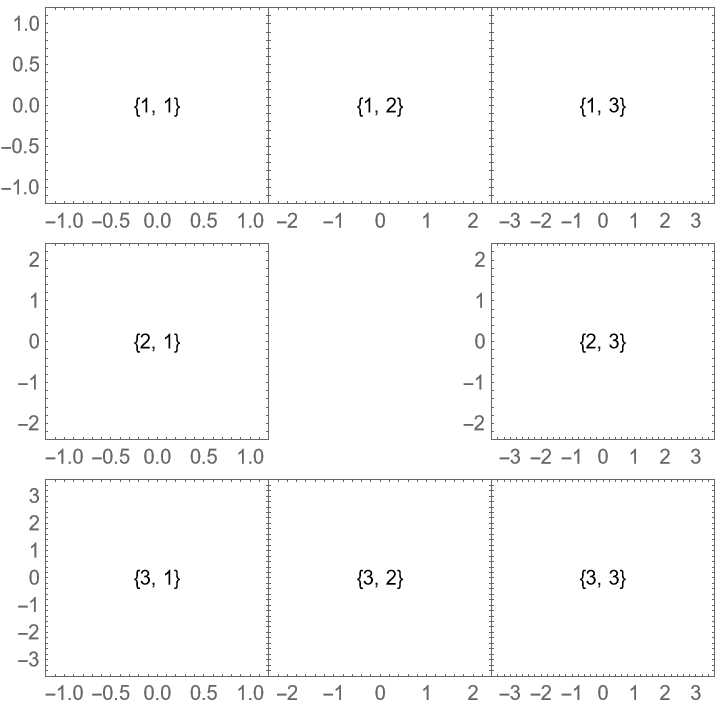
Labels are shown if a plot is omitted:
Hide all labels unless there is no adjacent plot at all:
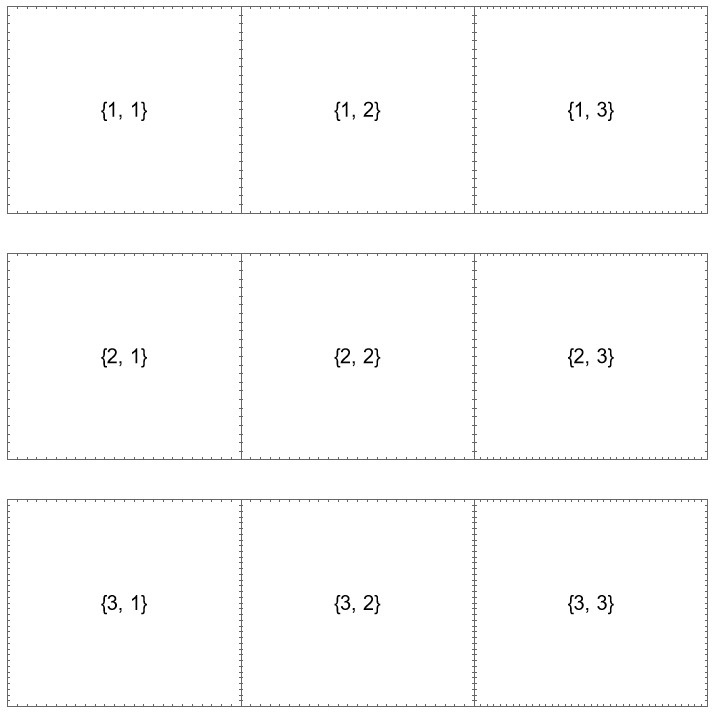
Show no frame labels:
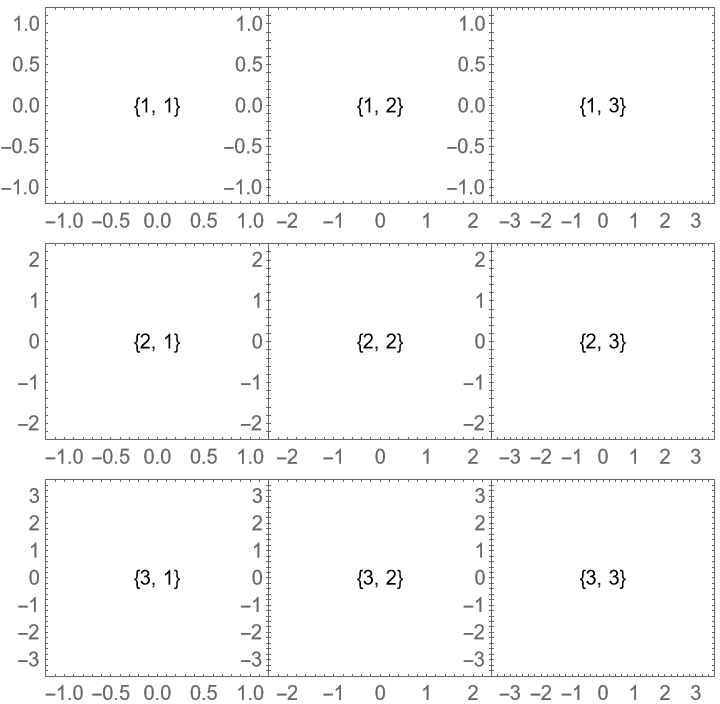
Show all frame labels:
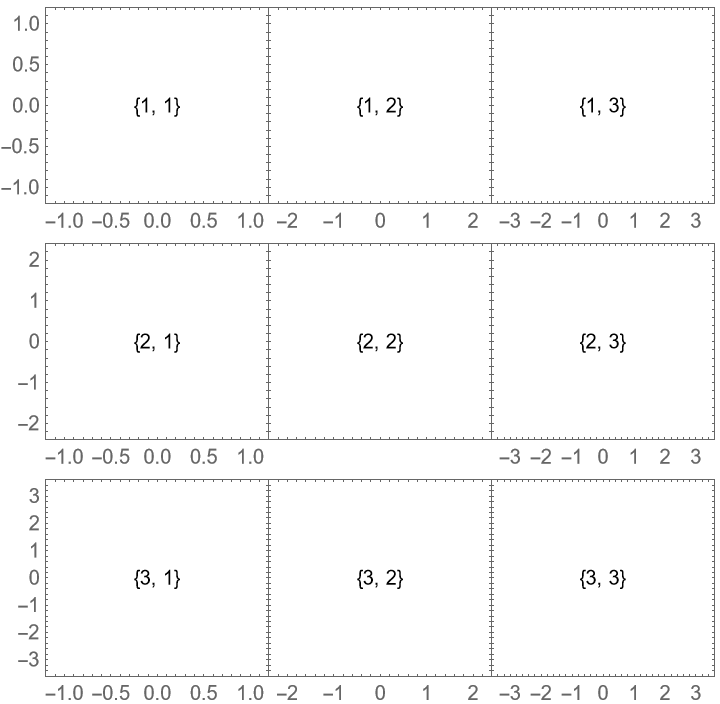
Hide frame labels of the center plot using a Frame[plot,…]-type wrapper:
HideOuterTickLabels (6)
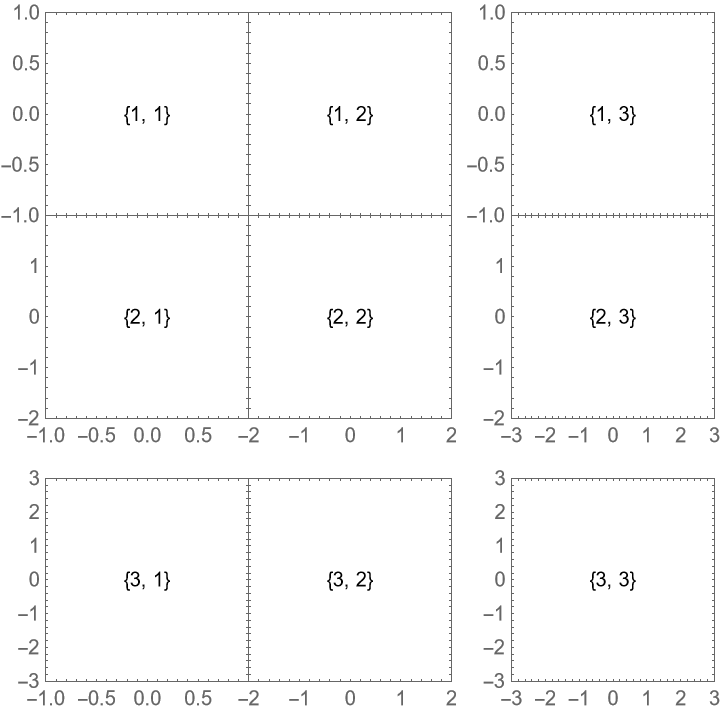
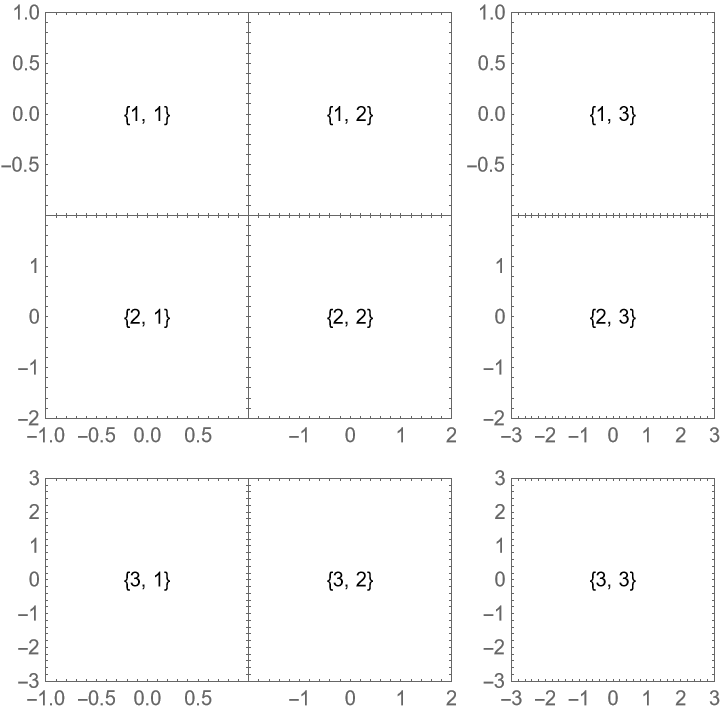
With the default setting "HideOuterTickLabels"→Full, the rightmost tick label on each plot to the left of another plot is hidden if there is insufficient Spacings. Similarly, the topmost tick label on each plot below another plot is hidden:
Hide the labels on both plots, not only the left/bottom one:
Also hide outer labels if there is spacing between the plots:
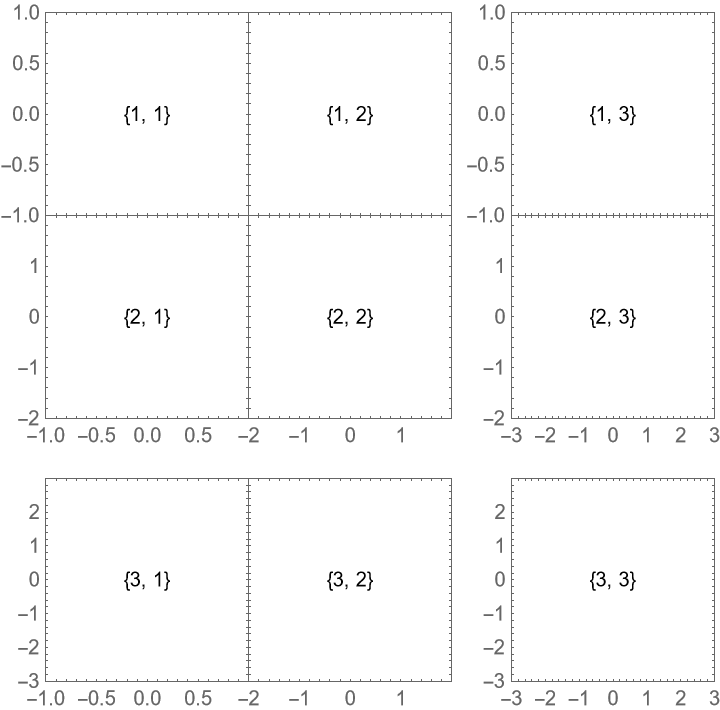
Hide labels in the outer 50% of the plot range instead of the default 10 printers points. The hiding is done in the default locations, meaning only on the top rows and left columns and never on the outermost edges:
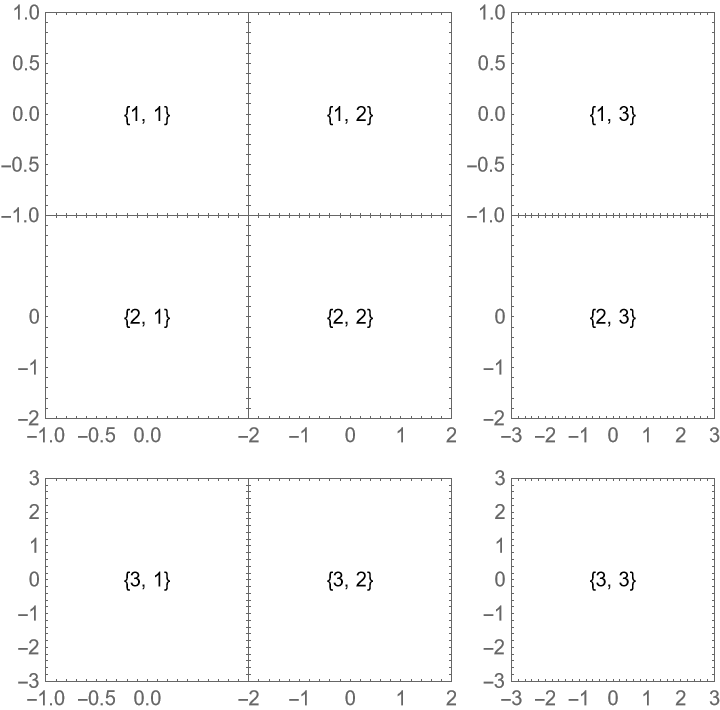
Do not hide any tick labels, potentially causing overlaps:
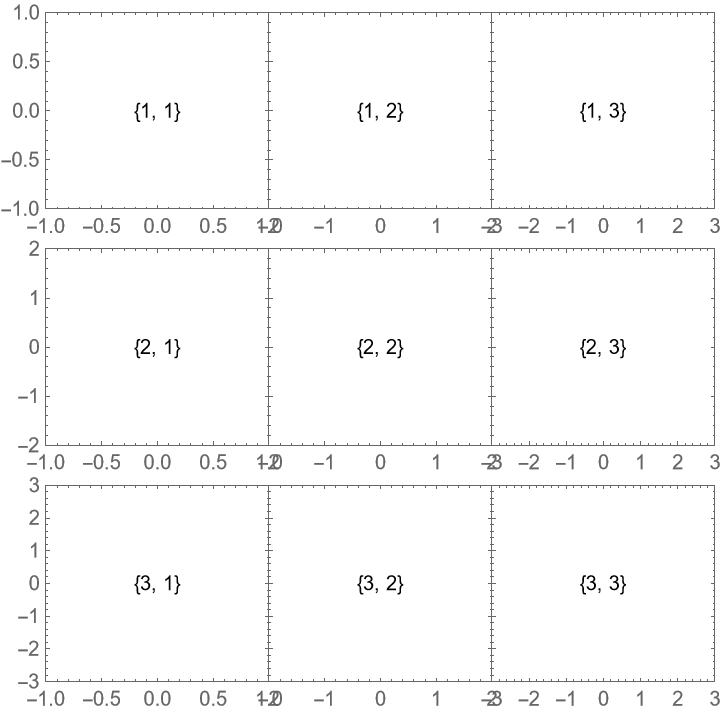
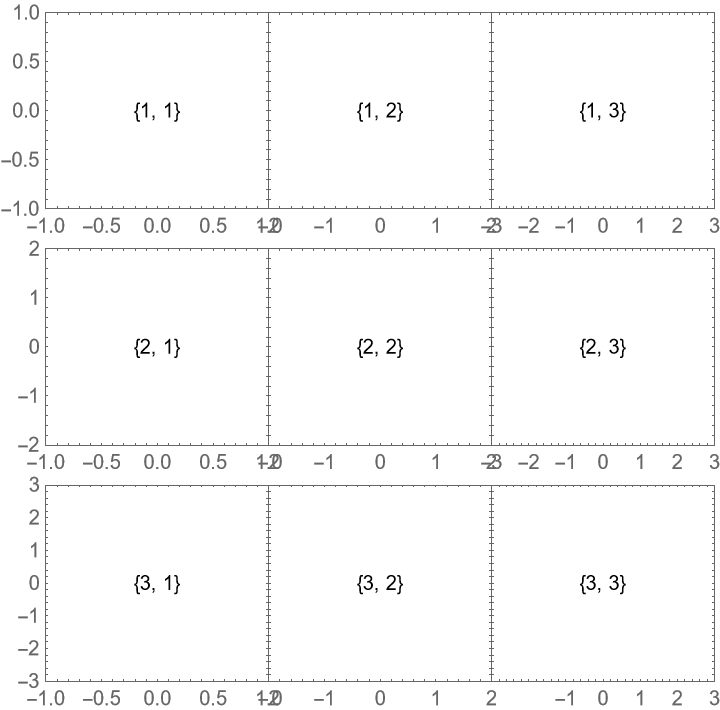
Hide the outer ticks on the lower right plot only by specifying the setting using a Frame[plot,…]-type wrapper:
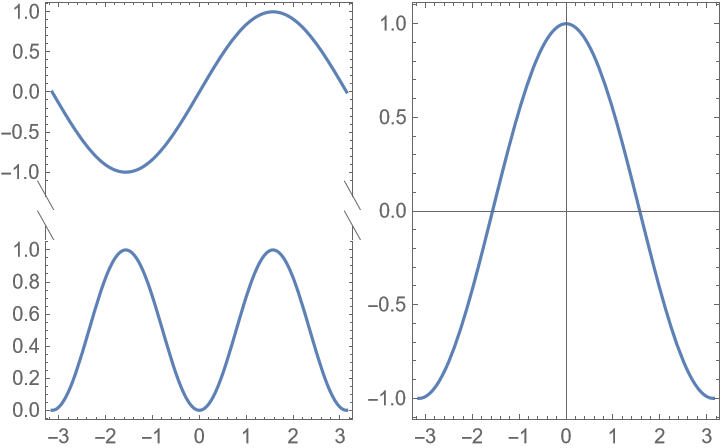
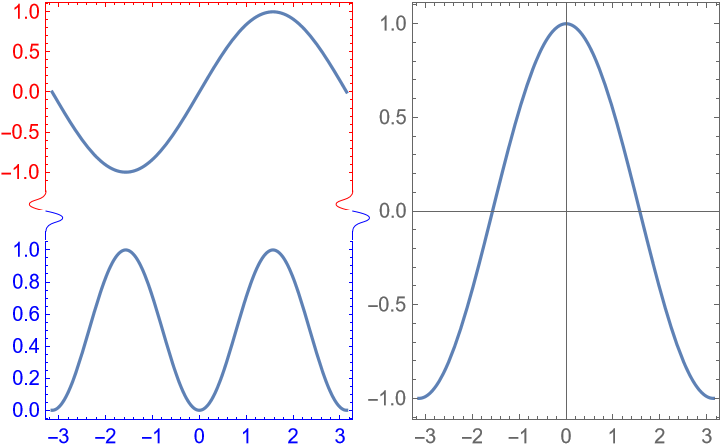
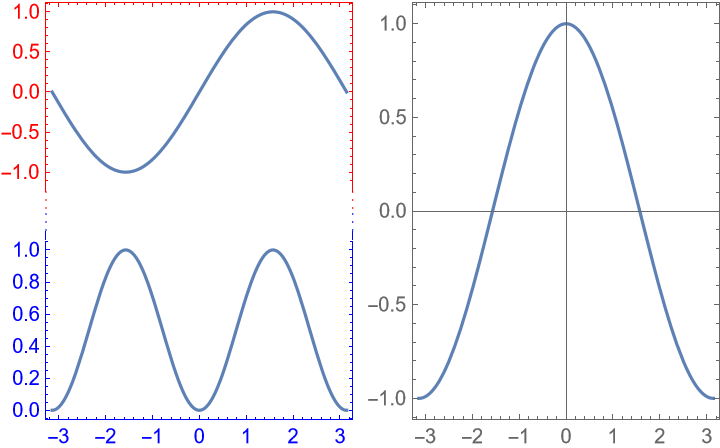
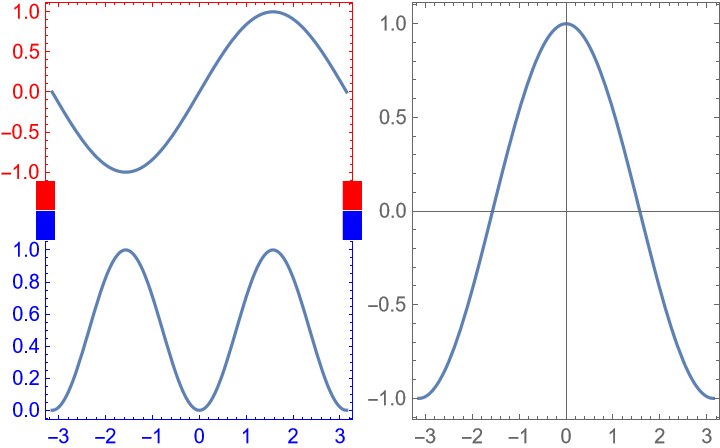
MergeAxes (7)
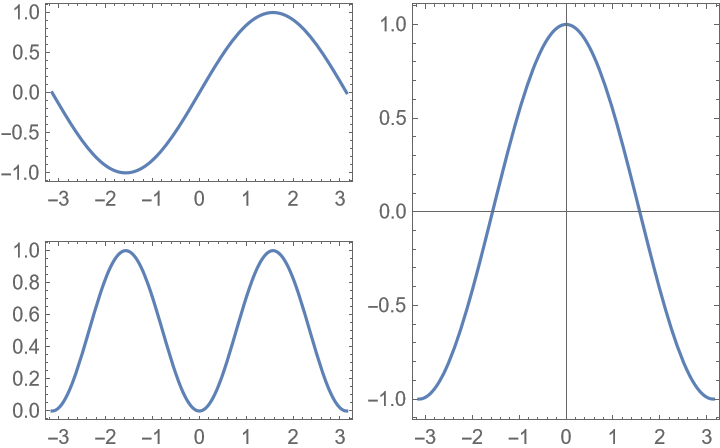
With the default setting "MergeAxes"→False, the axes of the plots are not merged:
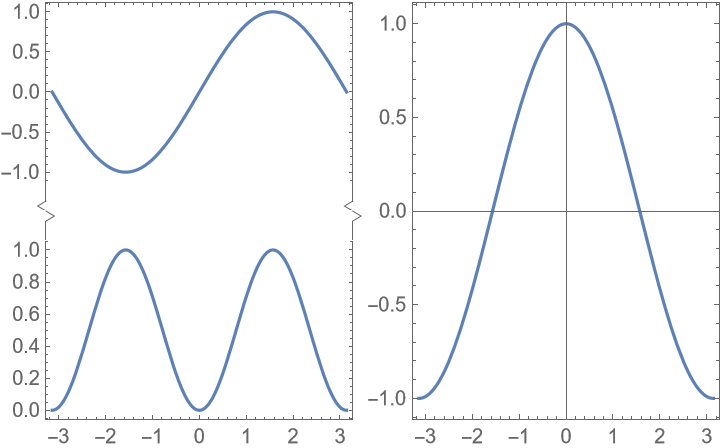
Merge the axes of the left two plots using a zig-zag line:
Use a cut-type indicator instead, and make the gap larger:
The frame styles of both plots are inherited:
Specify which axes to merge using a Frame[plot,…]-type wrapper instead:
Use a custom merge indicator:
Use a different merge indicator on each side of the gap:
PerformanceGoal (1)
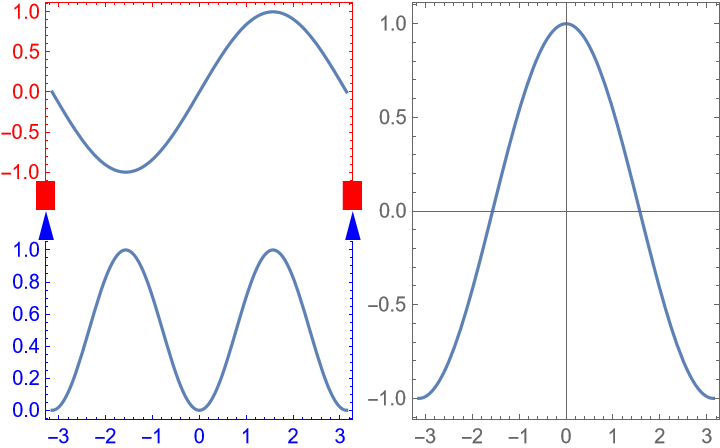
Setting PerformanceGoal to "Speed" can drastically improve the performance when resizing the plot grid due to an issue in the front end related to custom ticks:
Method (4)
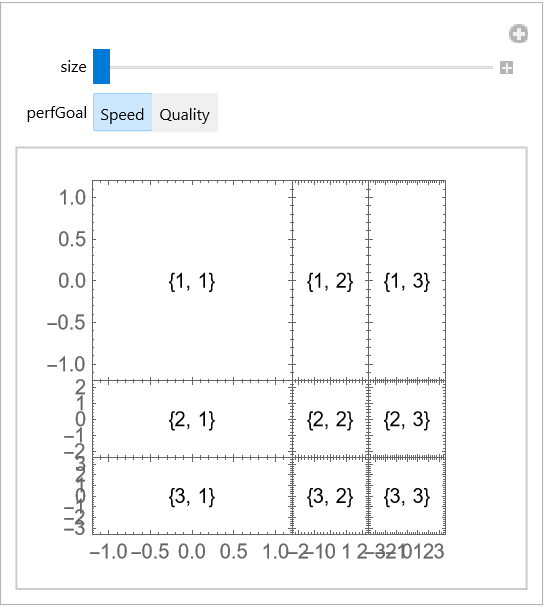
With the default setting "FixFrameTicks"→True, the tick length is corrected to appear as expected:
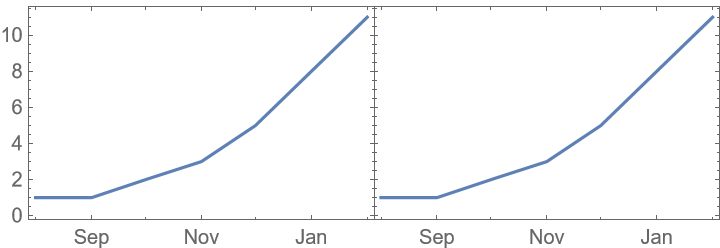
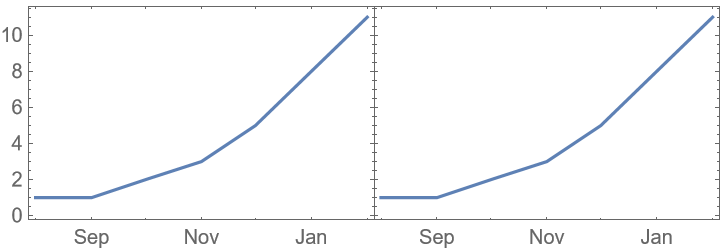
Turning the fix off might yield unexpected results:
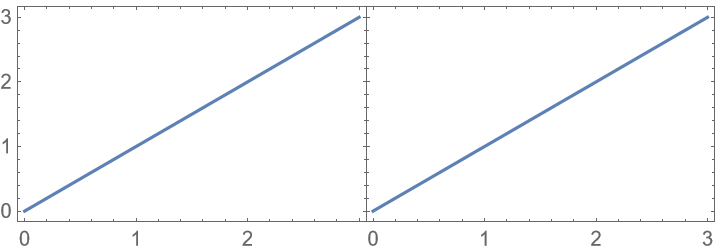
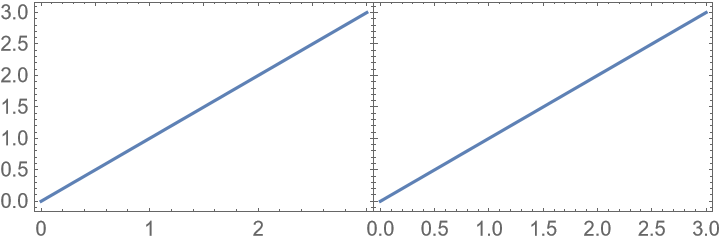
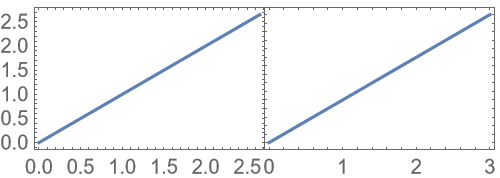
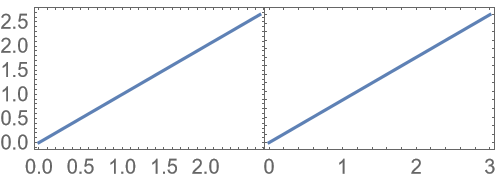
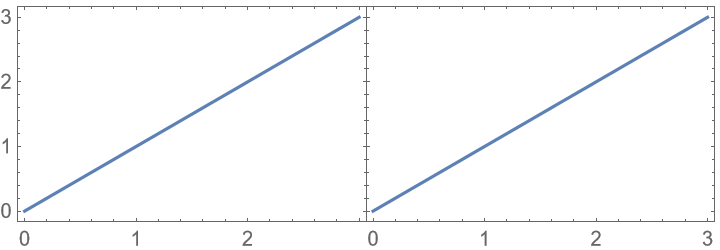
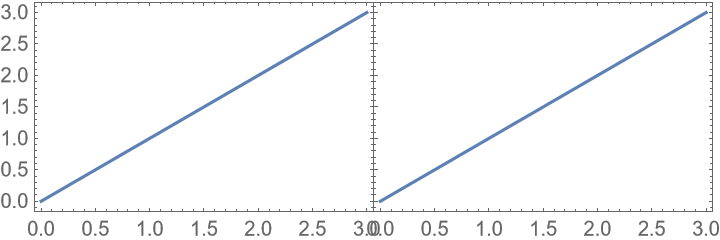
With the default setting "AllCustomTicks"→Automatic, ticks are ensured to be uniform, even if this means differences to the default tick positioning:
Use "AllCustomTicks"→False to use custom ticks only where necessary, e.g. to hide tick labels selectively:
Possible Issues (8)
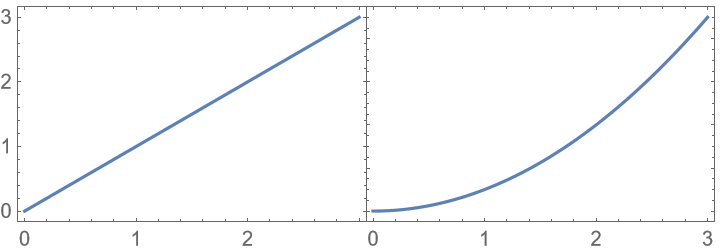
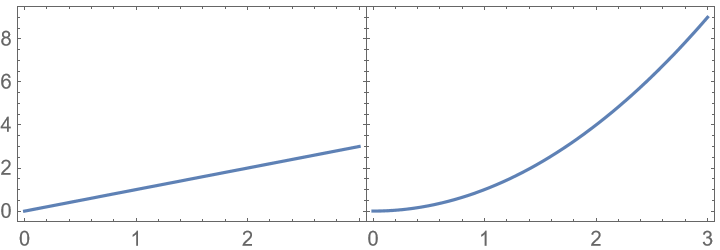
PlotGrid assumes that plots have compatible plot ranges:
Use the option PlotRange to enforce consistent plot ranges:
Tick labels are hidden based on the size the grid is generated with; therefore, changing it later might lead to unexpected results:
Specify the size directly instead:
The ticks might sometimes be changed by PlotGrid:
To recover the original ticks, disable both "HideOuterTickLabels" and "AllCustomTicks":
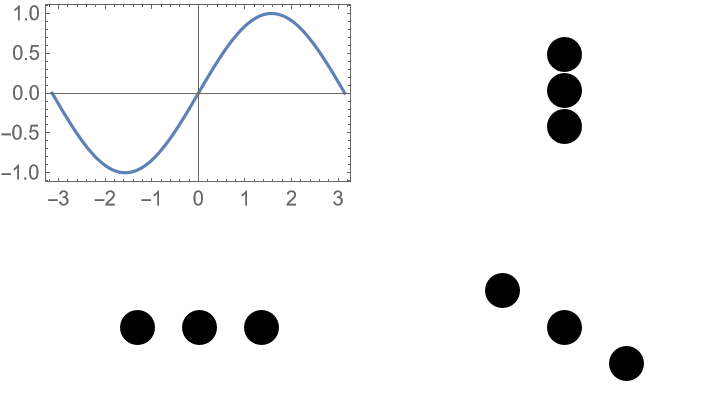
Invalid specifications for spanning plots lead to leftover span indicators:
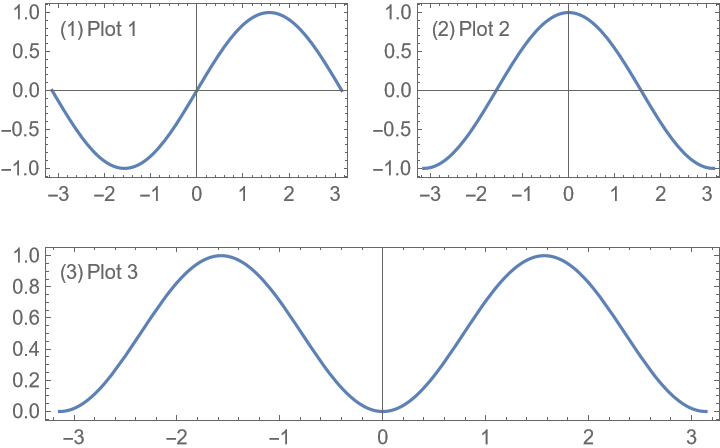
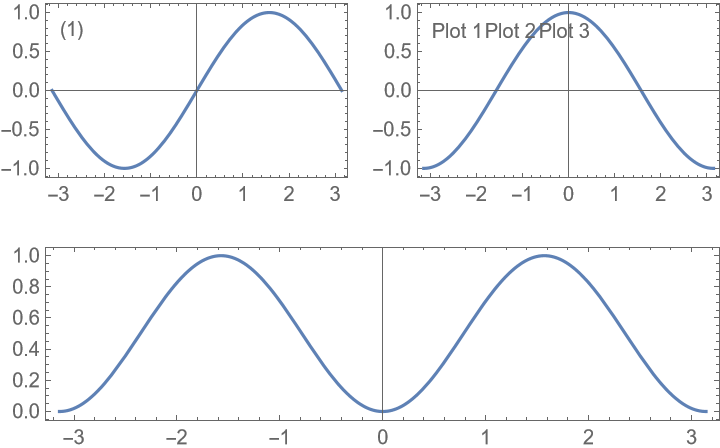
Some label specifications are potentially ambiguous and might be interpreted in an unexpected way:
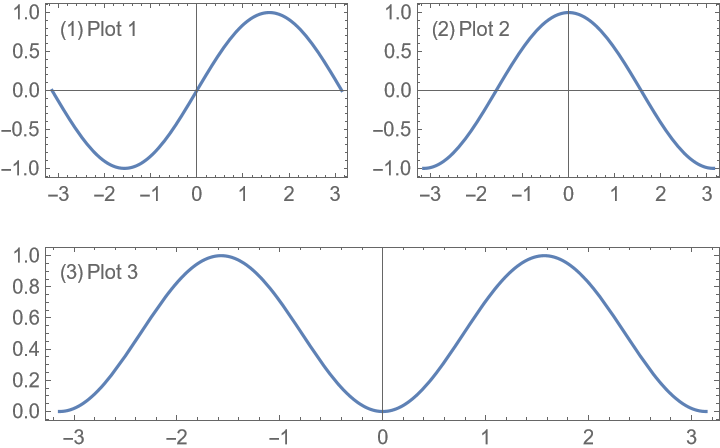
Add an empty two-level label specification to ensure the specification is interpreted as a list of several top-level label lists:
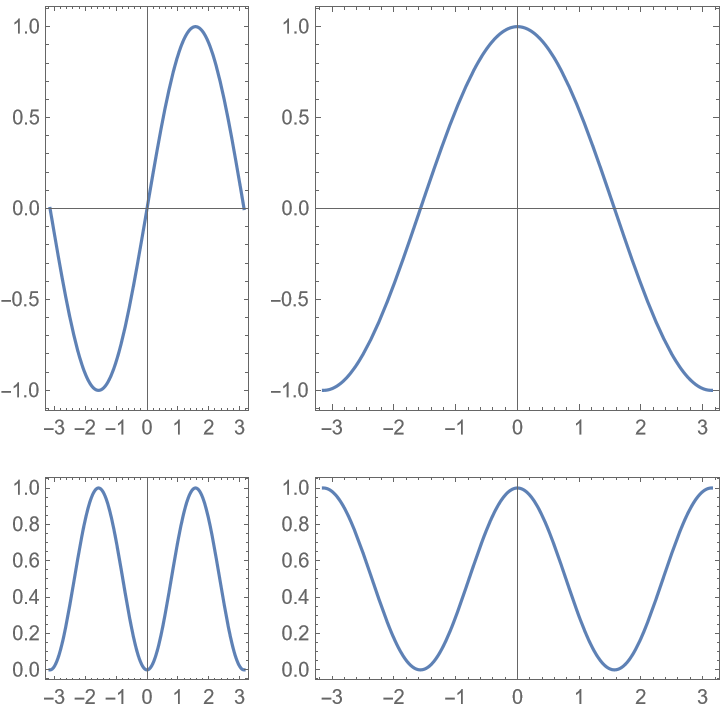
Some settings for AspectRatio will lead to unresolvable constraints on the sizes of the rows and columns:
Remove some of the AspectRatio targets:
Targeting AspectRatio settings for individual plots is not supported when Offset type specifications are used:
Use Scaled[…] type Spacings instead:
Merge indicators are shown in the gap between two plots. Consequently, the indicators cannot be shown if Spacings is effectively set to 0:
Set Spacings to something non-zero to avoid this issue:

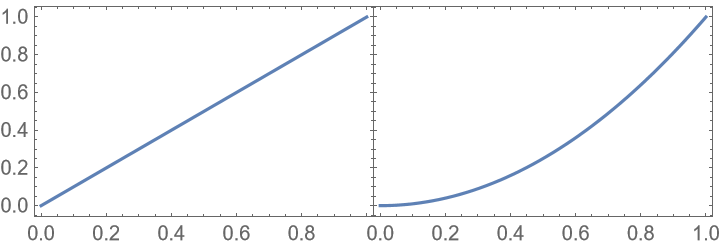
![ResourceFunction["PlotGrid"][
{
{
Plot[x, {x, 0, 1}, Frame -> True],
Plot[x^2, {x, 0, 1}, Frame -> True]
}
}
]](https://www.wolframcloud.com/obj/resourcesystem/images/0c9/0c901f1c-a26c-456a-8626-b51f25a95ec7/61355db910c853e9.png)
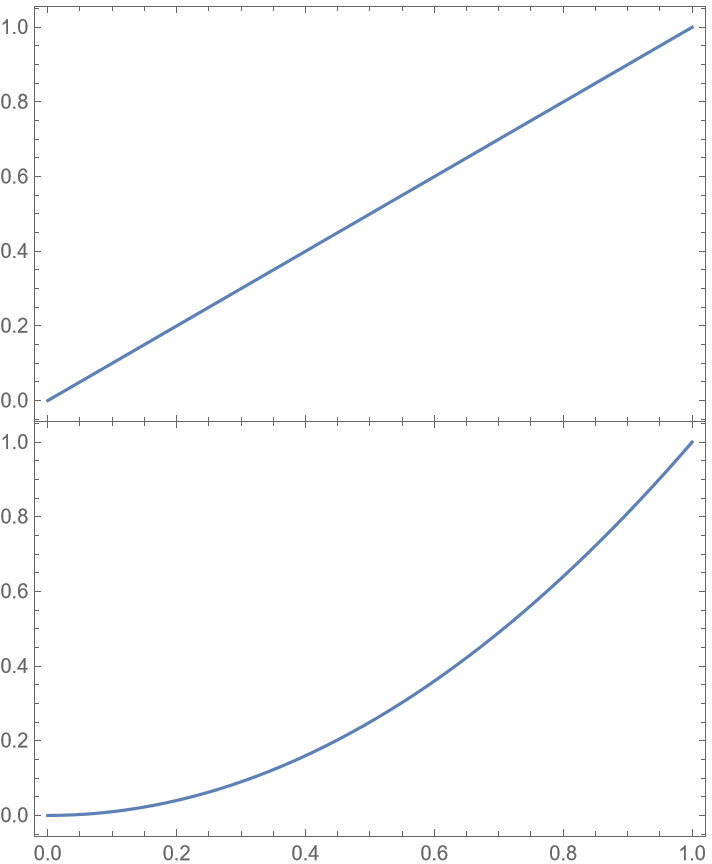
![ResourceFunction["PlotGrid"][
{
{Plot[x, {x, 0, 1}, Frame -> True]},
{Plot[x^2, {x, 0, 1}, Frame -> True]}
}
]](https://www.wolframcloud.com/obj/resourcesystem/images/0c9/0c901f1c-a26c-456a-8626-b51f25a95ec7/2330cdb81b757d6c.png)
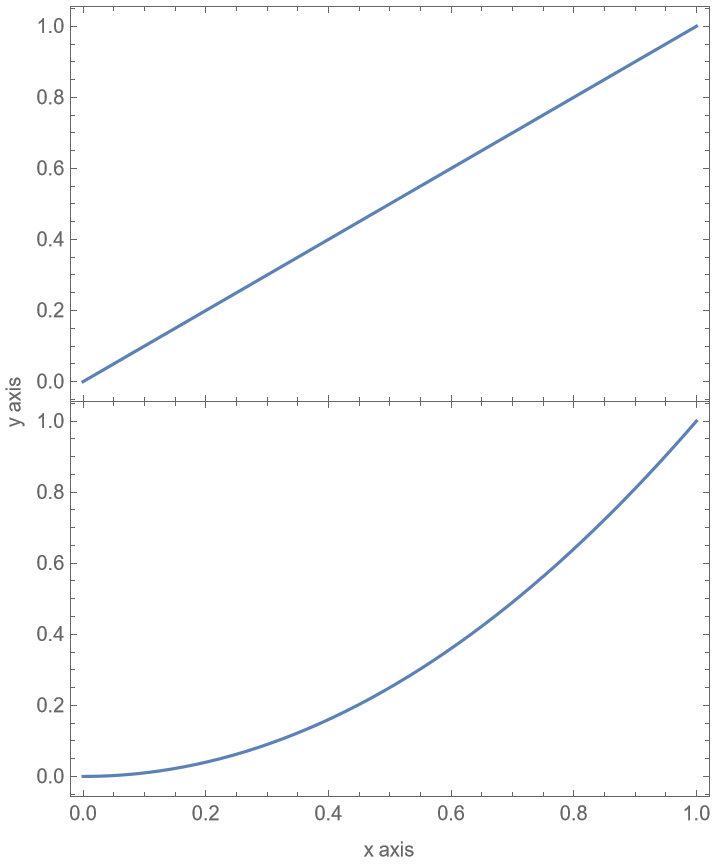
![ResourceFunction["PlotGrid"][
{
{Plot[x, {x, 0, 1}, Frame -> True]},
{Plot[x^2, {x, 0, 1}, Frame -> True]}
},
FrameLabel -> {"x axis", "y axis"}
]](https://www.wolframcloud.com/obj/resourcesystem/images/0c9/0c901f1c-a26c-456a-8626-b51f25a95ec7/43f28bfec77dedb1.png)
![ResourceFunction["PlotGrid"][
{
{
Plot[
{x, x^3},
{x, 0, 1},
Frame -> True,
PlotLegends -> "Expressions"
]
},
{
Plot[
{x^2, x^4},
{x, 0, 1},
Frame -> True,
PlotLegends -> "Expressions"
]
}
},
FrameLabel -> {"x-axis", "y-axis"}
]](https://www.wolframcloud.com/obj/resourcesystem/images/0c9/0c901f1c-a26c-456a-8626-b51f25a95ec7/54ec9dae51f33170.png)
![ResourceFunction["PlotGrid"][
{
{
Plot[Sin[x], {x, -\[Pi], \[Pi]}, Frame -> True],
Plot[Cos[x], {x, -\[Pi], \[Pi]}, Frame -> True]
},
{
Plot[Sin[x]^2, {x, -\[Pi], \[Pi]}, Frame -> True],
Plot[Cos[x]^2, {x, -\[Pi], \[Pi]}, Frame -> True]
}
}
]](https://www.wolframcloud.com/obj/resourcesystem/images/0c9/0c901f1c-a26c-456a-8626-b51f25a95ec7/2663bfeec22cbffc.png)
![ResourceFunction["PlotGrid"][
{
{
Plot[Sin[x], {x, -\[Pi], \[Pi]}, Frame -> True],
Plot[Cos[x], {x, -\[Pi], \[Pi]}, Frame -> True]
},
{Plot[Sin[x]^2, {x, -\[Pi], \[Pi]}, Frame -> True], Null}
}
]](https://www.wolframcloud.com/obj/resourcesystem/images/0c9/0c901f1c-a26c-456a-8626-b51f25a95ec7/4e34e2defda17131.png)
![ResourceFunction["PlotGrid"][
{
{
Plot[Sin[x], {x, -\[Pi], \[Pi]}, Frame -> True],
Plot[Cos[x], {x, -\[Pi], \[Pi]}, Frame -> True]
},
{Plot[Sin[x]^2, {x, -\[Pi], \[Pi]}, Frame -> True], SpanFromLeft}
},
Spacings -> 30
]](https://www.wolframcloud.com/obj/resourcesystem/images/0c9/0c901f1c-a26c-456a-8626-b51f25a95ec7/48406733eb3b9885.png)
![ResourceFunction["PlotGrid"][
{
{
Plot[Sin[x], {x, -\[Pi], \[Pi]}, Frame -> True],
Plot[Cos[x], {x, -\[Pi], \[Pi]}, Frame -> True]
},
{Plot[Sin[x]^2, {x, -\[Pi], \[Pi]}, Frame -> True], SpanFromLeft}
},
Spacings -> 30,
PlotLabels -> Row -> Style["a)", 20]
]](https://www.wolframcloud.com/obj/resourcesystem/images/0c9/0c901f1c-a26c-456a-8626-b51f25a95ec7/4a229f005f27fa78.png)
![ResourceFunction["PlotGrid"][
{
{
Plot[
{x, x^3},
{x, 0, 1},
Frame -> True,
PlotLegends -> Placed["Expressions", {Left, Top}]
]
},
{
Plot[
{x^2, x^4},
{x, 0, 1},
Frame -> True,
PlotLegends -> Placed["Expressions", {Left, Top}]
]
}
},
FrameLabel -> {"x-axis", "y-axis"}
]](https://www.wolframcloud.com/obj/resourcesystem/images/0c9/0c901f1c-a26c-456a-8626-b51f25a95ec7/6461ae267174d836.png)
![ResourceFunction["PlotGrid"][
{
{
Plot[Sin[x], {x, -\[Pi], \[Pi]}, Frame -> True],
Plot[Cos[x], {x, -\[Pi], \[Pi]}, Frame -> True]
},
{
Plot[Sin[x]^2, {x, -\[Pi], \[Pi]}, Frame -> True],
Plot[Cos[x]^2, {x, -\[Pi], \[Pi]}, Frame -> True]
}
},
Spacings -> Scaled[0.1]
]](https://www.wolframcloud.com/obj/resourcesystem/images/0c9/0c901f1c-a26c-456a-8626-b51f25a95ec7/6efd2519af0f0315.png)
![ResourceFunction["PlotGrid"][
{
{
Plot[Sin[x], {x, -\[Pi], \[Pi]}, Frame -> True],
Plot[Cos[x], {x, -\[Pi], \[Pi]}, Frame -> True, AspectRatio -> 3]
},
{
Plot[Sin[x]^2, {x, -\[Pi], \[Pi]}, Frame -> True],
Plot[Cos[x]^2, {x, -\[Pi], \[Pi]}, Frame -> True]
}
},
Spacings -> Scaled[0.1]
]](https://www.wolframcloud.com/obj/resourcesystem/images/0c9/0c901f1c-a26c-456a-8626-b51f25a95ec7/01f594073266613c.png)
![ResourceFunction["PlotGrid"][
{
{
Plot[Sin[x], {x, -\[Pi], \[Pi]}, Frame -> True],
Plot[Cos[x], {x, -\[Pi], \[Pi]}, Frame -> True]
},
{
Plot[Sin[x]^2, {x, -\[Pi], \[Pi]}, Frame -> True],
Plot[Cos[x]^2, {x, -\[Pi], \[Pi]}, Frame -> True]
}
},
Spacings -> Scaled[0.1],
ItemSize -> {2, 1}
]](https://www.wolframcloud.com/obj/resourcesystem/images/0c9/0c901f1c-a26c-456a-8626-b51f25a95ec7/38980b39a85f9234.png)
![ResourceFunction["PlotGrid"][
{
{
Plot[Sin[x], {x, -\[Pi], \[Pi]}, Frame -> True],
Plot[Cos[x], {x, -\[Pi], \[Pi]}, Frame -> True]
},
{
Plot[Sin[x]^2, {x, -\[Pi], \[Pi]}, Frame -> True],
Plot[Cos[x]^2, {x, -\[Pi], \[Pi]}, Frame -> True]
}
},
Spacings -> Scaled[0.1],
ItemSize -> {2, 1},
AspectRatio -> GeometricMean
]](https://www.wolframcloud.com/obj/resourcesystem/images/0c9/0c901f1c-a26c-456a-8626-b51f25a95ec7/209069800404aebc.png)
![ResourceFunction["PlotGrid"][
{
{
Plot[Sin[x], {x, -\[Pi], \[Pi]}, Frame -> True],
Plot[Cos[x], {x, -\[Pi], \[Pi]}, Frame -> True]
},
{
Plot[Sin[x]^2, {x, -\[Pi], \[Pi]}, Frame -> True],
Plot[Cos[x]^2, {x, -\[Pi], \[Pi]}, Frame -> True]
}
},
Spacings -> Scaled[0.1],
ItemSize -> {2, 1},
AspectRatio -> 1
]](https://www.wolframcloud.com/obj/resourcesystem/images/0c9/0c901f1c-a26c-456a-8626-b51f25a95ec7/5b1e4153e230a0c1.png)
![ResourceFunction["PlotGrid"][
{
{
Plot[Sin[x], {x, -\[Pi], \[Pi]}, Frame -> True],
Plot[Sin[x]^2, {x, -\[Pi], \[Pi]}, Frame -> True]
},
{
Plot[Cos[x], {x, -\[Pi], \[Pi]}, Frame -> True, Epilog -> {Red, Circle[]}],
Plot[Cos[x]^2, {x, -\[Pi], \[Pi]}, Frame -> True]
}
},
Spacings -> Scaled[0.1],
AspectRatio -> {2, 1} -> Automatic
]](https://www.wolframcloud.com/obj/resourcesystem/images/0c9/0c901f1c-a26c-456a-8626-b51f25a95ec7/75835956516db969.png)
![ResourceFunction["PlotGrid"][
{
{
Plot[Sin[x], {x, -\[Pi], \[Pi]}, Frame -> True],
Plot[Sin[x]^2, {x, -\[Pi], \[Pi]}, Frame -> True]
},
{
Plot[Cos[x], {x, -\[Pi], \[Pi]}, Frame -> True, Epilog -> {Red, Circle[]}],
Plot[Cos[x]^2, {x, -\[Pi], \[Pi]}, Frame -> True]
}
},
Spacings -> Scaled[0.1],
AspectRatio -> All -> Automatic
]](https://www.wolframcloud.com/obj/resourcesystem/images/0c9/0c901f1c-a26c-456a-8626-b51f25a95ec7/1ff257a078374752.png)
![ResourceFunction["PlotGrid"][
{
{
Plot[Sin[x], {x, -\[Pi], \[Pi]}, Frame -> True],
Plot[Sin[x]^2, {x, -\[Pi], \[Pi]}, Frame -> True]
},
{
Plot[Cos[x], {x, -\[Pi], \[Pi]}, Frame -> True, Epilog -> {Red, Circle[]}],
Plot[Cos[x]^2, {x, -\[Pi], \[Pi]}, Frame -> True]
}
},
Spacings -> Scaled[0.1],
AspectRatio -> All -> Automatic,
PlotRange -> Max
]](https://www.wolframcloud.com/obj/resourcesystem/images/0c9/0c901f1c-a26c-456a-8626-b51f25a95ec7/6ef4d0570df2905c.png)
![ResourceFunction["PlotGrid"][
{
{
Plot[Sin[x], {x, -\[Pi], \[Pi]}, Frame -> True],
Plot[Sin[x]^2, {x, -\[Pi], \[Pi]}, Frame -> True]
},
{
Plot[Cos[x], {x, -\[Pi], \[Pi]}, Frame -> True, Epilog -> {Red, Circle[]}],
Plot[Cos[x]^2, {x, -\[Pi], \[Pi]}, Frame -> True]
}
},
Spacings -> Scaled[0.1],
AspectRatio -> Automatic -> Automatic
]](https://www.wolframcloud.com/obj/resourcesystem/images/0c9/0c901f1c-a26c-456a-8626-b51f25a95ec7/44f21561d8638fcc.png)

![ResourceFunction["PlotGrid"][
{
{
Plot[Sin[x], {x, -\[Pi], \[Pi]}, Frame -> True],
Plot[Cos[x], {x, -\[Pi], \[Pi]}, Frame -> True],
Plot[Sinc[x], {x, -\[Pi], \[Pi]}, Frame -> True]
},
{
Plot[Sin[x]^2, {x, -\[Pi], \[Pi]}, Frame -> True],
Plot[Cos[x]^2, {x, -\[Pi], \[Pi]}, Frame -> True],
Plot[Sinc[x]^2, {x, -\[Pi], \[Pi]}, Frame -> True]
}
},
Spacings -> Scaled[0.1],
ItemSize -> {{2, 1, 1}, Automatic},
AspectRatio -> {{1, 1} -> 1, {2, 2} -> 1}
]](https://www.wolframcloud.com/obj/resourcesystem/images/0c9/0c901f1c-a26c-456a-8626-b51f25a95ec7/7d8a8492ec3aeb33.png)
![ResourceFunction["PlotGrid"][
{
{
Plot[Sin[x], {x, -\[Pi], \[Pi]}, Frame -> True],
Plot[Sin[x]^2, {x, -\[Pi], \[Pi]}, Frame -> True]
},
{
Frame[
Plot[Cos[x], {x, -\[Pi], \[Pi]}, Frame -> True, Epilog -> {Red, Circle[]}],
AspectRatio -> Automatic
],
Plot[Cos[x]^2, {x, -\[Pi], \[Pi]}, Frame -> True]
}
},
Spacings -> Scaled[0.1],
AspectRatio -> 1
]](https://www.wolframcloud.com/obj/resourcesystem/images/0c9/0c901f1c-a26c-456a-8626-b51f25a95ec7/7b959796f92c0adf.png)
![ResourceFunction["PlotGrid"][
{
{
Plot[Sin[x], {x, -\[Pi], \[Pi]}, Frame -> True],
Plot[Sin[x]^2, {x, -\[Pi], \[Pi]}, Frame -> True]
},
{
Plot[Cos[x], {x, -\[Pi], \[Pi]}, Frame -> True, Epilog -> {Red, Circle[]}],
Plot[Cos[x]^2, {x, -\[Pi], \[Pi]}, Frame -> True]
}
},
Spacings -> Scaled[0.1],
AspectRatio -> {1, {1, 1} -> Inherited, {2, 2} -> GoldenRatio}
]](https://www.wolframcloud.com/obj/resourcesystem/images/0c9/0c901f1c-a26c-456a-8626-b51f25a95ec7/295a778339ca59e1.png)
![ResourceFunction["PlotGrid"][
{
{
Plot[Sin[x], {x, -\[Pi], \[Pi]}, Frame -> True],
Plot[Cos[x], {x, -\[Pi], \[Pi]}, Frame -> True]
}
},
FrameLabel -> {"x axis", "y axis"}
]](https://www.wolframcloud.com/obj/resourcesystem/images/0c9/0c901f1c-a26c-456a-8626-b51f25a95ec7/1c0229b09728b241.png)
![ResourceFunction["PlotGrid"][
{
{
Plot[
x, {x, 0, 1}, Frame -> True, FrameLabel -> {None, "y-axis 1"}
]
},
{
Plot[
x^2,
{x, 0, 1},
Frame -> True,
FrameLabel -> {None, "y-axis 2"}
]
}
},
FrameLabel -> {None, "y-axes"}
]](https://www.wolframcloud.com/obj/resourcesystem/images/0c9/0c901f1c-a26c-456a-8626-b51f25a95ec7/12ff81967c1e8250.png)
![ResourceFunction["PlotGrid"][
{
{
Plot[
x, {x, 0, 1}, Frame -> True, FrameLabel -> {None, "y-axis 1"}
]
},
{
Plot[
x^2,
{x, 0, 1},
Frame -> True,
FrameLabel -> {None, "y-axis 2"}
]
}
},
FrameLabel -> {None, "y-axes"},
FrameStyle -> FontSize -> 16
]](https://www.wolframcloud.com/obj/resourcesystem/images/0c9/0c901f1c-a26c-456a-8626-b51f25a95ec7/03d7b9faad83808a.png)
![ResourceFunction["PlotGrid"][
{
{
Plot[
x,
{x, 0, 1},
Frame -> True,
FrameLabel -> {None, "y-axis 1"},
FrameStyle -> Red
]
},
{
Plot[
x^2,
{x, 0, 1},
Frame -> True,
FrameLabel -> {None, "y-axis 2"},
FrameStyle -> Red
]
}
},
FrameLabel -> {None, "y-axes"}
]](https://www.wolframcloud.com/obj/resourcesystem/images/0c9/0c901f1c-a26c-456a-8626-b51f25a95ec7/7ece6e5d76184fdc.png)
![ResourceFunction["PlotGrid"][
Table[
Graphics[
Text[{i, j}],
PlotRange -> {{-j, j}, {-i, i}},
Frame -> True
],
{i, 3},
{j, 3}
]
]](https://www.wolframcloud.com/obj/resourcesystem/images/0c9/0c901f1c-a26c-456a-8626-b51f25a95ec7/773bb26ec4695bb7.png)
![ResourceFunction["PlotGrid"][
Table[
Graphics[
Text[{i, j}],
PlotRange -> 1.2 {{-j, j}, {-i, i}},
Frame -> True
],
{i, 3},
{j, 3}
],
ItemSize -> {Automatic, {2 -> 2}}
]](https://www.wolframcloud.com/obj/resourcesystem/images/0c9/0c901f1c-a26c-456a-8626-b51f25a95ec7/7bc838bbbeb38b07.png)
![ResourceFunction["PlotGrid"][
Table[
Graphics[
Text[{i, j}],
PlotRange -> 1.2 {{-j, j}, {-i, i}},
Frame -> True
],
{i, 3},
{j, 3}
],
ItemSize -> Scaled
]](https://www.wolframcloud.com/obj/resourcesystem/images/0c9/0c901f1c-a26c-456a-8626-b51f25a95ec7/49c7019b936417b9.png)
![ResourceFunction["PlotGrid"][
Table[
Graphics[
Text[{i, j}],
PlotRange -> 1.2 {{-j, j}, {-i, i}},
Frame -> True
],
{i, 3},
{j, 3}
],
ItemSize -> {{{Scaled}, Scaled[0.5]}, Scaled}
]](https://www.wolframcloud.com/obj/resourcesystem/images/0c9/0c901f1c-a26c-456a-8626-b51f25a95ec7/6c44d6438b9725a3.png)
![ResourceFunction["PlotGrid"][
Table[
Graphics[
Text[{i, j}],
PlotRange -> 1.2 {{-j, j}, {-i, i}},
Frame -> True
],
{i, 3},
{j, 3}
],
ItemSize -> {{Offset[100]}, {Offset[100]}}
]](https://www.wolframcloud.com/obj/resourcesystem/images/0c9/0c901f1c-a26c-456a-8626-b51f25a95ec7/4816577e4a34df3c.png)
![Manipulate[
ResourceFunction["PlotGrid"][
Table[
Graphics[
Text[{i, j}],
PlotRange -> 1.2 {{-j, j}, {-i, i}},
Frame -> True
],
{i, 3},
{j, 3}
],
ItemSize -> {{Offset[100]}, {Offset[100]}},
ImageSize -> Dynamic[size],
PerformanceGoal -> "Speed"
],
{size, 200, 600}
]](https://www.wolframcloud.com/obj/resourcesystem/images/0c9/0c901f1c-a26c-456a-8626-b51f25a95ec7/51cc145aaa831a8c.png)
![ResourceFunction["PlotGrid"][
Table[
Graphics[
Text[{i, j}],
PlotRange -> 1.2 {{-j, j}, {-i, i}},
Frame -> True
],
{i, 3},
{j, 3}
]
]](https://www.wolframcloud.com/obj/resourcesystem/images/0c9/0c901f1c-a26c-456a-8626-b51f25a95ec7/7dd07d6c6839401a.png)
![ResourceFunction["PlotGrid"][
Table[
Graphics[
Text[{i, j}],
PlotRange -> 1.2 {{-j, j}, {-i, i}},
Frame -> True
],
{i, 3},
{j, 3}
],
Spacings -> 30
]](https://www.wolframcloud.com/obj/resourcesystem/images/0c9/0c901f1c-a26c-456a-8626-b51f25a95ec7/341873d995844c7b.png)
![ResourceFunction["PlotGrid"][
Table[
Graphics[
Text[{i, j}],
PlotRange -> 1.2 {{-j, j}, {-i, i}},
Frame -> True
],
{i, 3},
{j, 3}
],
Spacings -> Scaled[0.1]
]](https://www.wolframcloud.com/obj/resourcesystem/images/0c9/0c901f1c-a26c-456a-8626-b51f25a95ec7/736bc160744c2b8e.png)
![ResourceFunction["PlotGrid"][
Table[
Graphics[
Text[{i, j}],
PlotRange -> 1.2 {{-j, j}, {-i, i}},
Frame -> True
],
{i, 3},
{j, 3}
],
Spacings -> {None, Scaled[0.1]}
]](https://www.wolframcloud.com/obj/resourcesystem/images/0c9/0c901f1c-a26c-456a-8626-b51f25a95ec7/1bb907b4534543ff.png)
![ResourceFunction["PlotGrid"][
Table[
Graphics[
Text[{i, j}],
PlotRange -> 1.2 {{-j, j}, {-i, i}},
Frame -> True
],
{i, 3},
{j, 3}
],
Spacings -> {None, Scaled[0.1]},
"ShowFrameLabels" -> Full
]](https://www.wolframcloud.com/obj/resourcesystem/images/0c9/0c901f1c-a26c-456a-8626-b51f25a95ec7/27124b6048ddb040.png)
![ResourceFunction["PlotGrid"][
{
{
Plot[Sin[x], {x, -\[Pi], \[Pi]}, Frame -> True],
Plot[2 Sin[x], {x, -2 \[Pi], 2 \[Pi]}, Frame -> True]
},
{
Plot[1.5 Cos[x], {x, -2 \[Pi], 2 \[Pi]}, Frame -> True],
Plot[Sin[x], {x, -0 \[Pi], 3 \[Pi]}, Frame -> True]
}
}
]](https://www.wolframcloud.com/obj/resourcesystem/images/0c9/0c901f1c-a26c-456a-8626-b51f25a95ec7/4fdece10666f25e3.png)
![ResourceFunction["PlotGrid"][
{
{
Plot[Sin[x], {x, -\[Pi], \[Pi]}, Frame -> True],
Plot[2 Sin[x], {x, -2 \[Pi], 2 \[Pi]}, Frame -> True]
},
{
Plot[1.5 Cos[x], {x, -2 \[Pi], 2 \[Pi]}, Frame -> True],
Plot[Sin[x], {x, -0 \[Pi], 3 \[Pi]}, Frame -> True]
}
},
PlotRange -> Max
]](https://www.wolframcloud.com/obj/resourcesystem/images/0c9/0c901f1c-a26c-456a-8626-b51f25a95ec7/63e5051296f39c77.png)
![ResourceFunction["PlotGrid"][
{
{
Plot[Sin[x], {x, -\[Pi], \[Pi]}, Frame -> True],
Plot[2 Sin[x], {x, -2 \[Pi], 2 \[Pi]}, Frame -> True]
},
{
Plot[1.5 Cos[x], {x, -2 \[Pi], 2 \[Pi]}, Frame -> True],
Plot[Sin[x], {x, -0 \[Pi], 3 \[Pi]}, Frame -> True]
}
},
PlotRange -> Min
]](https://www.wolframcloud.com/obj/resourcesystem/images/0c9/0c901f1c-a26c-456a-8626-b51f25a95ec7/5f3fb374fa187bd8.png)
![ResourceFunction["PlotGrid"][
{
{
Plot[Sin[x], {x, -\[Pi], \[Pi]}, Frame -> True],
Plot[2 Sin[x], {x, -2 \[Pi], 2 \[Pi]}, Frame -> True]
},
{
Plot[1.5 Cos[x], {x, -2 \[Pi], 2 \[Pi]}, Frame -> True],
Plot[Sin[x], {x, -0 \[Pi], 3 \[Pi]}, Frame -> True]
}
},
PlotRange -> {Min, Max}
]](https://www.wolframcloud.com/obj/resourcesystem/images/0c9/0c901f1c-a26c-456a-8626-b51f25a95ec7/0685aaac6c4e090a.png)
![ResourceFunction["PlotGrid"][
{
{
Plot[Sin[x], {x, -\[Pi], \[Pi]}, Frame -> True],
Plot[2 Sin[x], {x, -2 \[Pi], 2 \[Pi]}, Frame -> True]
},
{
Plot[1.5 Cos[x], {x, -2 \[Pi], 2 \[Pi]}, Frame -> True],
Plot[Sin[x], {x, -0 \[Pi], 3 \[Pi]}, Frame -> True]
}
},
PlotRange -> {
{Directive[-3, 2], Directive[2, 6]},
{Directive[-2.5, 2.5], Directive[-1, 3]}
}
]](https://www.wolframcloud.com/obj/resourcesystem/images/0c9/0c901f1c-a26c-456a-8626-b51f25a95ec7/0ab8b4e755014ebc.png)
![ResourceFunction["PlotGrid"][
{
{
Plot[Sin[x], {x, -\[Pi], \[Pi]}, Frame -> True],
Plot[Cos[x], {x, -\[Pi], \[Pi]}, Frame -> True]
},
{Plot[Sin[x]^2, {x, -\[Pi], \[Pi]}, Frame -> True], SpanFromLeft}
},
Spacings -> 35
]](https://www.wolframcloud.com/obj/resourcesystem/images/0c9/0c901f1c-a26c-456a-8626-b51f25a95ec7/35a3b4b9ce5cbe2b.png)
![ResourceFunction["PlotGrid"][
{
{
Plot[Sin[x], {x, -\[Pi], \[Pi]}, Frame -> True],
Plot[Cos[x], {x, -\[Pi], \[Pi]}, Frame -> True]
},
{Plot[Sin[x]^2, {x, -\[Pi], \[Pi]}, Frame -> True], SpanFromLeft}
},
Spacings -> 35,
PlotLabels -> Automatic -> "a)"
]](https://www.wolframcloud.com/obj/resourcesystem/images/0c9/0c901f1c-a26c-456a-8626-b51f25a95ec7/4066c0c5e5d4f963.png)
![ResourceFunction["PlotGrid"][
{
{
Plot[Sin[x], {x, -\[Pi], \[Pi]}, Frame -> True],
Plot[Cos[x], {x, -\[Pi], \[Pi]}, Frame -> True]
},
{Plot[Sin[x]^2, {x, -\[Pi], \[Pi]}, Frame -> True], SpanFromLeft}
},
Spacings -> 35,
PlotLabels -> Automatic -> Style["1.", 20, Black]
]](https://www.wolframcloud.com/obj/resourcesystem/images/0c9/0c901f1c-a26c-456a-8626-b51f25a95ec7/7962cb1262de11b1.png)
![ResourceFunction["PlotGrid"][
{
{
Plot[Sin[x], {x, -\[Pi], \[Pi]}, Frame -> True],
Plot[Cos[x], {x, -\[Pi], \[Pi]}, Frame -> True]
},
{Plot[Sin[x]^2, {x, -\[Pi], \[Pi]}, Frame -> True], SpanFromLeft}
},
Spacings -> 35,
PlotLabels -> Placed[Row -> "i)", {Left, Above}]
]](https://www.wolframcloud.com/obj/resourcesystem/images/0c9/0c901f1c-a26c-456a-8626-b51f25a95ec7/57646d273029a90a.png)
![ResourceFunction["PlotGrid"][
{
{
Plot[Sin[x], {x, -\[Pi], \[Pi]}, Frame -> True],
Plot[Cos[x], {x, -\[Pi], \[Pi]}, Frame -> True]
},
{Plot[Sin[x]^2, {x, -\[Pi], \[Pi]}, Frame -> True], SpanFromLeft}
},
Spacings -> 35,
PlotLabels -> Placed[Row -> "i)", {Left, Above}],
LabelStyle -> {Black, 15}
]](https://www.wolframcloud.com/obj/resourcesystem/images/0c9/0c901f1c-a26c-456a-8626-b51f25a95ec7/51c4e5626683e7a9.png)
![ResourceFunction["PlotGrid"][
{
{
Labeled[
Plot[Sin[x], {x, -\[Pi], \[Pi]}, Frame -> True],
"A label",
{Left, Top}
],
Plot[Cos[x], {x, -\[Pi], \[Pi]}, Frame -> True]
},
{Plot[Sin[x]^2, {x, -\[Pi], \[Pi]}, Frame -> True], SpanFromLeft}
},
Spacings -> 35,
PlotLabels -> Placed[Row -> "i)", {Left, Above}]
]](https://www.wolframcloud.com/obj/resourcesystem/images/0c9/0c901f1c-a26c-456a-8626-b51f25a95ec7/4d4418ac9fcbcfd3.png)
![ResourceFunction["PlotGrid"][
{
{
Labeled[
Plot[Sin[x], {x, -\[Pi], \[Pi]}, Frame -> True],
"A label",
{Left, Above}
],
Plot[Cos[x], {x, -\[Pi], \[Pi]}, Frame -> True]
},
{Plot[Sin[x]^2, {x, -\[Pi], \[Pi]}, Frame -> True], SpanFromLeft}
},
Spacings -> 35,
PlotLabels -> Placed[Row -> "i)", {Left, Above}]
]](https://www.wolframcloud.com/obj/resourcesystem/images/0c9/0c901f1c-a26c-456a-8626-b51f25a95ec7/2308af253462183d.png)
![ResourceFunction["PlotGrid"][
{
{
Plot[Sin[x], {x, -\[Pi], \[Pi]}, Frame -> True],
Plot[Cos[x], {x, -\[Pi], \[Pi]}, Frame -> True]
},
{Plot[Sin[x]^2, {x, -\[Pi], \[Pi]}, Frame -> True], SpanFromLeft}
},
Spacings -> 35,
PlotLabels -> Placed[
{
Row -> "(1)",
{"Plot 1", "Plot 2", "Plot 3"},
{{}}(* to avoid ambiguity *)
},
{Left, Top}
]
]](https://www.wolframcloud.com/obj/resourcesystem/images/0c9/0c901f1c-a26c-456a-8626-b51f25a95ec7/24dc1f4b4f03fbb5.png)
![ResourceFunction["PlotGrid"][
{
{
Plot[Sin[x], {x, -\[Pi], \[Pi]}, Frame -> True],
Plot[Cos[x], {x, -\[Pi], \[Pi]}, Frame -> True]
},
{Plot[Sin[x]^2, {x, -\[Pi], \[Pi]}, Frame -> True], SpanFromLeft}
},
Spacings -> 30,
PlotLabels -> {
Placed[{"Label 1.1", "Label 1.2"}, {Left, Above}],
Placed[{"Label 2.1", "Label 2.2"}, {After, Center}]
}
]](https://www.wolframcloud.com/obj/resourcesystem/images/0c9/0c901f1c-a26c-456a-8626-b51f25a95ec7/3d787ce89183571e.png)
![ResourceFunction["PlotGrid"][
{
{
Plot[Sin[x], {x, -\[Pi], \[Pi]}, Frame -> True],
Plot[Cos[x], {x, -\[Pi], \[Pi]}, Frame -> True]
},
{Plot[Sin[x]^2, {x, -\[Pi], \[Pi]}, Frame -> True], SpanFromLeft}
},
Spacings -> 30,
PlotLabels -> {
Placed[{"Label 1.1", "Label 1.2"}, {Left, Above}],
Placed[{"Label 2.1", "Label 2.2"}, {After, Center}]
},
LabelingFunction -> Column
]](https://www.wolframcloud.com/obj/resourcesystem/images/0c9/0c901f1c-a26c-456a-8626-b51f25a95ec7/2a9da76c524190d9.png)
![ResourceFunction["PlotGrid"][
{
{
Plot[Sin[x], {x, -\[Pi], \[Pi]}, Frame -> True],
Plot[Cos[x], {x, -\[Pi], \[Pi]}, Frame -> True]
},
{Plot[Sin[x]^2, {x, -\[Pi], \[Pi]}, Frame -> True], SpanFromLeft}
},
Spacings -> 30,
PlotLabels -> {
Placed[{"Label 1.1", "Label 1.2"}, {Left, Above}],
Placed[{"Label 2.1", "Label 2.2"}, {After, Center}],
"Label 3"
},
LabelingFunction -> (Framed[Column@#, Background -> White] &)
]](https://www.wolframcloud.com/obj/resourcesystem/images/0c9/0c901f1c-a26c-456a-8626-b51f25a95ec7/700556f55b3c1aa0.png)
![ResourceFunction["PlotGrid"][
{
{
Plot[Sin[x], {x, -\[Pi], \[Pi]}, Frame -> True],
Plot[Cos[x], {x, -\[Pi], \[Pi]}, Frame -> True]
},
{Plot[Sin[x]^2, {x, -\[Pi], \[Pi]}, Frame -> True], SpanFromLeft}
},
Spacings -> 30,
PlotLabels -> {
Placed[{"Label 1.1", "Label 1.2"}, {Left, Above}],
Placed[{"Label 2.1", "Label 2.2"}, {After, Center}],
"Label 3"
},
LabelingFunction -> Automatic -> (Framed[#, Background -> White] &)
]](https://www.wolframcloud.com/obj/resourcesystem/images/0c9/0c901f1c-a26c-456a-8626-b51f25a95ec7/68f224594b634ac6.png)
![ResourceFunction["PlotGrid"][
{
{
Plot[Sin[x], {x, -\[Pi], \[Pi]}, Frame -> True],
Plot[Cos[x], {x, -\[Pi], \[Pi]}, Frame -> True]
},
{Plot[Sin[x]^2, {x, -\[Pi], \[Pi]}, Frame -> True], SpanFromLeft}
},
Spacings -> 35,
Epilog -> {
Blue, Text["A label", {1, 2} -> {2, 0.4}],
Red, Arrow@{{1, 1} -> {\[Pi]/2, 1}, {2, 1} -> {1, Sin[1]^2}}
}
]](https://www.wolframcloud.com/obj/resourcesystem/images/0c9/0c901f1c-a26c-456a-8626-b51f25a95ec7/75d2fb299c0bdf7b.png)
![ResourceFunction["PlotGrid"][
{
{
Plot[Sin[x], {x, -\[Pi], \[Pi]}, Frame -> True],
Plot[Cos[x], {x, -\[Pi], \[Pi]}, Frame -> True]
},
{Plot[Sin[x]^2, {x, -\[Pi], \[Pi]}, Frame -> True], SpanFromLeft}
},
Spacings -> 35,
Epilog -> {
EdgeForm@Black, FaceForm@None, Rectangle[{1, 1} -> ImageScaled@{0, 0}, {1, 2} -> ImageScaled@{1, 1}],
Red, Arrow@{{1, 1} -> Scaled@{1, 0}, {2, 1} -> {1, Sin[1]^2}},
Green, Circle[{2, 1} -> Offset[{10, -10}, Scaled@{0, 1}], Offset[10]]
}
]](https://www.wolframcloud.com/obj/resourcesystem/images/0c9/0c901f1c-a26c-456a-8626-b51f25a95ec7/2ea0ebad8d9837d6.png)
![ResourceFunction["PlotGrid"][
Table[
Graphics[
Text[{i, j}],
PlotRange -> 1.2 {{-j, j}, {-i, i}},
Frame -> True
],
{i, 3},
{j, 3}
],
Spacings -> {None, 20}
]](https://www.wolframcloud.com/obj/resourcesystem/images/0c9/0c901f1c-a26c-456a-8626-b51f25a95ec7/5cb485ec28ab5a3b.png)
![ResourceFunction["PlotGrid"][
ReplacePart[
Table[
Graphics[
Text[{i, j}],
PlotRange -> 1.2 {{-j, j}, {-i, i}},
Frame -> True
],
{i, 3},
{j, 3}
],
{2, 2} -> Null
],
Spacings -> {None, 20}
]](https://www.wolframcloud.com/obj/resourcesystem/images/0c9/0c901f1c-a26c-456a-8626-b51f25a95ec7/47761a2677ec7cd1.png)
![ResourceFunction["PlotGrid"][
Table[
Graphics[
Text[{i, j}],
PlotRange -> 1.2 {{-j, j}, {-i, i}},
Frame -> True
],
{i, 3},
{j, 3}
],
Spacings -> {None, 20},
"ShowFrameLabels" -> Automatic
]](https://www.wolframcloud.com/obj/resourcesystem/images/0c9/0c901f1c-a26c-456a-8626-b51f25a95ec7/4242c40ca1074ead.png)
![ResourceFunction["PlotGrid"][
Table[
Graphics[
Text[{i, j}],
PlotRange -> 1.2 {{-j, j}, {-i, i}},
Frame -> True
],
{i, 3},
{j, 3}
],
Spacings -> {None, 20},
"ShowFrameLabels" -> None
]](https://www.wolframcloud.com/obj/resourcesystem/images/0c9/0c901f1c-a26c-456a-8626-b51f25a95ec7/24b14af09f31431c.png)
![ResourceFunction["PlotGrid"][
Table[
Graphics[
Text[{i, j}],
PlotRange -> 1.2 {{-j, j}, {-i, i}},
Frame -> True
],
{i, 3},
{j, 3}
],
Spacings -> {None, 20},
"ShowFrameLabels" -> All
]](https://www.wolframcloud.com/obj/resourcesystem/images/0c9/0c901f1c-a26c-456a-8626-b51f25a95ec7/0eb65be8ffc08242.png)
![ResourceFunction["PlotGrid"][
MapAt[
Frame[#, "ShowFrameLabels" -> None] &,
Table[
Graphics[
Text[{i, j}],
PlotRange -> 1.2 {{-j, j}, {-i, i}},
Frame -> True
],
{i, 3},
{j, 3}
],
{2, 2}
],
Spacings -> {None, 20}
]](https://www.wolframcloud.com/obj/resourcesystem/images/0c9/0c901f1c-a26c-456a-8626-b51f25a95ec7/23287d746926f762.png)
![ResourceFunction["PlotGrid"][
Table[
Graphics[
Text[{i, j}],
PlotRange -> {{-j, j}, {-i, i}},
Frame -> True
],
{i, 3},
{j, 3}
],
Spacings -> {{None, 30}, {None, 30}}
]](https://www.wolframcloud.com/obj/resourcesystem/images/0c9/0c901f1c-a26c-456a-8626-b51f25a95ec7/485edb94d5b7d53c.png)
![ResourceFunction["PlotGrid"][
Table[
Graphics[
Text[{i, j}],
PlotRange -> {{-j, j}, {-i, i}},
Frame -> True
],
{i, 3},
{j, 3}
],
Spacings -> {{None, 30}, {None, 30}},
"HideOuterTickLabels" -> Directive[All, Full]
]](https://www.wolframcloud.com/obj/resourcesystem/images/0c9/0c901f1c-a26c-456a-8626-b51f25a95ec7/2976466b16c31e5c.png)
![ResourceFunction["PlotGrid"][
Table[
Graphics[
Text[{i, j}],
PlotRange -> {{-j, j}, {-i, i}},
Frame -> True
],
{i, 3},
{j, 3}
],
Spacings -> {{None, 30}, {None, 30}},
"HideOuterTickLabels" -> Automatic
]](https://www.wolframcloud.com/obj/resourcesystem/images/0c9/0c901f1c-a26c-456a-8626-b51f25a95ec7/0fd0194118c99b59.png)
![ResourceFunction["PlotGrid"][
Table[
Graphics[
Text[{i, j}],
PlotRange -> {{-j, j}, {-i, i}},
Frame -> True
],
{i, 3},
{j, 3}
],
Spacings -> {{None, 30}, {None, 30}},
"HideOuterTickLabels" -> Scaled[0.5]
]](https://www.wolframcloud.com/obj/resourcesystem/images/0c9/0c901f1c-a26c-456a-8626-b51f25a95ec7/78eb20635a4e98cc.png)
![ResourceFunction["PlotGrid"][
Table[
Graphics[
Text[{i, j}],
PlotRange -> {{-j, j}, {-i, i}},
Frame -> True
],
{i, 3},
{j, 3}
],
Spacings -> {None, 20},
"HideOuterTickLabels" -> None
]](https://www.wolframcloud.com/obj/resourcesystem/images/0c9/0c901f1c-a26c-456a-8626-b51f25a95ec7/51723a6976855213.png)
![ResourceFunction["PlotGrid"][
MapAt[
Frame[#, "HideOuterTickLabels" -> {Directive[Right, All, 30], None}] &,
Table[
Graphics[
Text[{i, j}],
PlotRange -> {{-j, j}, {-i, i}},
Frame -> True
],
{i, 3},
{j, 3}
],
{3, 3}
],
Spacings -> {None, 20},
"HideOuterTickLabels" -> None
]](https://www.wolframcloud.com/obj/resourcesystem/images/0c9/0c901f1c-a26c-456a-8626-b51f25a95ec7/50ad3078b818b795.png)
![ResourceFunction["PlotGrid"][
{
{
Plot[Sin[x], {x, -\[Pi], \[Pi]}, Frame -> True, Axes -> False],
Plot[Cos[x], {x, -\[Pi], \[Pi]}, Frame -> True]
},
{Plot[Sin[x]^2, {x, -\[Pi], \[Pi]}, Frame -> True, Axes -> False], SpanFromAbove}
},
Spacings -> 30
]](https://www.wolframcloud.com/obj/resourcesystem/images/0c9/0c901f1c-a26c-456a-8626-b51f25a95ec7/187bfc60ce5ca52d.png)
![ResourceFunction["PlotGrid"][
{
{
Plot[Sin[x], {x, -\[Pi], \[Pi]}, Frame -> True, Axes -> False],
Plot[Cos[x], {x, -\[Pi], \[Pi]}, Frame -> True]
},
{Plot[Sin[x]^2, {x, -\[Pi], \[Pi]}, Frame -> True, Axes -> False], SpanFromAbove}
},
Spacings -> 30,
"MergeAxes" -> {False, "ZigZag"}
]](https://www.wolframcloud.com/obj/resourcesystem/images/0c9/0c901f1c-a26c-456a-8626-b51f25a95ec7/71d7472f79f5c4b4.png)
![ResourceFunction["PlotGrid"][
{
{
Plot[Sin[x], {x, -\[Pi], \[Pi]}, Frame -> True, Axes -> False],
Plot[Cos[x], {x, -\[Pi], \[Pi]}, Frame -> True]
},
{Plot[Sin[x]^2, {x, -\[Pi], \[Pi]}, Frame -> True, Axes -> False], SpanFromAbove}
},
Spacings -> 30,
"MergeAxes" -> {False, "Cut" -> 30}
]](https://www.wolframcloud.com/obj/resourcesystem/images/0c9/0c901f1c-a26c-456a-8626-b51f25a95ec7/42d1df7e8812bb2e.png)
![ResourceFunction["PlotGrid"][
{
{
Plot[Sin[x], {x, -\[Pi], \[Pi]}, Frame -> True, Axes -> False, FrameStyle -> Red],
Plot[Cos[x], {x, -\[Pi], \[Pi]}, Frame -> True]
},
{Plot[Sin[x]^2, {x, -\[Pi], \[Pi]}, Frame -> True, Axes -> False, FrameStyle -> Blue], SpanFromAbove}
},
Spacings -> 30,
"MergeAxes" -> {False, Directive["Wave" -> 20, 20]}
]](https://www.wolframcloud.com/obj/resourcesystem/images/0c9/0c901f1c-a26c-456a-8626-b51f25a95ec7/0bc494414ee84f15.png)
![ResourceFunction["PlotGrid"][
{
{
Frame[
Plot[Sin[x], {x, -\[Pi], \[Pi]}, Frame -> True, Axes -> False, FrameStyle -> Red],
"MergeAxes" -> {False, "Dotted" -> 20}
],
Plot[Cos[x], {x, -\[Pi], \[Pi]}, Frame -> True]
},
{Plot[Sin[x]^2, {x, -\[Pi], \[Pi]}, Frame -> True, Axes -> False, FrameStyle -> Blue], SpanFromAbove}
},
Spacings -> 30
]](https://www.wolframcloud.com/obj/resourcesystem/images/0c9/0c901f1c-a26c-456a-8626-b51f25a95ec7/6dbf6adfbe978ac5.png)
![ResourceFunction["PlotGrid"][
{
{
Frame[
Plot[Sin[x], {x, -\[Pi], \[Pi]}, Frame -> True, Axes -> False, FrameStyle -> Red],
"MergeAxes" -> {False, {Graphics[Rectangle[{0, -1}, {0.5, 1}], PlotRange -> {{0, 1}, {-1, 1}}, PlotRangePadding -> None, AspectRatio -> Full], Automatic}}
],
Plot[Cos[x], {x, -\[Pi], \[Pi]}, Frame -> True]
},
{Plot[Sin[x]^2, {x, -\[Pi], \[Pi]}, Frame -> True, Axes -> False, FrameStyle -> Blue], SpanFromAbove}
},
Spacings -> 30
]](https://www.wolframcloud.com/obj/resourcesystem/images/0c9/0c901f1c-a26c-456a-8626-b51f25a95ec7/2d43095696ad822e.png)
![ResourceFunction["PlotGrid"][
{
{
Frame[
Plot[Sin[x], {x, -\[Pi], \[Pi]}, Frame -> True, Axes -> False, FrameStyle -> Red],
"MergeAxes" -> {
False,
{
Graphics[{Arrowheads@1, Arrow@{{0, 0}, {0.5, 0}}}, PlotRange -> {{0, 1}, {-1, 1}}, PlotRangePadding -> None, AspectRatio -> Full],
Graphics[Rectangle[{0, -1}, {0.5, 1}], PlotRange -> {{0, 1}, {-1, 1}}, PlotRangePadding -> None, AspectRatio -> Full]
}
}
],
Plot[Cos[x], {x, -\[Pi], \[Pi]}, Frame -> True]
},
{Plot[Sin[x]^2, {x, -\[Pi], \[Pi]}, Frame -> True, Axes -> False, FrameStyle -> Blue], SpanFromAbove}
},
Spacings -> 30
]](https://www.wolframcloud.com/obj/resourcesystem/images/0c9/0c901f1c-a26c-456a-8626-b51f25a95ec7/1b1cf01126b7eb87.png)
![Manipulate[
ResourceFunction["PlotGrid"][
Table[
Graphics[
Text[{i, j}],
PlotRange -> 1.2 {{-j, j}, {-i, i}},
Frame -> True
],
{i, 3},
{j, 3}
],
ItemSize -> {{Offset[100]}, {Offset[100]}},
ImageSize -> Dynamic[size],
PerformanceGoal -> perfGoal
],
{size, 200, 600},
{perfGoal, {"Speed", "Quality"}}
]](https://www.wolframcloud.com/obj/resourcesystem/images/0c9/0c901f1c-a26c-456a-8626-b51f25a95ec7/6887639aa8eb8996.png)
![ResourceFunction["PlotGrid"][
{{
DateListPlot[{1, 1, 2, 3, 5, 8, 11}, {2000, 8}],
DateListPlot[{1, 1, 2, 3, 5, 8, 11}, {2000, 8}]
}}
]](https://www.wolframcloud.com/obj/resourcesystem/images/0c9/0c901f1c-a26c-456a-8626-b51f25a95ec7/50b2676378d39f98.png)
![ResourceFunction["PlotGrid"][
{{
DateListPlot[{1, 1, 2, 3, 5, 8, 11}, {2000, 8}],
DateListPlot[{1, 1, 2, 3, 5, 8, 11}, {2000, 8}]
}},
Method -> {"FixFrameTicks" -> False}
]](https://www.wolframcloud.com/obj/resourcesystem/images/0c9/0c901f1c-a26c-456a-8626-b51f25a95ec7/6cf75c08d37ea137.png)
![plots = {{
Plot[x, {x, 0, 3}, Frame -> True],
Plot[x, {x, 0, 3}, Frame -> True]
}}](https://www.wolframcloud.com/obj/resourcesystem/images/0c9/0c901f1c-a26c-456a-8626-b51f25a95ec7/0c0fde6cca349c4d.png)

![ResourceFunction["PlotGrid"][
plots,
Method -> {"AllCustomTicks" -> False}
]](https://www.wolframcloud.com/obj/resourcesystem/images/0c9/0c901f1c-a26c-456a-8626-b51f25a95ec7/195af384038e41e8.png)
![ResourceFunction["PlotGrid"][
{{
Plot[x, {x, 0, 3}, Frame -> True],
Plot[x^2, {x, 0, 3}, Frame -> True]
}}
]](https://www.wolframcloud.com/obj/resourcesystem/images/0c9/0c901f1c-a26c-456a-8626-b51f25a95ec7/1ff886c332c4a423.png)
![ResourceFunction["PlotGrid"][
{{
Plot[x, {x, 0, 3}, Frame -> True],
Plot[x^2, {x, 0, 3}, Frame -> True]
}},
PlotRange -> Max
]](https://www.wolframcloud.com/obj/resourcesystem/images/0c9/0c901f1c-a26c-456a-8626-b51f25a95ec7/2340d58b93f2c827.png)
![Show[
ResourceFunction["PlotGrid"][
{{
Plot[x, {x, 0, 2.65}, Frame -> True],
Plot[x, {x, 0, 3}, Frame -> True]
}}
],
ImageSize -> 250
]](https://www.wolframcloud.com/obj/resourcesystem/images/0c9/0c901f1c-a26c-456a-8626-b51f25a95ec7/557c19ddd88e3558.png)
![ResourceFunction["PlotGrid"][
{
{
Plot[x, {x, 0, 2.65}, Frame -> True],
Plot[x, {x, 0, 3}, Frame -> True]
}
},
ImageSize -> 250
]](https://www.wolframcloud.com/obj/resourcesystem/images/0c9/0c901f1c-a26c-456a-8626-b51f25a95ec7/78f573d681814a48.png)
![plots = {{
Plot[x, {x, 0, 3}, Frame -> True],
Plot[x, {x, 0, 3}, Frame -> True]
}}](https://www.wolframcloud.com/obj/resourcesystem/images/0c9/0c901f1c-a26c-456a-8626-b51f25a95ec7/7e9e423be3ab19d4.png)

![ResourceFunction["PlotGrid"][
plots,
"HideOuterTickLabels" -> None,
Method -> {"AllCustomTicks" -> False}
]](https://www.wolframcloud.com/obj/resourcesystem/images/0c9/0c901f1c-a26c-456a-8626-b51f25a95ec7/16ceaacebb3a788d.png)
![ResourceFunction["PlotGrid"][
{
{
Plot[Sin[x], {x, -\[Pi], \[Pi]}, Frame -> True],
SpanFromAbove
},
{
SpanFromLeft,
SpanFromBoth
}
},
Spacings -> 30
]](https://www.wolframcloud.com/obj/resourcesystem/images/0c9/0c901f1c-a26c-456a-8626-b51f25a95ec7/1cfe75353c5ec88f.png)
![ResourceFunction["PlotGrid"][
{
{
Plot[Sin[x], {x, -\[Pi], \[Pi]}, Frame -> True],
Plot[Cos[x], {x, -\[Pi], \[Pi]}, Frame -> True]
},
{Plot[Sin[x]^2, {x, -\[Pi], \[Pi]}, Frame -> True], SpanFromLeft}
},
Spacings -> 35,
PlotLabels -> Placed[
{
Row -> "(1)",
{"Plot 1", "Plot 2", "Plot 3"}
},
{Left, Top}
]
]](https://www.wolframcloud.com/obj/resourcesystem/images/0c9/0c901f1c-a26c-456a-8626-b51f25a95ec7/24414bb66c22232b.png)
![ResourceFunction["PlotGrid"][
{
{
Plot[Sin[x], {x, -\[Pi], \[Pi]}, Frame -> True],
Plot[Cos[x], {x, -\[Pi], \[Pi]}, Frame -> True]
},
{Plot[Sin[x]^2, {x, -\[Pi], \[Pi]}, Frame -> True], SpanFromLeft}
},
Spacings -> 35,
PlotLabels -> Placed[
{
Row -> "(1)",
{"Plot 1", "Plot 2", "Plot 3"},
{{}}(* to avoid ambiguity *)
},
{Left, Top}
]
]](https://www.wolframcloud.com/obj/resourcesystem/images/0c9/0c901f1c-a26c-456a-8626-b51f25a95ec7/6dfe9a5050bfaff1.png)
![ResourceFunction["PlotGrid"][
{
{
Plot[Sin[x], {x, -\[Pi], \[Pi]}, Frame -> True],
Plot[Cos[x], {x, -\[Pi], \[Pi]}, Frame -> True]
},
{
Plot[Sin[x]^2, {x, -\[Pi], \[Pi]}, Frame -> True],
Plot[Cos[x]^2, {x, -\[Pi], \[Pi]}, Frame -> True]
}
},
Spacings -> Scaled[0.1],
AspectRatio -> {{1, 1} -> 2, {1, 2} -> 1, {2, 1} -> 2, {2, 2} -> 0.5}
]](https://www.wolframcloud.com/obj/resourcesystem/images/0c9/0c901f1c-a26c-456a-8626-b51f25a95ec7/7b18e8228239f926.png)
![ResourceFunction["PlotGrid"][
{
{
Plot[Sin[x], {x, -\[Pi], \[Pi]}, Frame -> True],
Plot[Cos[x], {x, -\[Pi], \[Pi]}, Frame -> True]
},
{
Plot[Sin[x]^2, {x, -\[Pi], \[Pi]}, Frame -> True],
Plot[Cos[x]^2, {x, -\[Pi], \[Pi]}, Frame -> True]
}
},
Spacings -> Scaled[0.1],
AspectRatio -> {{1, 1} -> 2, {1, 2} -> 1, {2, 2} -> 0.5}
]](https://www.wolframcloud.com/obj/resourcesystem/images/0c9/0c901f1c-a26c-456a-8626-b51f25a95ec7/0ac16c9d68c7185c.png)
![ResourceFunction["PlotGrid"][
{
{
Plot[Sin[x], {x, -\[Pi], \[Pi]}, Frame -> True],
Plot[Cos[x], {x, -\[Pi], \[Pi]}, Frame -> True]
},
{
Plot[Sin[x]^2, {x, -\[Pi], \[Pi]}, Frame -> True],
Plot[Cos[x]^2, {x, -\[Pi], \[Pi]}, Frame -> True]
}
},
Spacings -> 35,
AspectRatio -> {1, 1} -> 2
]](https://www.wolframcloud.com/obj/resourcesystem/images/0c9/0c901f1c-a26c-456a-8626-b51f25a95ec7/27c70dd814c34372.png)
![ResourceFunction["PlotGrid"][
{
{
Plot[Sin[x], {x, -\[Pi], \[Pi]}, Frame -> True],
Plot[Cos[x], {x, -\[Pi], \[Pi]}, Frame -> True]
},
{
Plot[Sin[x]^2, {x, -\[Pi], \[Pi]}, Frame -> True],
Plot[Cos[x]^2, {x, -\[Pi], \[Pi]}, Frame -> True]
}
},
Spacings -> Scaled[0.1],
AspectRatio -> {1, 1} -> 2
]](https://www.wolframcloud.com/obj/resourcesystem/images/0c9/0c901f1c-a26c-456a-8626-b51f25a95ec7/7148acb70d363b59.png)
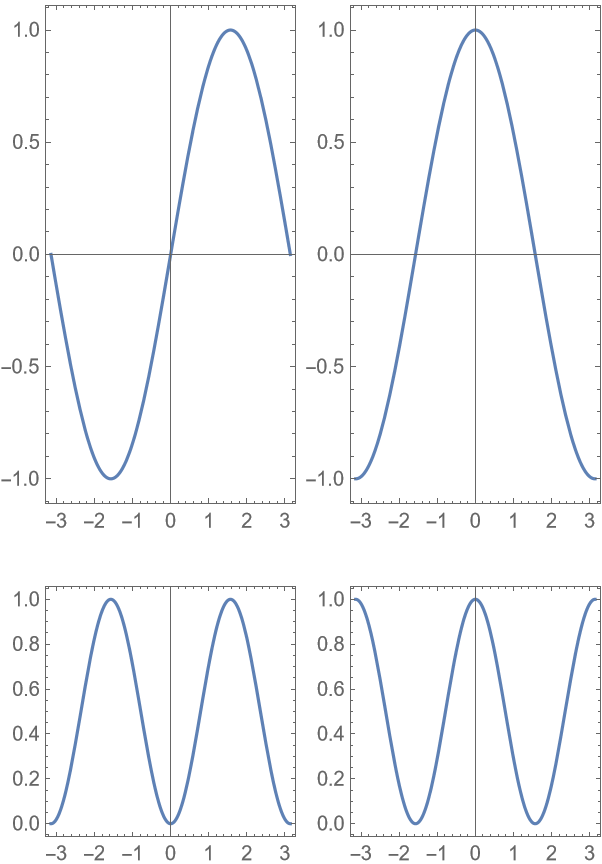
![ResourceFunction["PlotGrid"][
{
{Plot[Sin[x], {x, -\[Pi], \[Pi]}, Frame -> True]},
{Plot[Cos[x], {x, -\[Pi], \[Pi]}, Frame -> True]}
},
"MergeAxes" -> "Cut"
]](https://www.wolframcloud.com/obj/resourcesystem/images/0c9/0c901f1c-a26c-456a-8626-b51f25a95ec7/5a292b6d695bae3a.png)
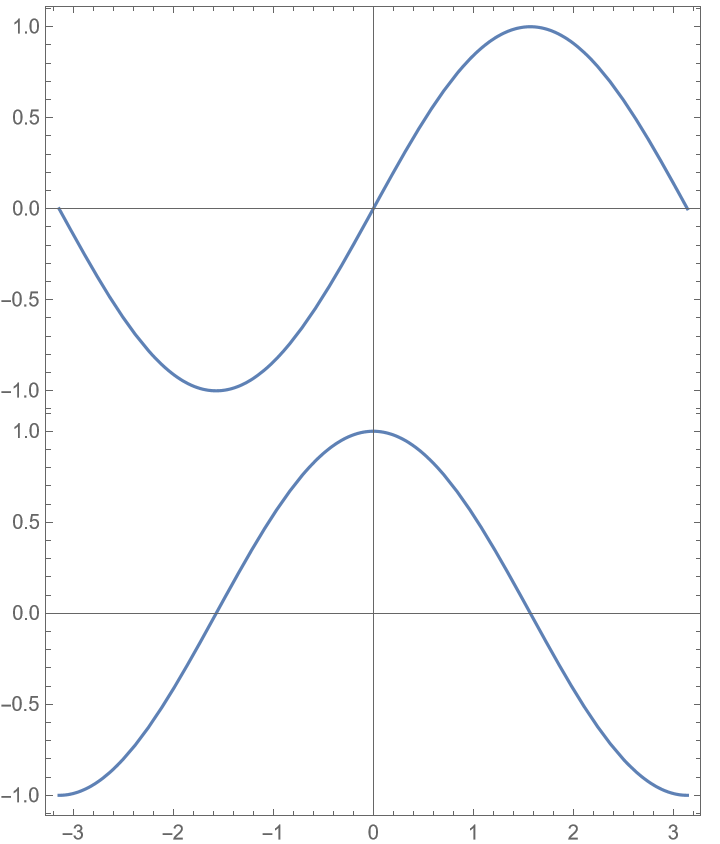
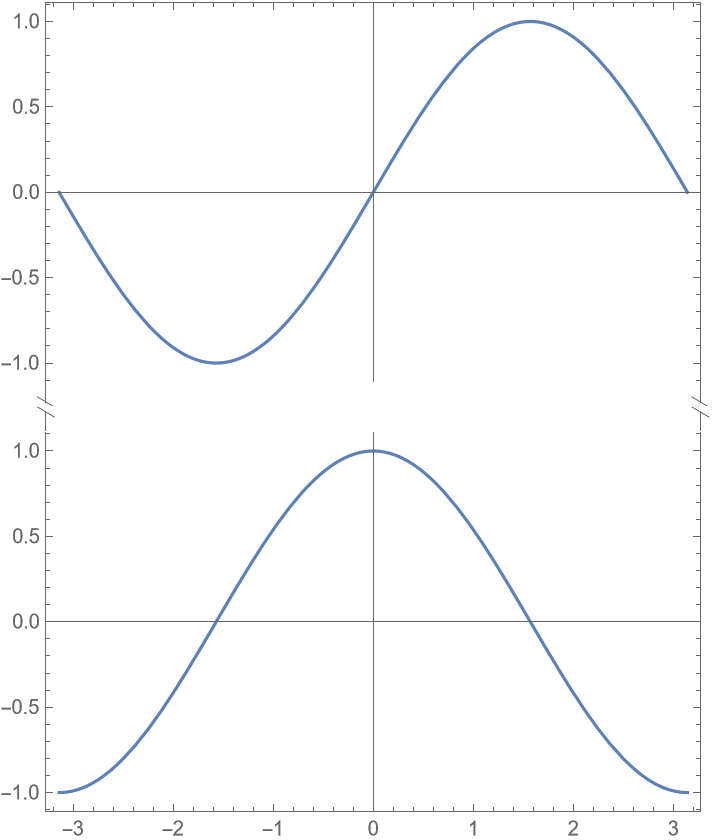
![ResourceFunction["PlotGrid"][
{
{Plot[Sin[x], {x, -\[Pi], \[Pi]}, Frame -> True]},
{Plot[Cos[x], {x, -\[Pi], \[Pi]}, Frame -> True]}
},
"MergeAxes" -> "Cut",
Spacings -> 25
]](https://www.wolframcloud.com/obj/resourcesystem/images/0c9/0c901f1c-a26c-456a-8626-b51f25a95ec7/5114032811dcf0fb.png)
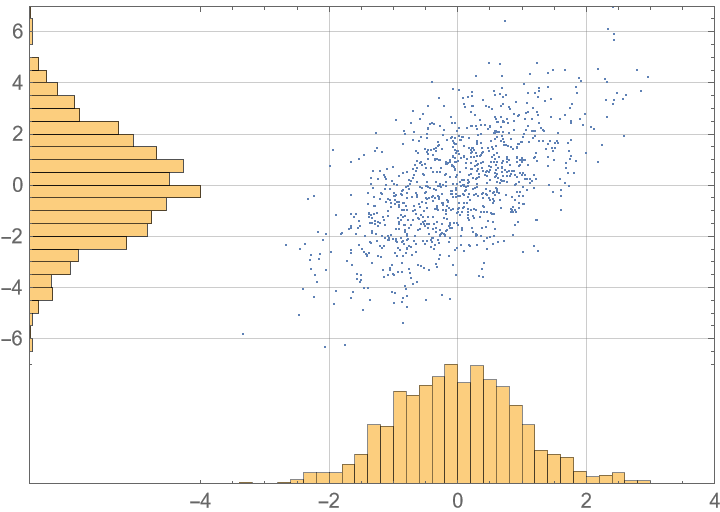
![data =
RandomVariate[
BinormalDistribution[{0, 0}, {1, 2}, 0.6], 1000
];
ResourceFunction["PlotGrid"][
{
{Histogram[data[[All, 2]], 20, Sequence[
BarOrigin -> Left, Frame -> True, FrameTicks -> {{True, False}, {False, False}}, PlotRange -> {Automatic, {-7, 7}}, PlotRangePadding -> 0, GridLines -> {None, Automatic}]],
ListPlot[data, Sequence[
Axes -> False, Frame -> True, GridLines -> Automatic, PlotRangePadding -> 0, PlotRange -> {{-4, 4}, {-7, 7}}]]},
{Graphics[{}, Frame -> True, FrameTicks -> None],
Histogram[data[[All, 1]],
20, Sequence[
Frame -> True, FrameTicks -> {{False, False}, {True, False}}, PlotRange -> {{-4, 4}, Automatic}, PlotRangePadding -> 0, GridLines -> {Automatic, None}]]
}
},
ItemSize -> {{1, 3}, {3, 1}},
"MergeAxes" -> None
]](https://www.wolframcloud.com/obj/resourcesystem/images/0c9/0c901f1c-a26c-456a-8626-b51f25a95ec7/052f485188dbacca.png)
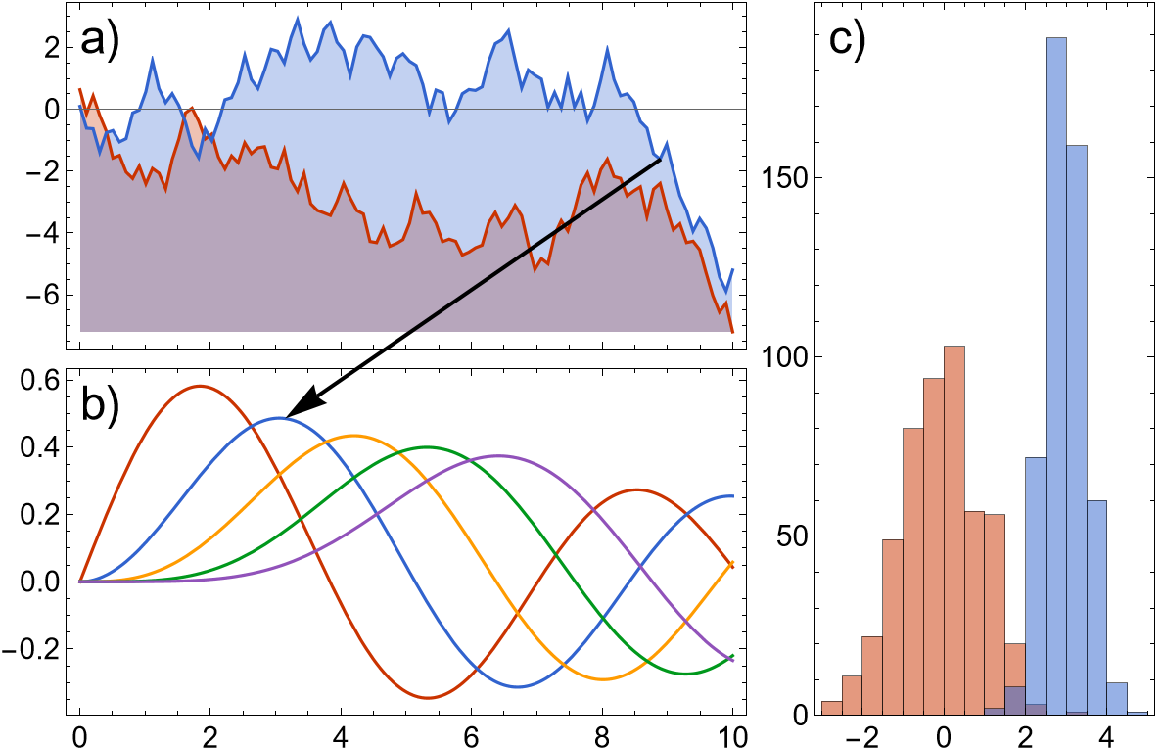
![SeedRandom[1];
data1 = Accumulate /@ RandomReal[{-1, 1}, {2, 100}];
data2 = {
RandomVariate[NormalDistribution[0, 1], 500],
RandomVariate[NormalDistribution[3, 1/2], 500]
};
func3 = Table[BesselJ[n, x], {n, 5}];
ResourceFunction["PlotGrid"][
{{
ListLinePlot[
data1,
Sequence[
Frame -> True, PlotTheme -> "VibrantColors", Filling -> Bottom, DataRange -> {0, 10}, BaseStyle -> {FontSize -> 15}, FrameStyle -> Black]
],
Histogram[
data2,
Sequence[
Frame -> True, PlotTheme -> "VibrantColors", BaseStyle -> {FontSize -> 15}, FrameStyle -> Black]
]
},
{
Plot[
Evaluate@func3,
{x, 0, 10},
Sequence[
Frame -> True, PlotTheme -> "VibrantColors", BaseStyle -> {FontSize -> 15}, FrameStyle -> Black]
], SpanFromAbove}},
Spacings -> {35, 10},
"ShowFrameLabels" -> {{Automatic}, {Full}},
PlotLabels -> Automatic -> Style["a)", Large, Black],
ItemSize -> {{2, 1}, 1.59},
ImageSize -> 590,
Epilog -> {Black, Thick, Arrow@{{1, 1} -> {8.9, data1[[2, 89]]}, {2, 1} -> Block[{x = Pi}, {x, func3[[2]]}]}}
]](https://www.wolframcloud.com/obj/resourcesystem/images/0c9/0c901f1c-a26c-456a-8626-b51f25a95ec7/6e7d71ab3d5e671e.png)
