Wolfram Function Repository
Instant-use add-on functions for the Wolfram Language
Function Repository Resource:
Plot data together with a visualization of the squared errors compared to a fit
ResourceFunction["LeastSquaresPlot"][data] plots data together with the linear best fit and the squared errors. | |
ResourceFunction["LeastSquaresPlot"][data,n] uses the order-n best fit. | |
ResourceFunction["LeastSquaresPlot"][data,expr,var] also plots the curve given by expr and the variable var. |
Show the squared errors of a linear fit to some data. A tooltip on each square gives its area:
| In[1]:= |
| Out[1]= | 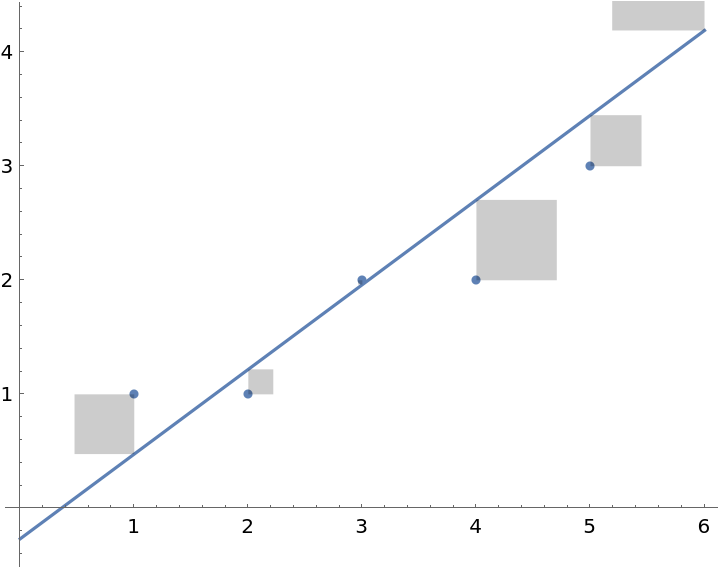 |
Show the squared errors of a quadratic fit to some data. A tooltip on each square gives its area:
| In[2]:= |
| Out[2]= | 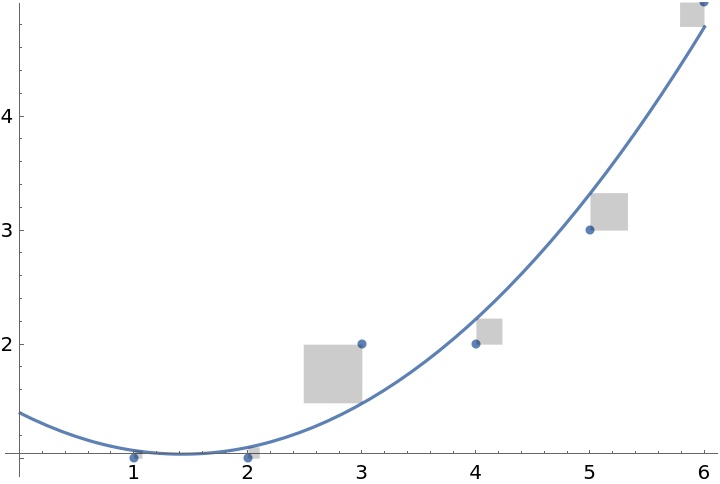 |
Compare the errors to the parabola y=x2/10:
| In[3]:= |
| Out[3]= | 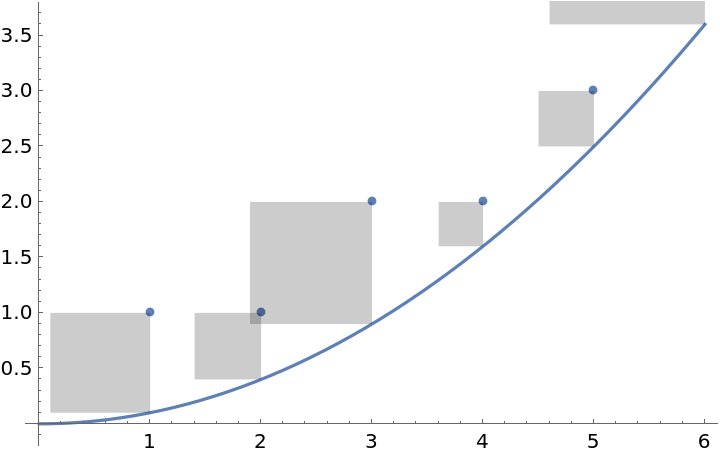 |
All options for ListPlot are supported, along with an option "SquareStyle" to control the error squares:
| In[4]:= |
| Out[4]= | 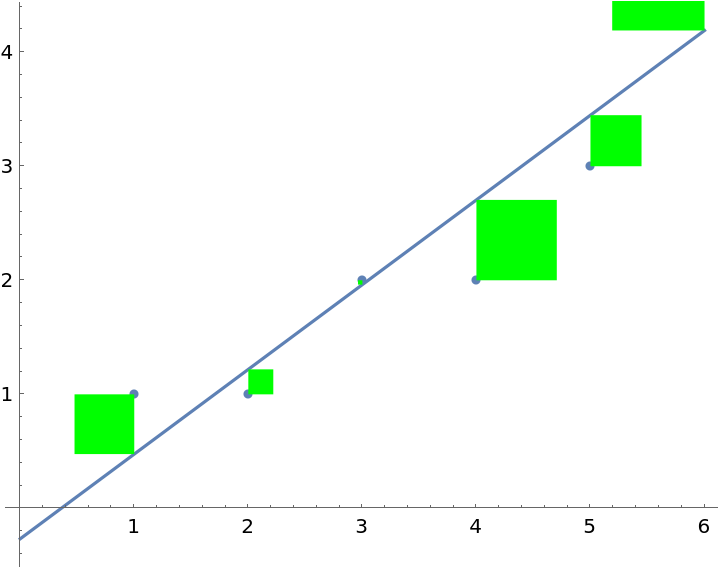 |
This work is licensed under a Creative Commons Attribution 4.0 International License