Basic Examples (3)
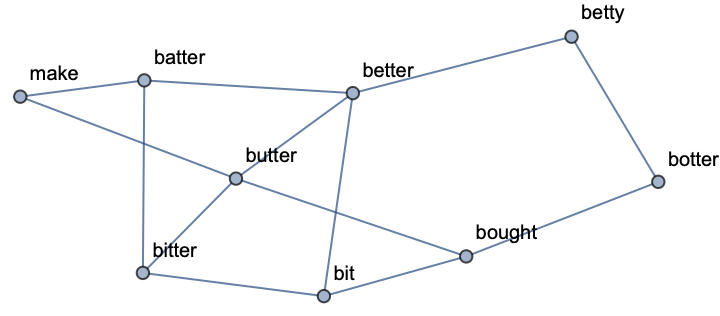
Consider an English tongue twister:
Find the nine most frequently used words (not counting stop words) and see which words are directly next to each other in the text:
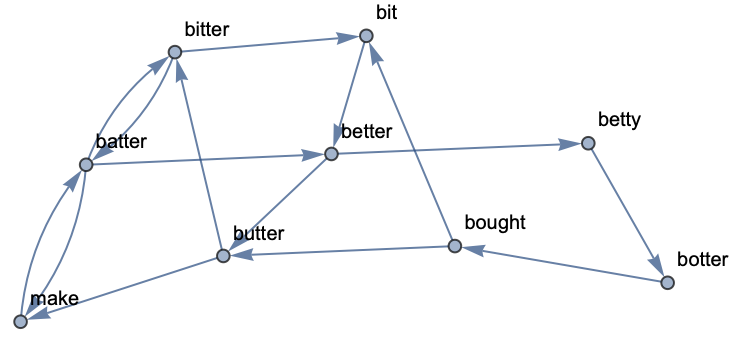
You can also find the order in which words follow each other:
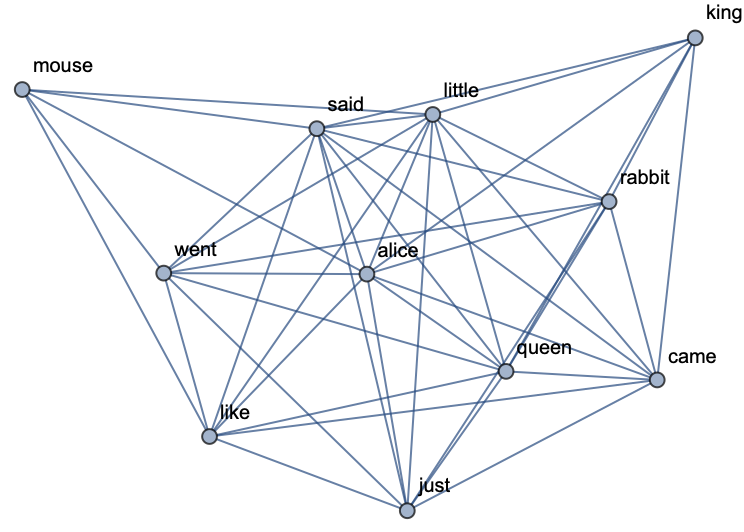
Scope (5)
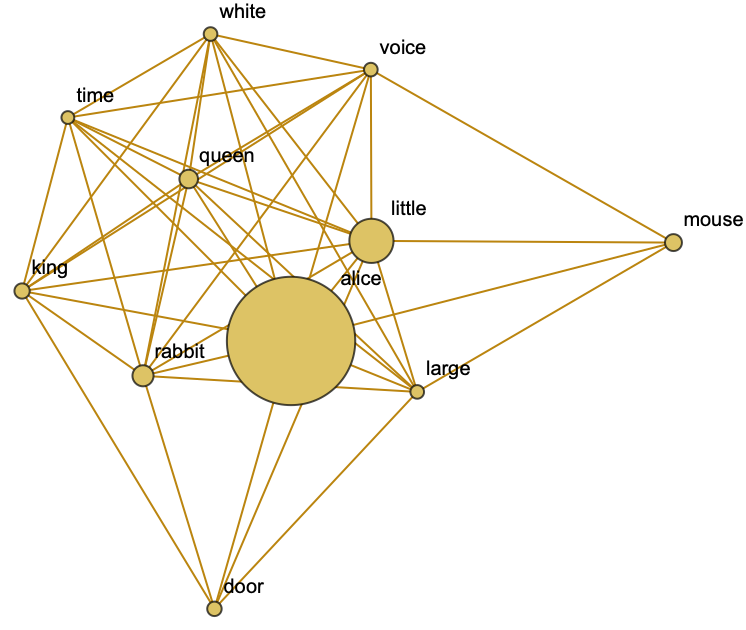
Get the text of the book Alice In Wonderland and build a keywords graph for the top eleven keywords:
Exclude the unwanted words by forming a blacklist. You can also apply any option of Graph. For instance, you can restyle your graph and resize vertices in accordance with their properties:
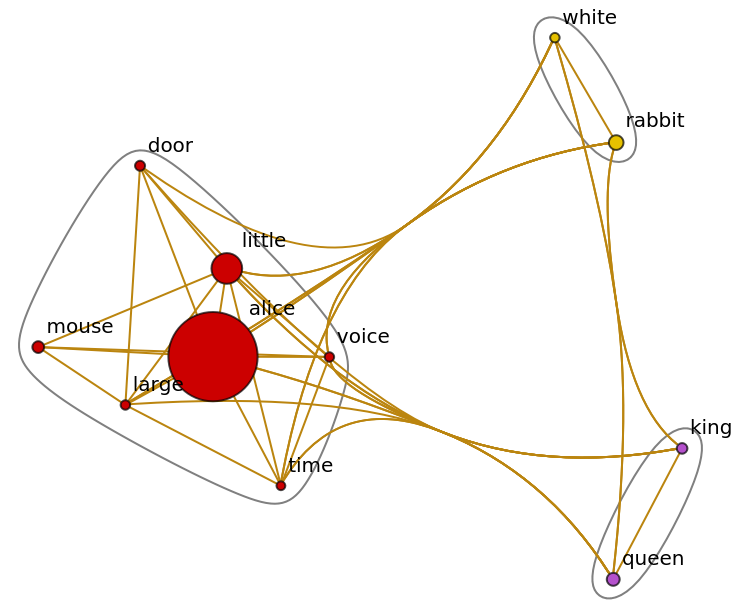
Because KeywordsGraph yields a Graph expression, you can apply any functions to it that you can apply to a Graph. For instance, you can find clustering by displaying community structure (note, because edges are weighted they might influence how the clustering is computed):
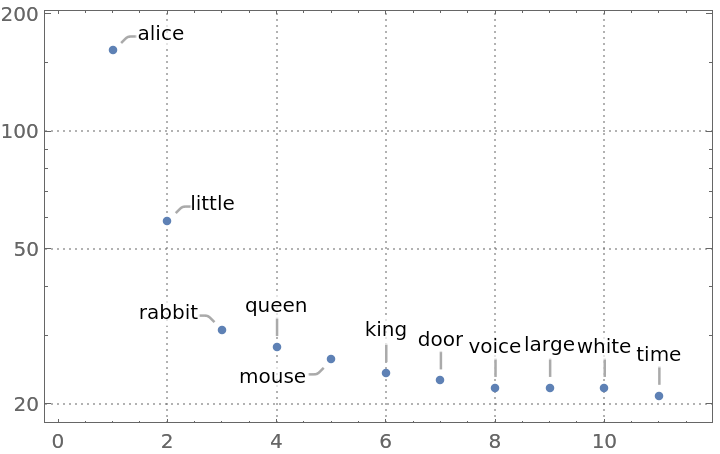
VertexWeight and EdgeWeight are set to the numbers of times keywords and their next-neighbor pairs are met in a text:
The order of numbers of VertexWeight corresponds to the order of VertexList:
Options (6)
LowerCase (3)
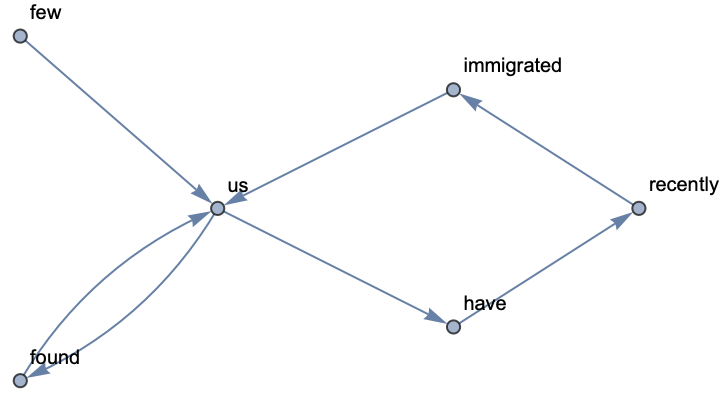
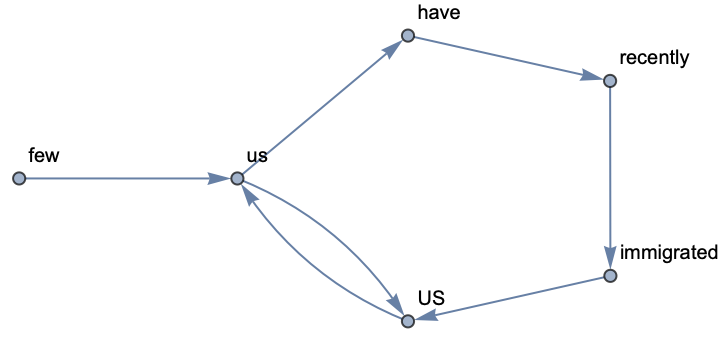
Consider a text where capitalization matters. For instance, here "us" and "US" are different terms:
By default ToLowerCase is applied and "us" is not distinguished from "US":
Use option "LowerCase"→False to distinguish capitalized cases:
StopWords (3)
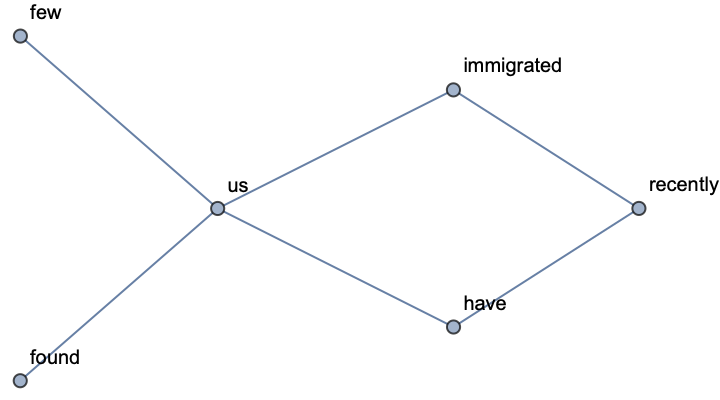
Sometimes you might need to keep some stop words. For example, consider "us" and "US" here:
By default "us" and "US" will be removed by DeleteStopwords:
Use option "StopWords"→False to retain some stopwords and make your own blacklist of words to remove:
Applications (4)
Get the dataset for presidential inaugural addresses from the Wolfram Data Repository and order it by time:
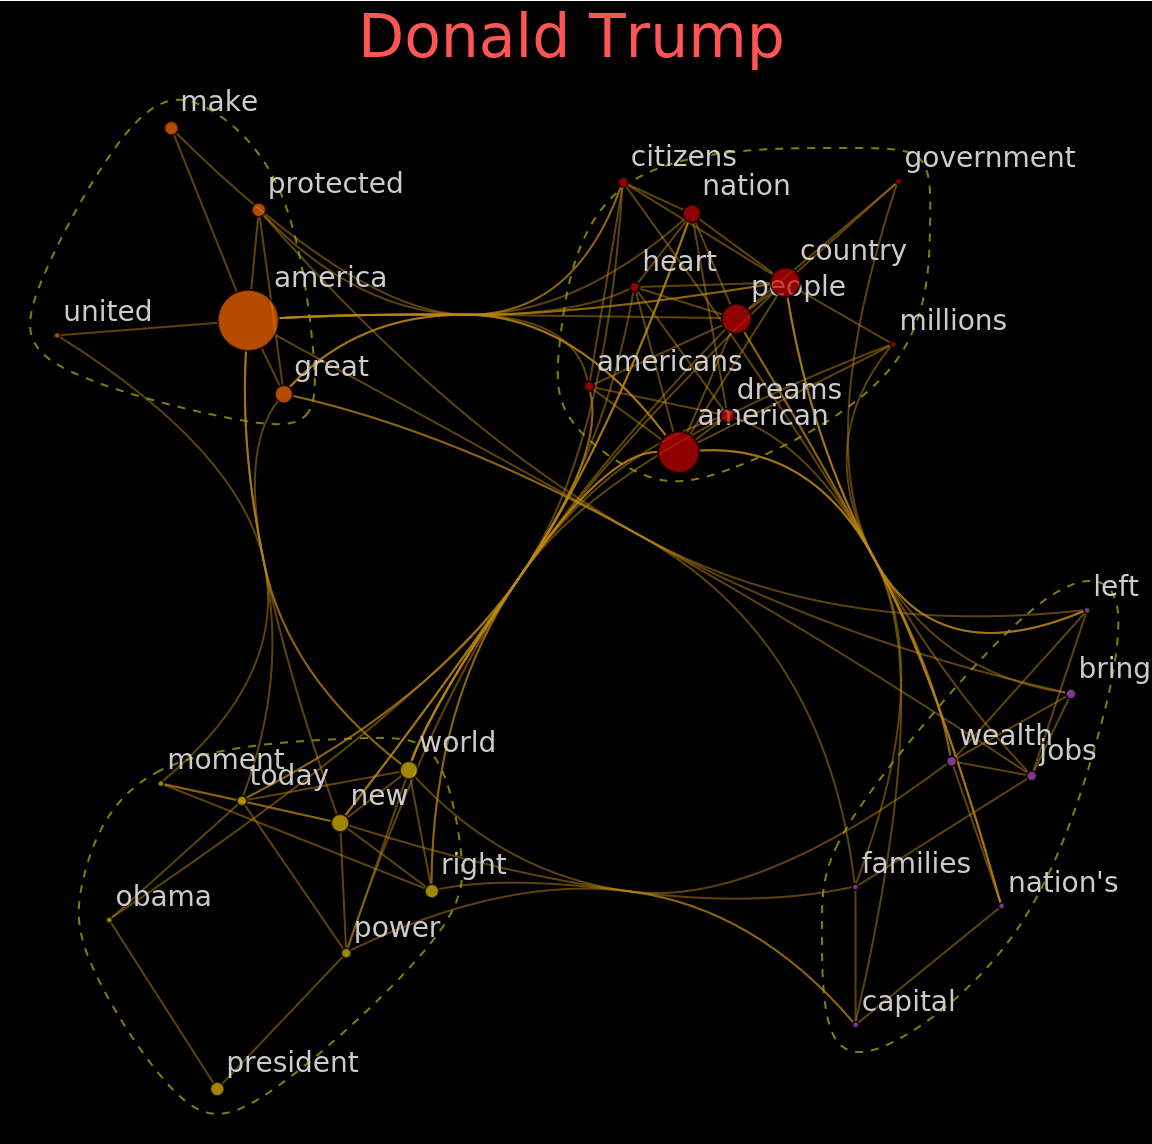
Extract the text of inaugural addresses for the two last presidents as of 2019 - Barack Obama and Donald Trump:
Define graph styles:
Build KeywordsGraph for Barack Obama and Donald Trump using 30 keywords. You can get the notion of key ideas without actually reading the texts:
Possible Issues (1)
The second argument (number of keywords in graph) should not exceed the total number of keywords in the text:
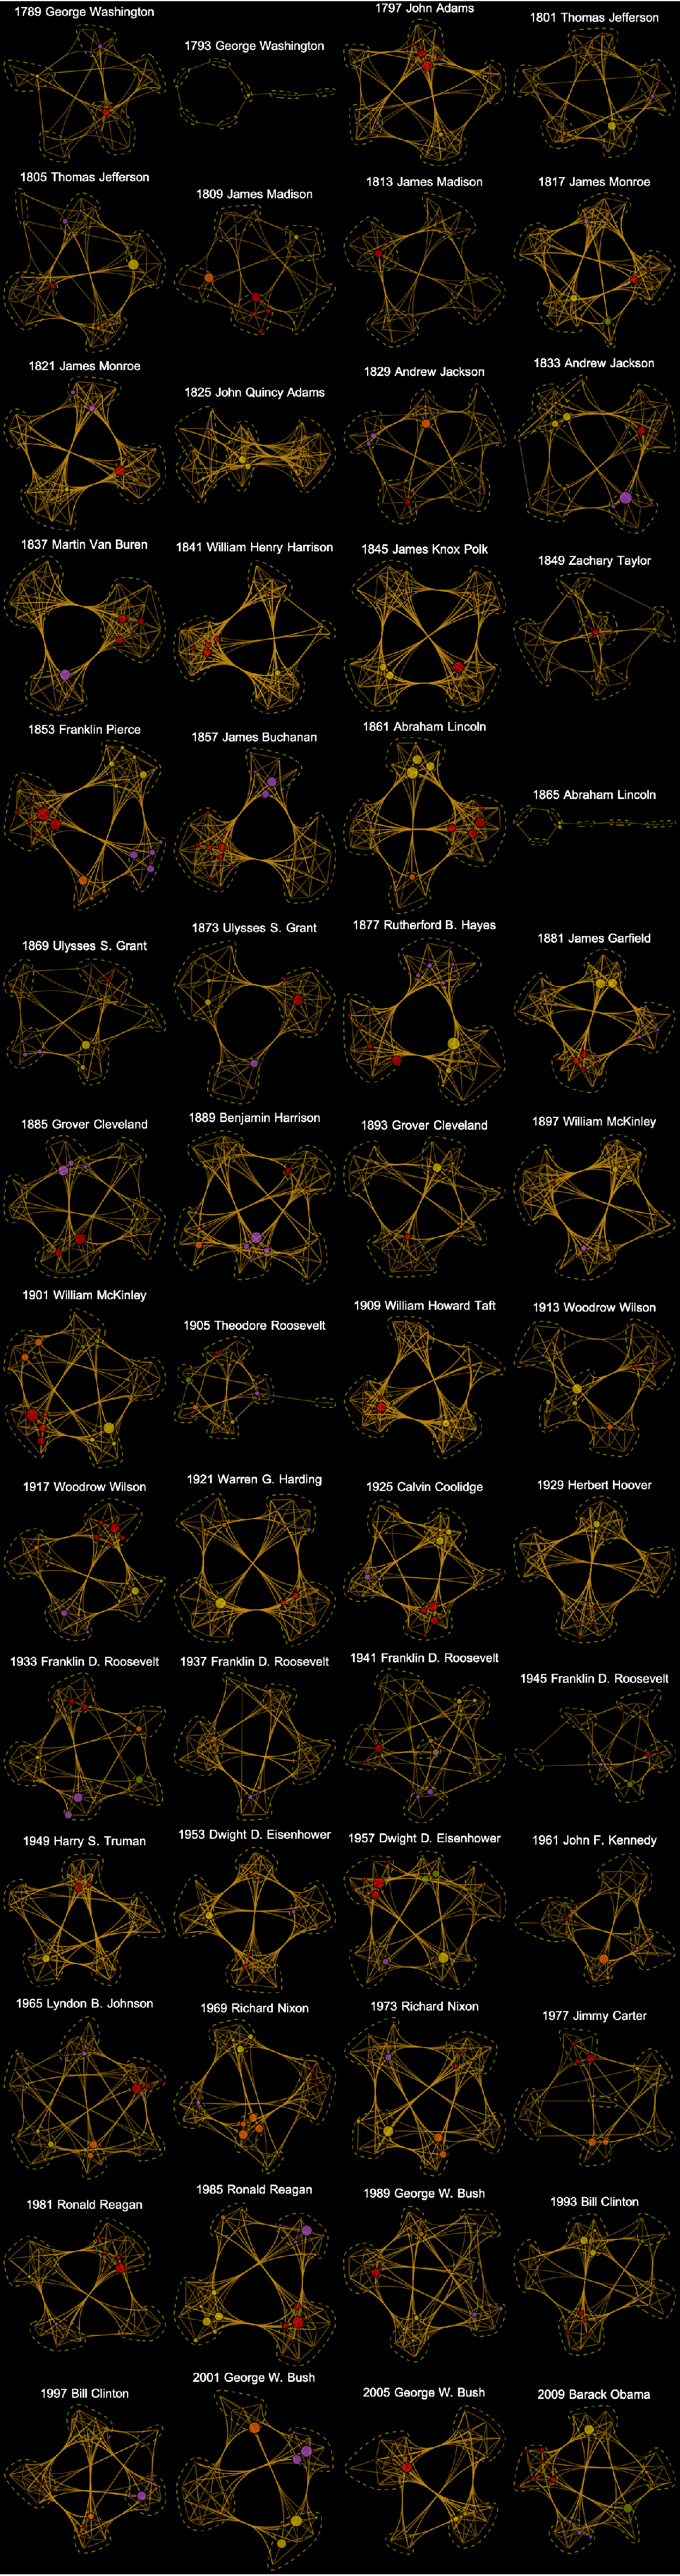
Neat Examples (3)
Get the dataset for presidential inaugural addresses from the Wolfram Data Repository and order it by time:
Define graph styles:
Build a keywords graph for each address using 30 keywords and arrange them in a grid:
![text = "Betty Botter bought some butter
But she said the butter\[CloseCurlyQuote]s bitter
If I put it in my batter, it will make my batter bitter
But a bit of better butter will make my batter better
So \[OpenCurlyQuote]twas better Betty Botter bought a bit of better butter";](https://www.wolframcloud.com/obj/resourcesystem/images/403/40370771-2a44-46eb-a904-7832270f3519/1-0-0/6178a568fb8a5b1a.png)
![styles = {
VertexLabelStyle -> Directive[GrayLevel[.8], 14],
EdgeStyle -> Opacity[.5],
VertexSize -> "VertexWeight",
VertexStyle -> Opacity[.7],
GraphStyle -> "Prototype",
Background -> Black};](https://www.wolframcloud.com/obj/resourcesystem/images/403/40370771-2a44-46eb-a904-7832270f3519/1-0-0/2fc4220f56eb29c0.png)
![CommunityGraphPlot[
ResourceFunction["KeywordsGraph"][obama, 30, {}, styles],
PlotLabel -> Style["Barack Obama", 30, Lighter@Blue, FontFamily -> "Phosphate"],
CommunityBoundaryStyle -> Directive[Yellow, Dashed, Opacity[.5]]]](https://www.wolframcloud.com/obj/resourcesystem/images/403/40370771-2a44-46eb-a904-7832270f3519/1-0-0/71596e84ff1dc1ad.png)

![CommunityGraphPlot[
ResourceFunction["KeywordsGraph"][trump, 30, {}, styles],
PlotLabel -> Style["Donald Trump", 30, Lighter@Red, FontFamily -> "Phosphate"],
CommunityBoundaryStyle -> Directive[Yellow, Dashed, Opacity[.5]]]](https://www.wolframcloud.com/obj/resourcesystem/images/403/40370771-2a44-46eb-a904-7832270f3519/1-0-0/316e7925daffdeb5.png)

![styles = {
VertexLabels -> None,
EdgeStyle -> Opacity[.5],
VertexSize -> "VertexWeight",
VertexStyle -> Opacity[.7],
GraphStyle -> "Prototype",
Background -> Black};](https://www.wolframcloud.com/obj/resourcesystem/images/403/40370771-2a44-46eb-a904-7832270f3519/1-0-0/429e49c88ffca030.png)
![allGRAPH = MapThread[
CommunityGraphPlot[
ResourceFunction["KeywordsGraph"][#1, 30, {}, styles],
PlotLabel -> Style[#2, White, 13],
CommunityBoundaryStyle -> Directive[Yellow, Dashed, Opacity[.5]]] &,
{allTEXT, allNAME}];](https://www.wolframcloud.com/obj/resourcesystem/images/403/40370771-2a44-46eb-a904-7832270f3519/1-0-0/753462ec95a8e8da.png)