Basic Examples (3)
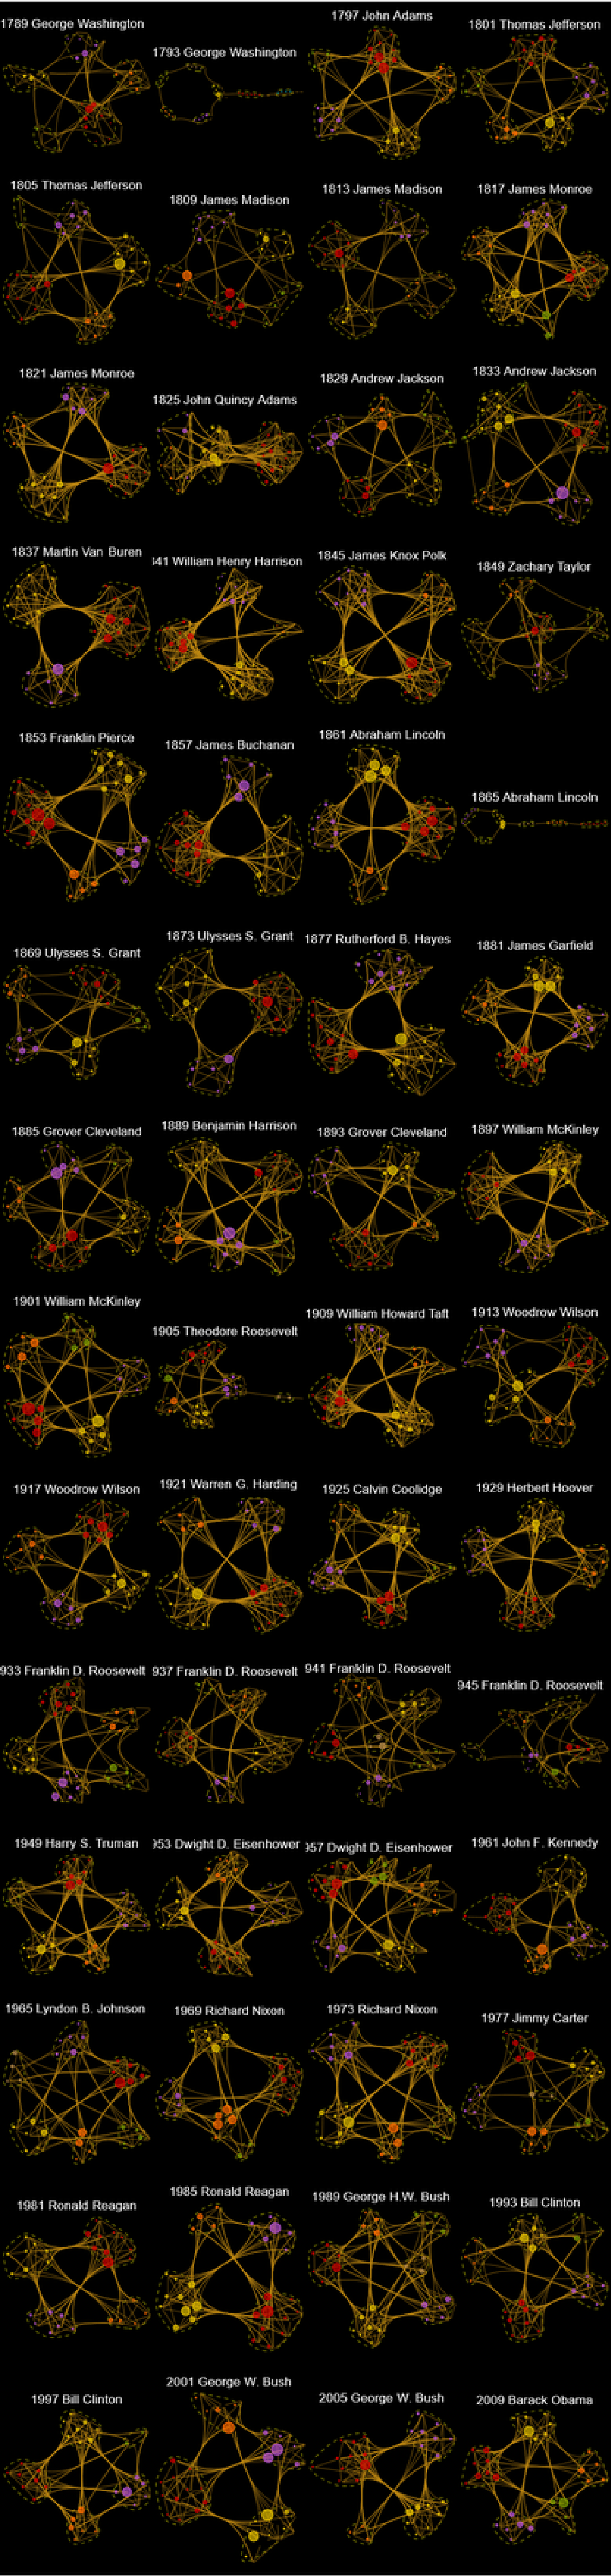
Consider an English tongue twister:
Find the nine most frequently used words (not counting stop words) and see which words are directly next to each other in the text:
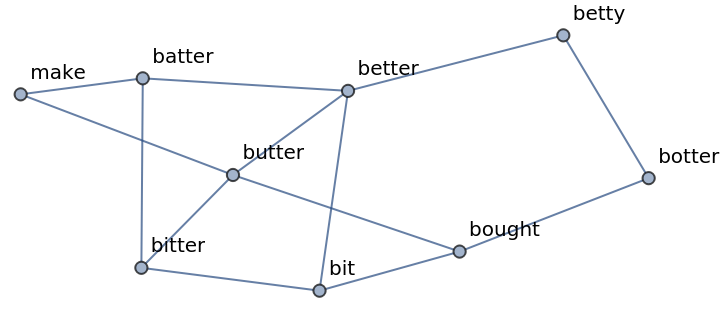
You can also find the order in which words follow each other:
Scope (2)
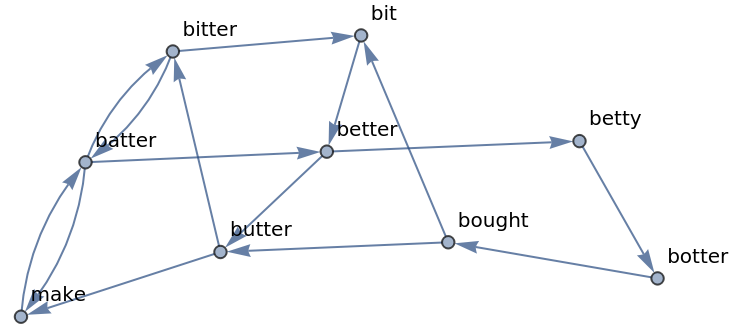
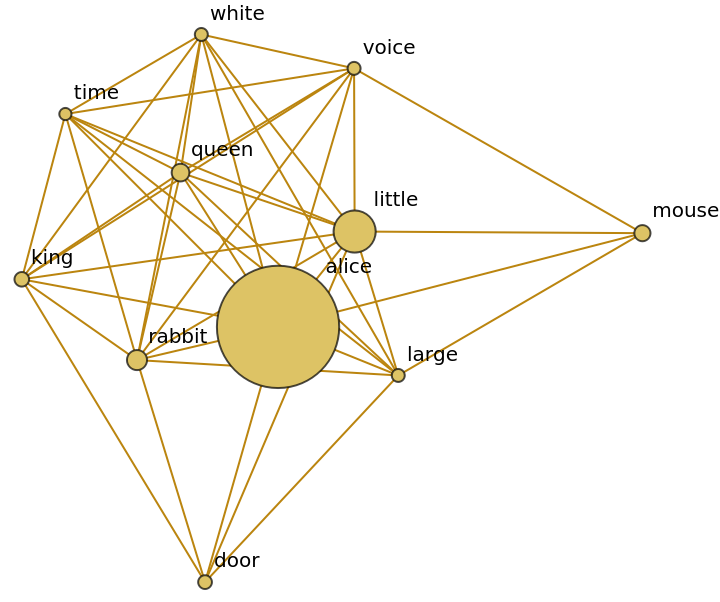
Get the text of the book Alice In Wonderland and build a keywords graph for the top eleven keywords:
Exclude the unwanted words by forming a blacklist. You can also apply any option of Graph. For instance, you can restyle your graph and resize vertices in accordance with their properties:
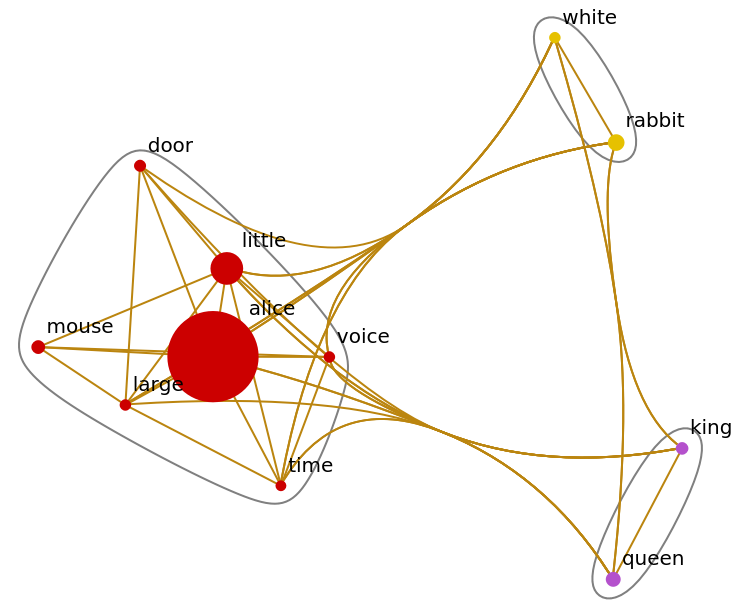
Because KeywordsGraph yields a Graph expression, you can apply any functions to it that you can apply to a Graph. For instance, you can find clustering by displaying community structure (note, because edges are weighted they might influence how the clustering is computed):
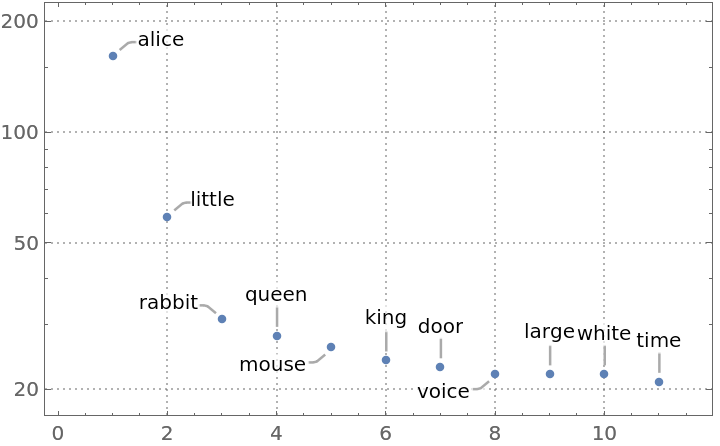
VertexWeight and EdgeWeight are set to the numbers of times keywords and their next-neighbor pairs are met in a text:
The order of numbers of VertexWeight corresponds to the order of VertexList:
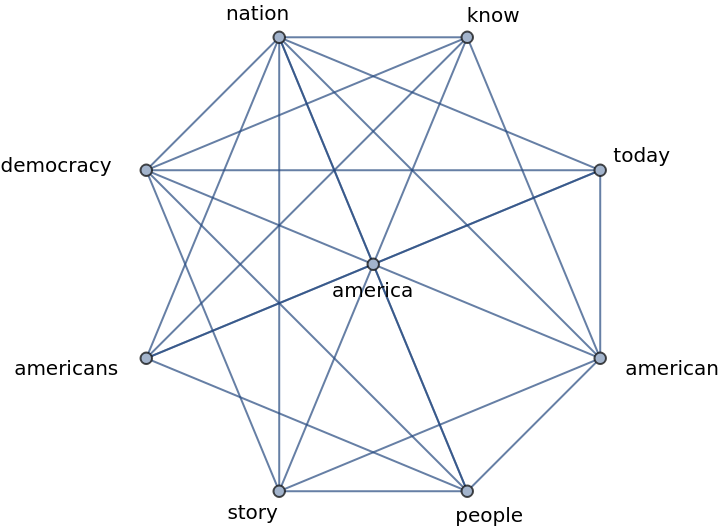
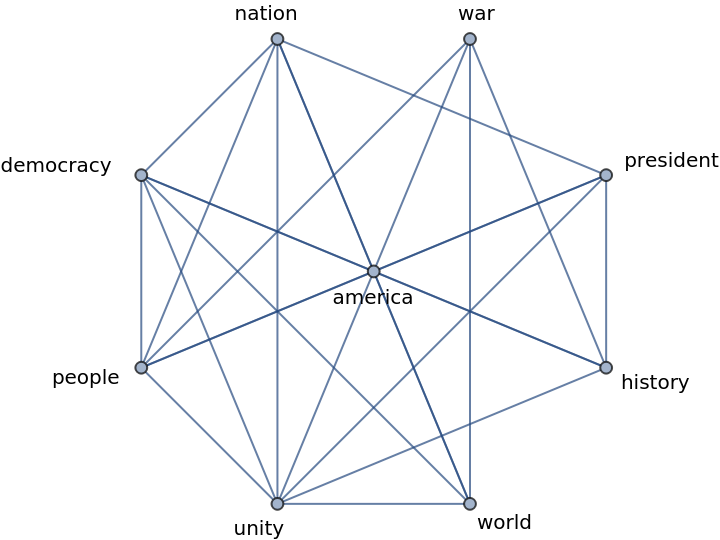
Occasionally one needs to replace some words with others. Use a list of replacement rules to achieve that. For example, consider the inaugural address by president Joe Biden:
There are many words in the inaugural address that could be considered as redundant in meaning, such as "america", "american", and "americans":
Consolidate these redundant words in a single term of your choice, for instance "america":
Note that the separate counts for all 3 words (18, 9, and 9 correspondingly) were summed to 36 to represent the consolidated word:
Options (6)
LowerCase (3)
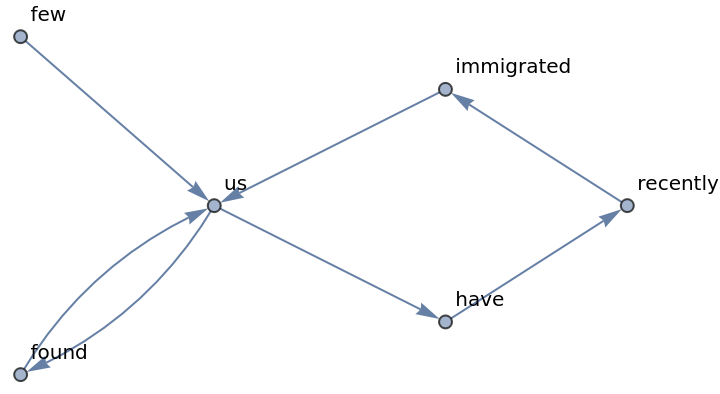
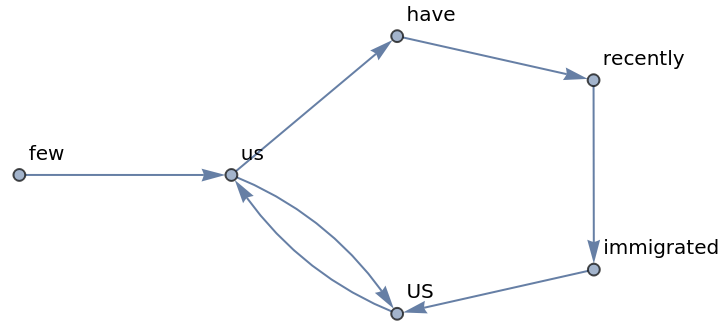
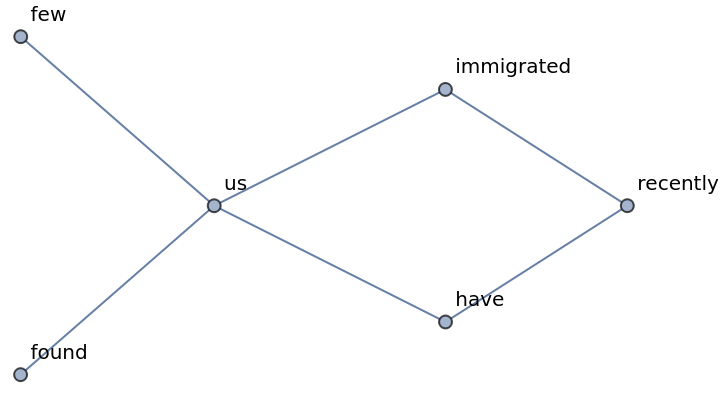
Consider a text where capitalization matters. For instance, here "us" and "US" are different terms:
By default ToLowerCase is applied and "us" is not distinguished from "US":
Use the option setting "LowerCase"→False to distinguish capitalized cases:
StopWords (3)
Sometimes you might need to keep some stop words. For example, consider "us" and "US" here:
By default "us" and "US" will be removed by DeleteStopwords:
Use the option setting "StopWords"→False to retain some stopwords and make your own blacklist of words to remove:
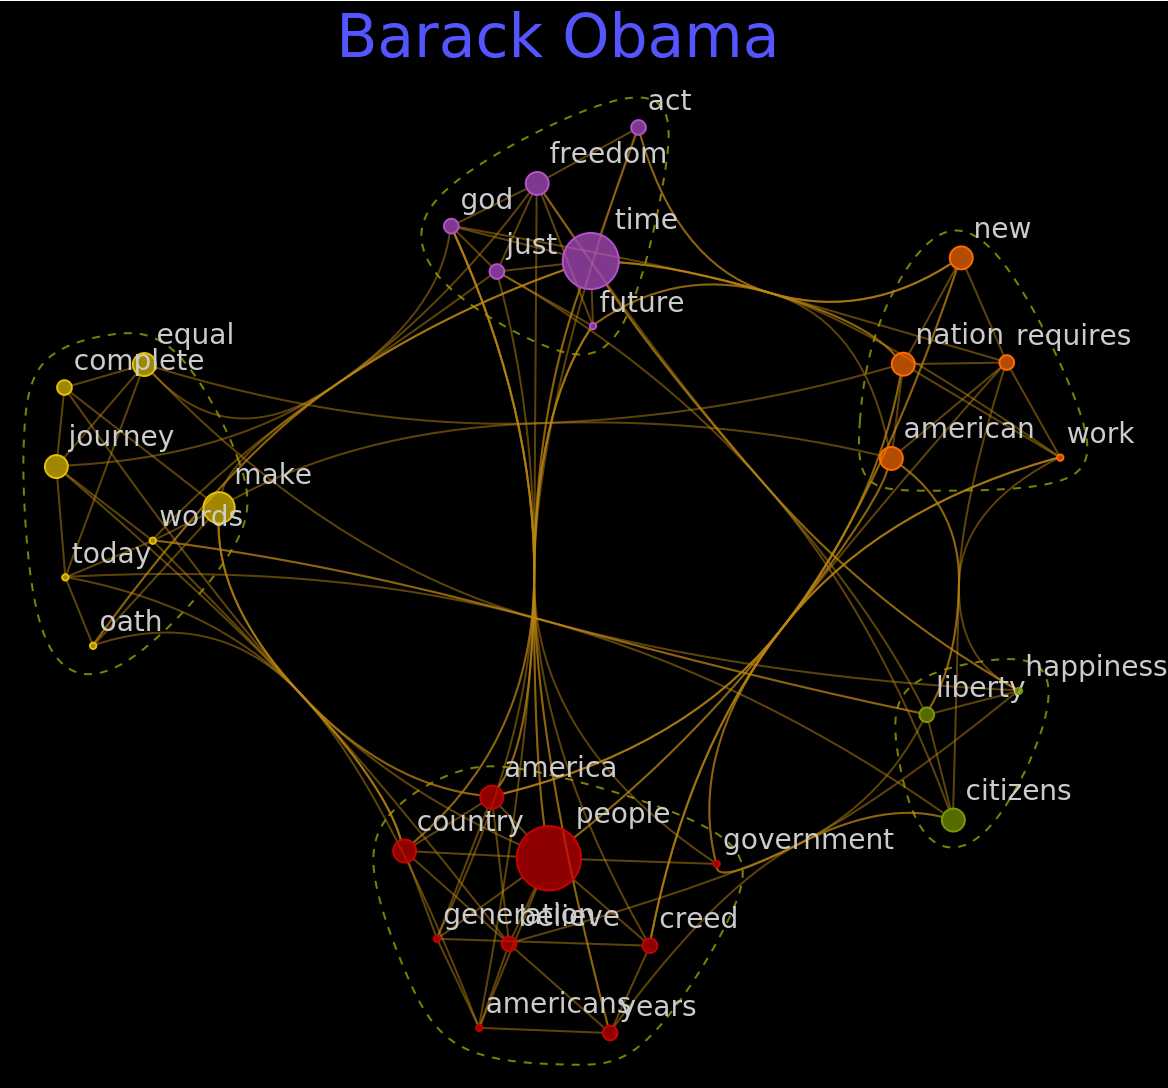
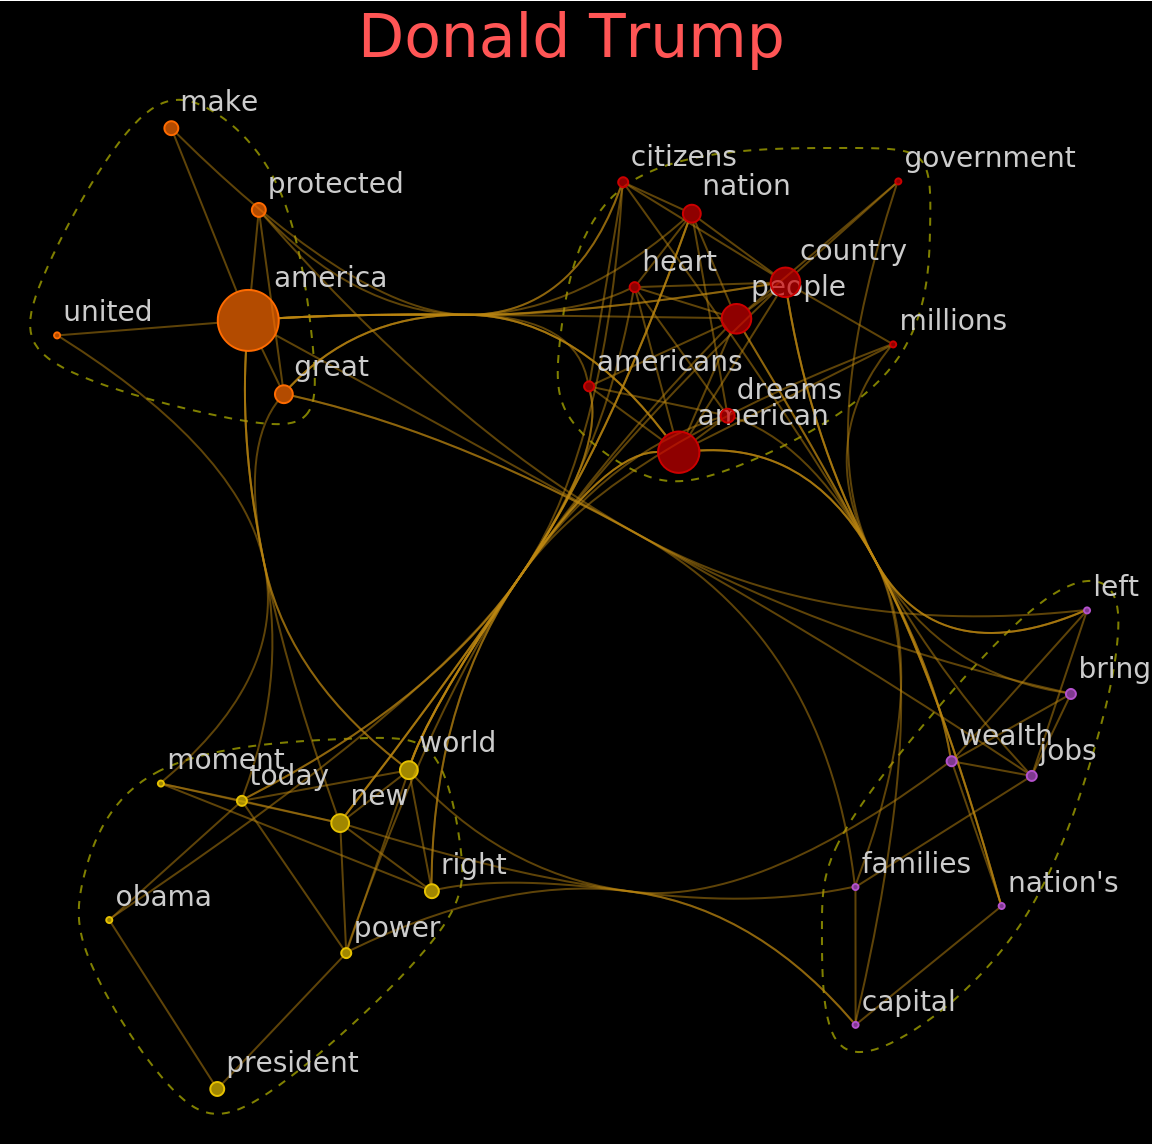
Applications (3)
Get the dataset for presidential inaugural addresses from the Wolfram Data Repository and order it by time:
Extract the text of inaugural addresses for the two last presidents as of 2019 - Barack Obama and Donald Trump:
Build KeywordsGraph for Barack Obama and Donald Trump using 30 keywords. You can get the notion of key ideas without actually reading the texts:
![text = "Betty Botter bought some butter
But she said the butter\[CloseCurlyQuote]s bitter
If I put it in my batter, it will make my batter bitter
But a bit of better butter will make my batter better
So \[OpenCurlyQuote]twas better Betty Botter bought a bit of better butter";](https://www.wolframcloud.com/obj/resourcesystem/images/403/40370771-2a44-46eb-a904-7832270f3519/0333cbf05b9d0f97.png)
![blist = {"story", "know", "today"};
rlist = {"american" -> "america", "americans" -> "america"};
g2 = ResourceFunction["KeywordsGraph"][biden, 9, blist, rlist, GraphLayout -> "RadialEmbedding"]](https://www.wolframcloud.com/obj/resourcesystem/images/403/40370771-2a44-46eb-a904-7832270f3519/1b0fab7b645912e6.png)

![CommunityGraphPlot[
ResourceFunction["KeywordsGraph"][obama, 30, {}, {}, {VertexLabelStyle -> Directive[
GrayLevel[0.8], 14], EdgeStyle -> Opacity[0.5], VertexSize -> "VertexWeight", VertexStyle -> Opacity[0.7], GraphStyle -> "Prototype", Background -> GrayLevel[0]}],
PlotLabel -> Style["Barack Obama", 30, Lighter@Blue, FontFamily -> "Phosphate"],
CommunityBoundaryStyle -> Directive[Yellow, Dashed, Opacity[.5]]]](https://www.wolframcloud.com/obj/resourcesystem/images/403/40370771-2a44-46eb-a904-7832270f3519/39ed6a6733f618e2.png)
![CommunityGraphPlot[
ResourceFunction["KeywordsGraph"][trump, 30, {}, {}, {VertexLabelStyle -> Directive[
GrayLevel[0.8], 14], EdgeStyle -> Opacity[0.5], VertexSize -> "VertexWeight", VertexStyle -> Opacity[0.7], GraphStyle -> "Prototype", Background -> GrayLevel[0]}],
PlotLabel -> Style["Donald Trump", 30, Lighter@Red, FontFamily -> "Phosphate"],
CommunityBoundaryStyle -> Directive[Yellow, Dashed, Opacity[.5]]]](https://www.wolframcloud.com/obj/resourcesystem/images/403/40370771-2a44-46eb-a904-7832270f3519/5cded2c1ad03c9c3.png)
![allGRAPH = MapThread[
CommunityGraphPlot[
ResourceFunction["KeywordsGraph"][#1, 30, {}, {}, {VertexLabels -> None, EdgeStyle -> Opacity[0.5], VertexSize -> "VertexWeight", VertexStyle -> Opacity[0.7], GraphStyle -> "Prototype", Background -> GrayLevel[0]}],
PlotLabel -> Style[#2, White, 13],
CommunityBoundaryStyle -> Directive[Yellow, Dashed, Opacity[0.5]]] &,
{allTEXT, allNAME}];](https://www.wolframcloud.com/obj/resourcesystem/images/403/40370771-2a44-46eb-a904-7832270f3519/3bf4c6d55d5ac104.png)