Wolfram Function Repository
Instant-use add-on functions for the Wolfram Language
Function Repository Resource:
Plot the density of keywords in a piece of text
ResourceFunction["KeywordPlot"][text,keywords] generates a plot of the keyword's density within the given text. | |
ResourceFunction["KeywordPlot"][keywords] represents an operator form of ResourceFunction["KeywordPlot"] that can be applied to any string. |
| "PlotFunction" | Automatic | specify which plotting function to use; currently only SmoothHistogram is supported |
| "TopN" | All | specify to plot only the top‐n most frequent keywords |
Plot the density of characters in a string:
| In[1]:= |
| Out[1]= | 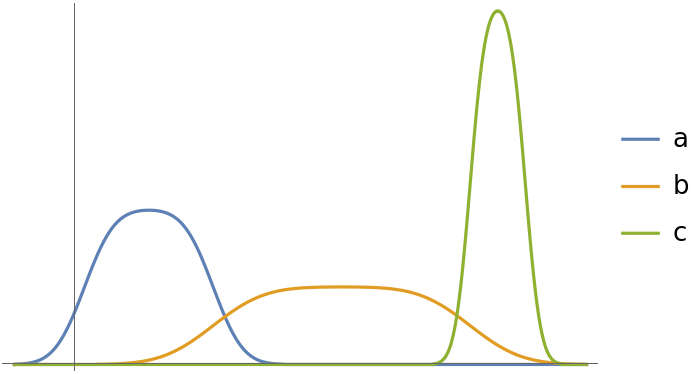 |
Plot the density of certain keywords in "Alice in Wonderland":
| In[2]:= | ![text = ExampleData[{"Text", "AliceInWonderland"}];
keywords = {"rabbit", "cat", "Queen"};
ResourceFunction["KeywordPlot"][text, keywords, PlotLegends -> Placed[keywords, {{.15, .8}}], PlotTheme -> "Business"]](https://www.wolframcloud.com/obj/resourcesystem/images/ece/ecede16e-5004-4b32-8d0b-4688904386b5/22504b9cba4b43cc.png) |
| Out[2]= | 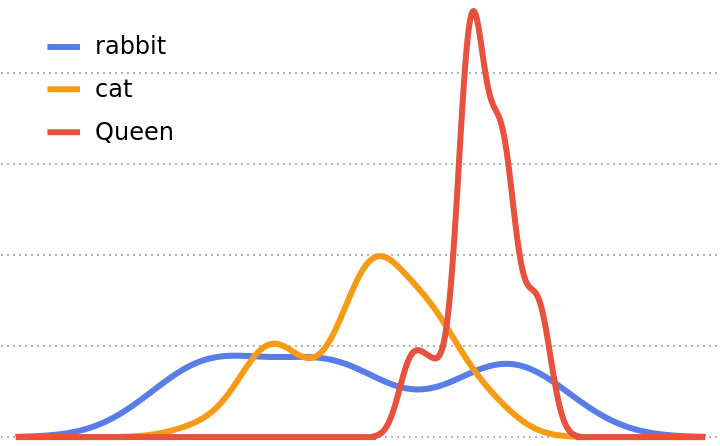 |
Plot character mentions through a play:
| In[3]:= | ![lesmis = Import["http://www.gutenberg.org/files/135/135-0.txt"];
characters = (Last@StringSplit@#["Label"]) & /@ WikidataData[
ExternalIdentifier["WikidataID", "Q180736", <|"Label" -> "Les Misérables", "Description" -> "1862 Victor Hugo novel"|>], ExternalIdentifier["WikidataID", "P674", <|"Label" -> "characters", "Description" -> "characters which appear in this item (like plays, operas, operettas, books, comics, films, TV series, video games)"|>]];](https://www.wolframcloud.com/obj/resourcesystem/images/ece/ecede16e-5004-4b32-8d0b-4688904386b5/6c5732d6f5e97f1c.png) |
| In[4]:= | ![Manipulate[Quiet@ResourceFunction["KeywordPlot"][lesmis,
characters,
"TopN" -> topN, PlotLabel -> "Top " <> ToString@topN <> " Characters in Les Miserables",
BaseStyle -> White, PlotTheme -> "Marketing", ImageSize -> 500, PlotRangePadding -> Scaled[.05]], {{topN, 3}, Range[1, 5], ControlType -> SetterBar}]](https://www.wolframcloud.com/obj/resourcesystem/images/ece/ecede16e-5004-4b32-8d0b-4688904386b5/62d19c8de88a09d6.png) |
| Out[4]= | 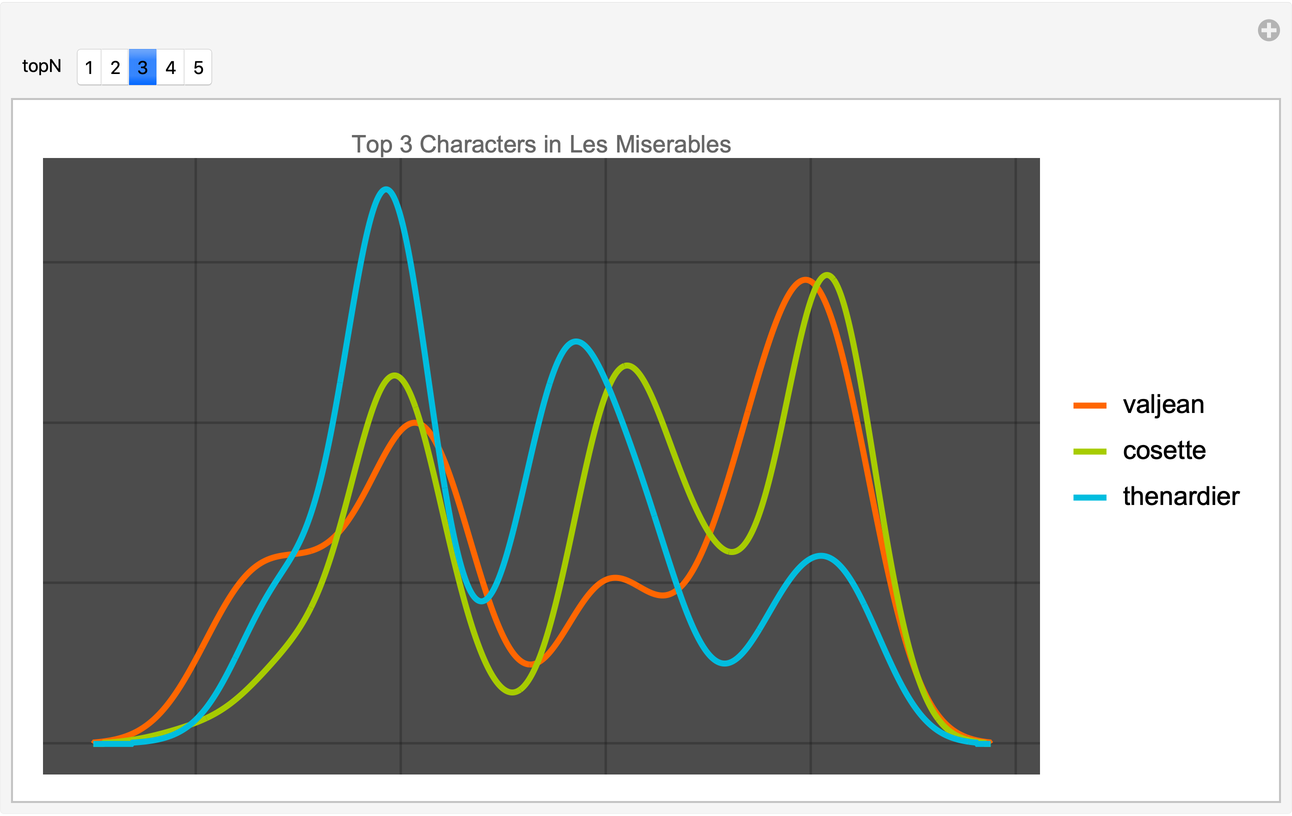 |
Plot the density of characters in a string:
| In[5]:= |
| Out[5]= |  |
If a keyword is not found in the text, it is automatically dropped from the plot:
| In[6]:= |
| Out[6]= | 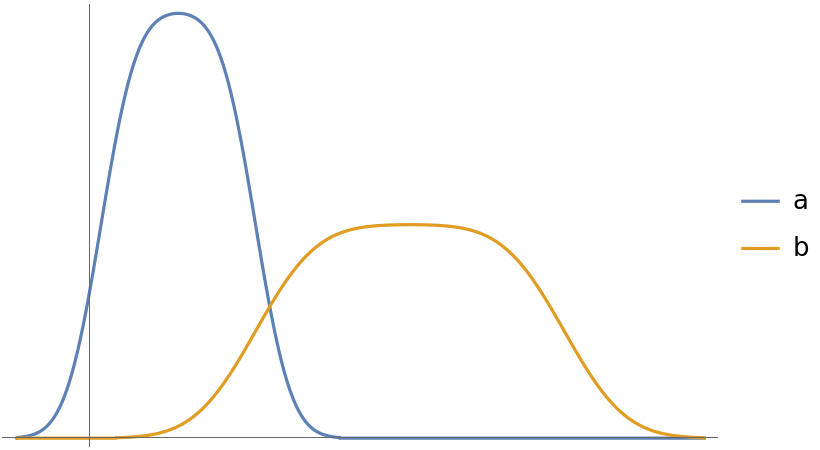 |
Of course, if no keywords are found, the plot will fail:
| In[7]:= |
| Out[7]= |
If keyword densities are too low, the plots may be look strange and spikey, e.g. relatively rare Greek god mentions in the Latin poem Aeneid:
| In[8]:= | ![aeneid = ExampleData[{"Text", "AeneidEnglish"}];
gods = #["Name"] & /@ EntityList[EntityClass["Mythology", "Greek"]];](https://www.wolframcloud.com/obj/resourcesystem/images/ece/ecede16e-5004-4b32-8d0b-4688904386b5/035eccaa579c2890.png) |
| In[9]:= |
| Out[9]= | 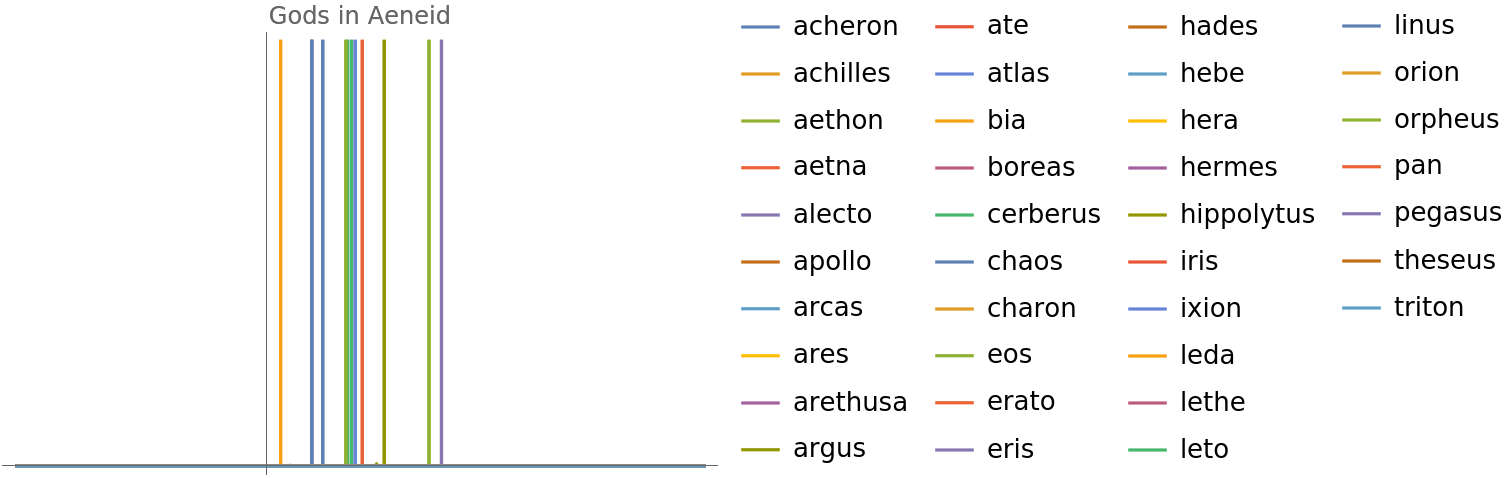 |
This work is licensed under a Creative Commons Attribution 4.0 International License