Wolfram Function Repository
Instant-use add-on functions for the Wolfram Language
Function Repository Resource:
Plot a set of inequalities distinguishing between different regions
ResourceFunction["InequalityPlot"][ineqs,x] plots a set of inequalities distinguishing between different regions and choosing ranges automatically. | |
ResourceFunction["InequalityPlot"][ineqs,{x,x0,xf}] plots a set of inequalities with one variable distinguishing between different regions from x0 to xf. | |
ResourceFunction["InequalityPlot"][ineqs,{x,y}] plots a set of inequalities with two independent variables. | |
ResourceFunction["InequalityPlot"][ineqs,{x,x0,xf},{y,y0,yf}] plots a set of inequalities with two variables from x0 to xf and from y0 to yf. | |
ResourceFunction["InequalityPlot"][ineqs,{x,y,z}] plots a set of inequalities with three independent variables. | |
ResourceFunction["InequalityPlot"][ineqs,{x,x0,xf},{y,y0,yf},{z,z0,zf}] plots a set of inequalities with three variables from x0 to xf, from y0 to yf and from z0 to zf. |
Inequalities in one dimension:
| In[1]:= |
| Out[1]= | 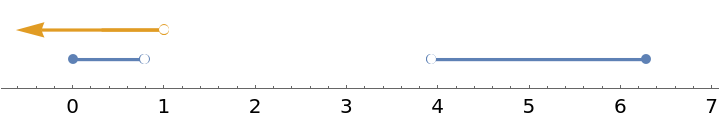 |
Inequalities in two dimensions:
| In[2]:= |
| Out[2]= | 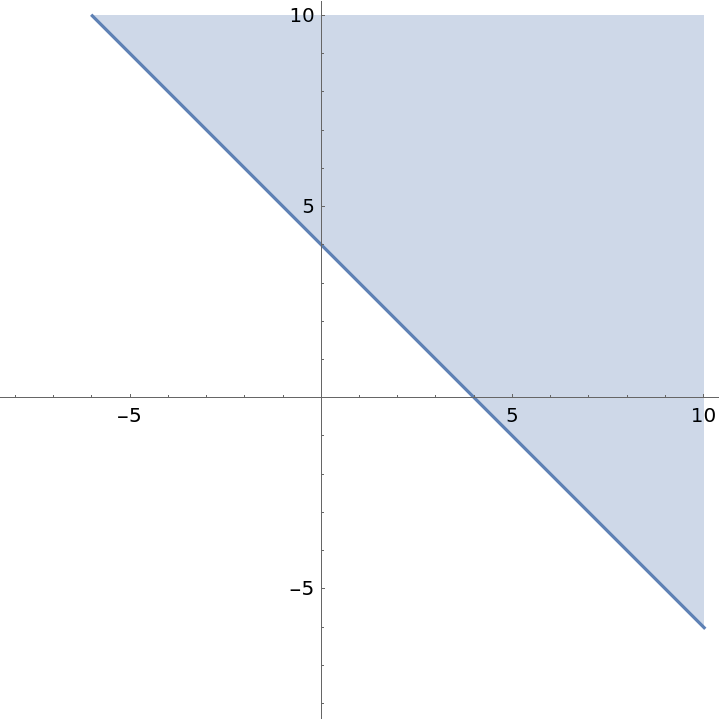 |
Intersection of a couple of lines:
| In[3]:= |
| Out[3]= | 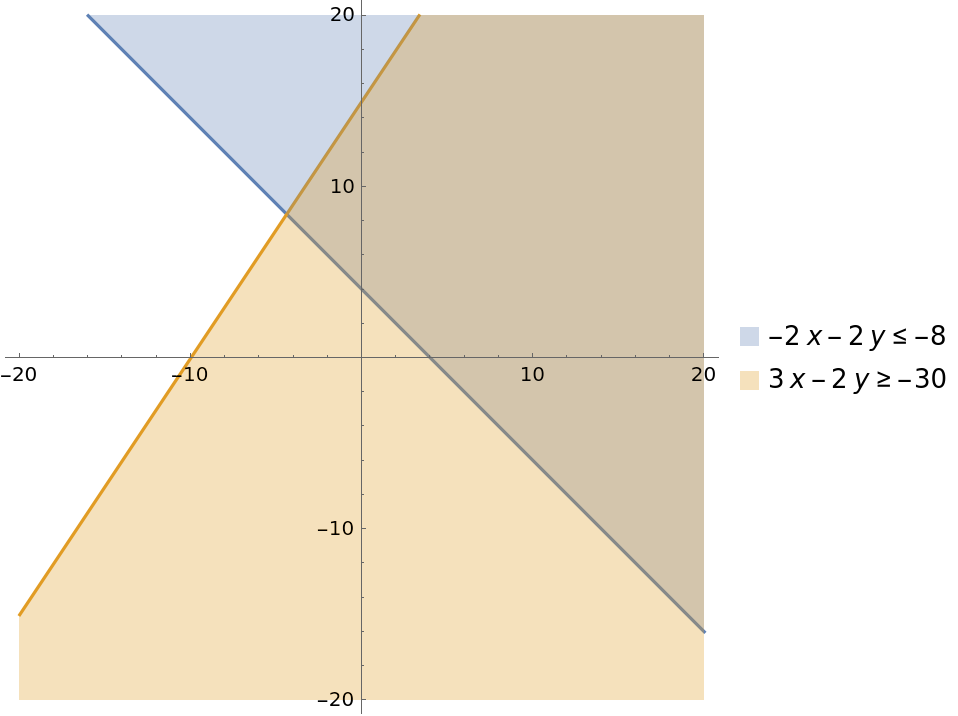 |
Dashed lines represent strict inequalities like Less and Greater:
| In[4]:= |
| Out[4]= | 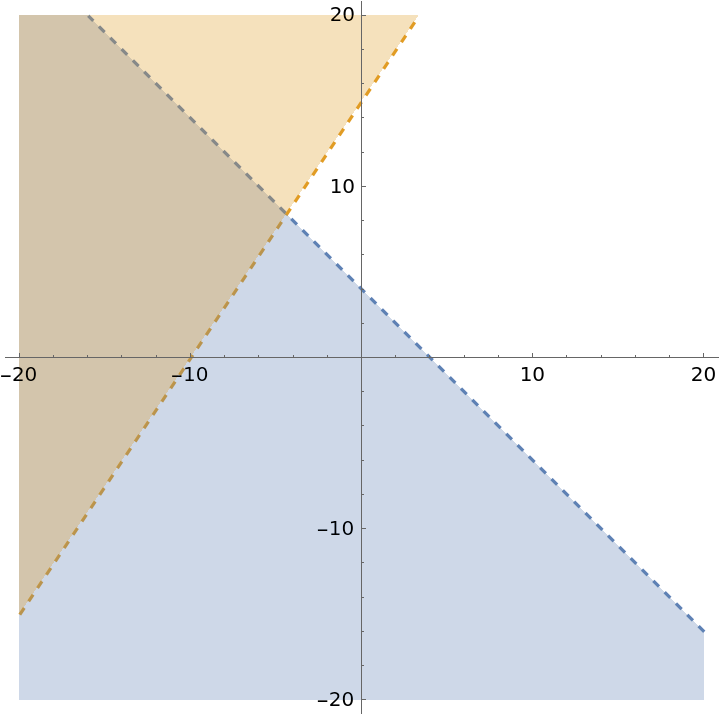 |
Without an explicit interval, the range is chosen automatically:
| In[5]:= |
| Out[5]= | 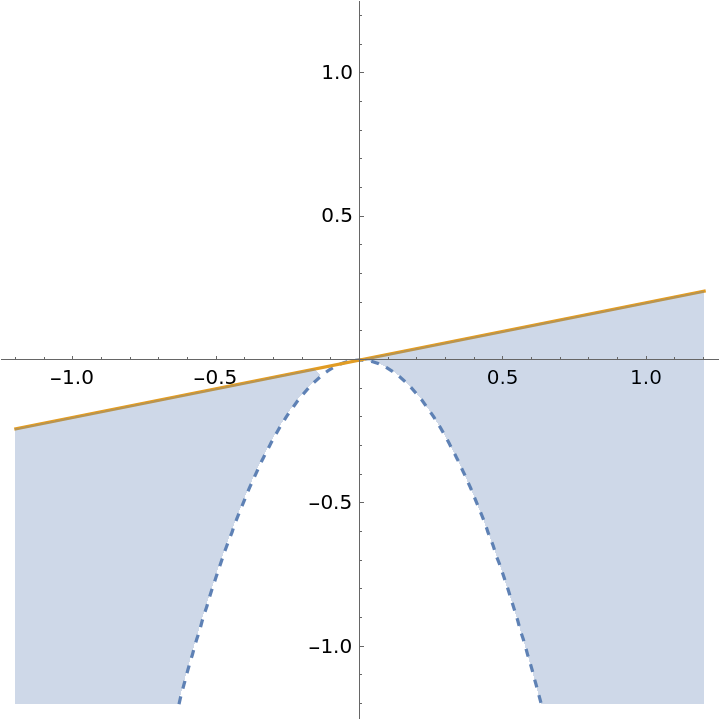 |
Regions generated by several lines:
| In[6]:= |
| Out[6]= | 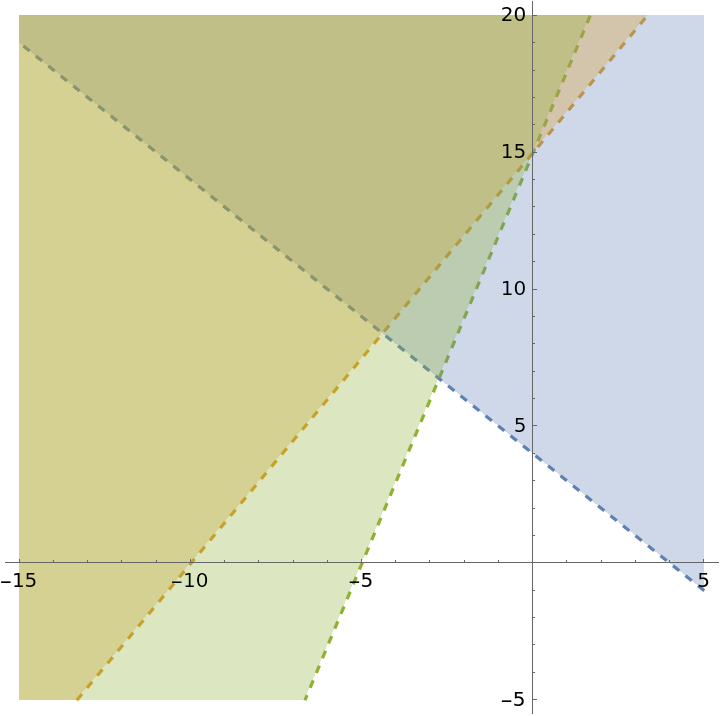 |
See many regions defined by two parabolas:
| In[7]:= | ![Manipulate[
ResourceFunction["InequalityPlot"][
Evaluate@op[y + 10 < (x - 2)^2, -y + 1 < x^2], {x, -10, 20}, {y, -20, 10}, MaxRecursion -> 5], {op, {And, Or, Xor, Implies, Nand, Nor}}]](https://www.wolframcloud.com/obj/resourcesystem/images/78d/78d17f09-3cae-42a2-9896-c065e7a5e311/776fc3aeb747778c.png) |
| Out[7]= | 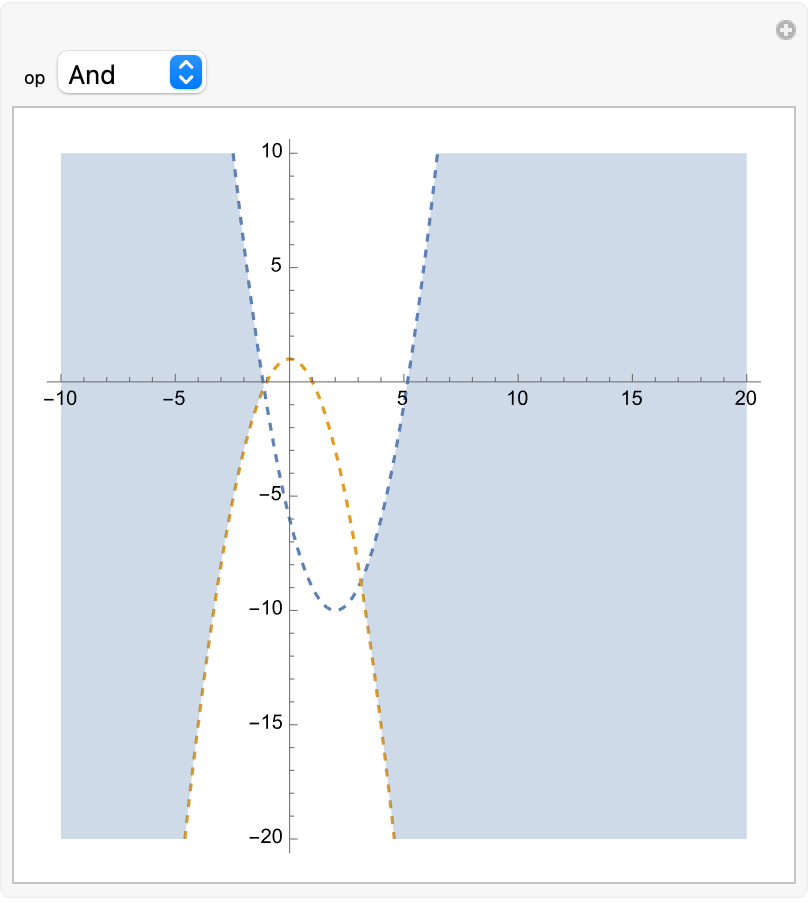 |
Higher degree region:
| In[8]:= | ![With[{a = 2, b = 1, c = 2, n = 3},
ResourceFunction[
"InequalityPlot"][{a x^(1 + 2 n) - c x^n y^n + b y^(1 + 2 n) < 0 && 3 x - 5 y >= -1}, {x, -.6, .7}, {y, -.8, .8}, MaxRecursion -> 5]]](https://www.wolframcloud.com/obj/resourcesystem/images/78d/78d17f09-3cae-42a2-9896-c065e7a5e311/6700b5831ae21933.png) |
| Out[8]= | 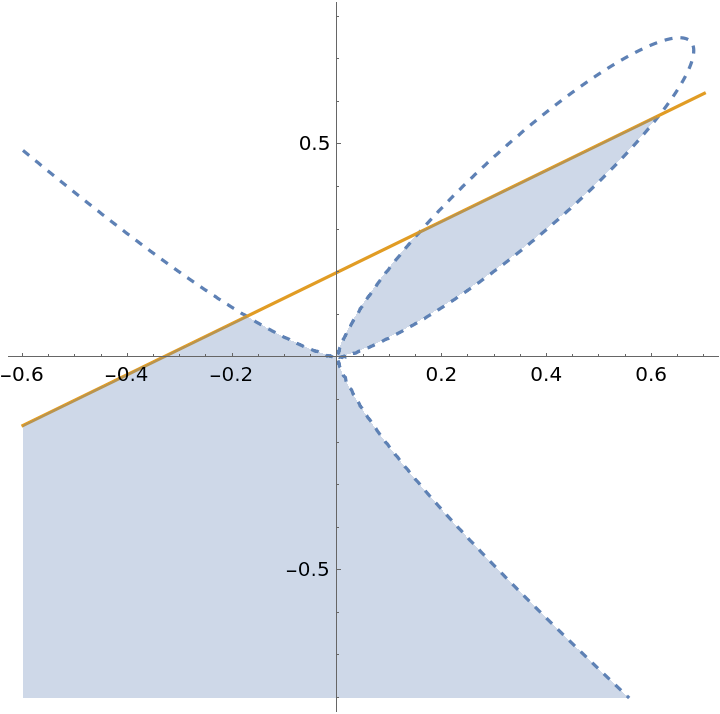 |
Limits to infinity:
| In[9]:= |
| Out[9]= | 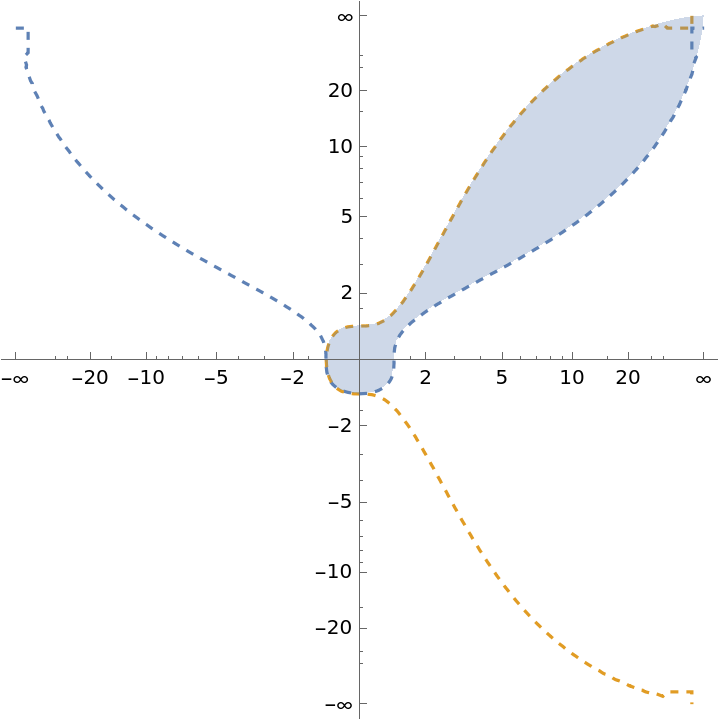 |
Specify the scaling with ScalingFunctions:
| In[10]:= |
| Out[10]= | 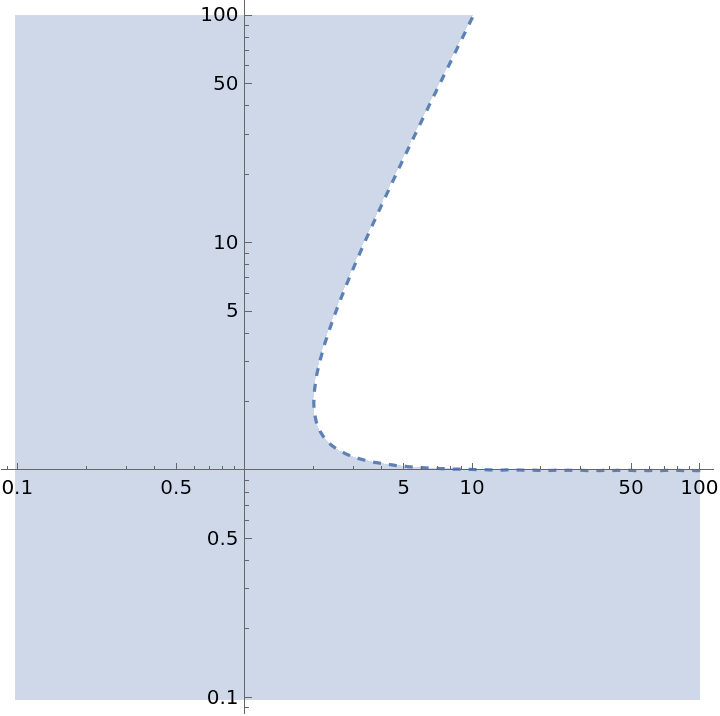 |
Visualize a 3D region:
| In[11]:= | ![ResourceFunction["InequalityPlot"][
2 x - 2 y < z && 6 x - 5 y < z && 3 x + 5 y < z, {x, -2, 2}, {y, -2, 2}, {z, -2, 2}, BoundaryStyle -> Dashed, PlotLegends -> True, Axes -> True, MeshStyle -> Dashed]](https://www.wolframcloud.com/obj/resourcesystem/images/78d/78d17f09-3cae-42a2-9896-c065e7a5e311/0b7b3cbcaab0d1b7.png) |
| Out[11]= | 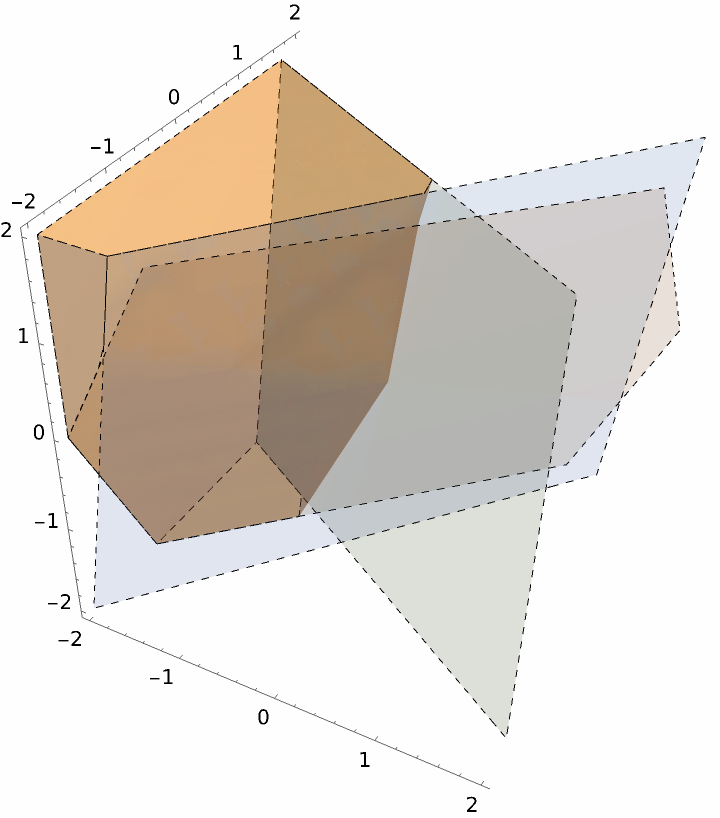 |
Without explicit intervals:
| In[12]:= | ![ResourceFunction["InequalityPlot"][
2 x - 2 y < z && 6 x - 5 y < z && 3 x + 5 y < z, {x, y, z}, BoundaryStyle -> Dashed, PlotLegends -> True, Axes -> True, MeshStyle -> Dashed]](https://www.wolframcloud.com/obj/resourcesystem/images/78d/78d17f09-3cae-42a2-9896-c065e7a5e311/7621cf2965659dd0.png) |
| Out[12]= | 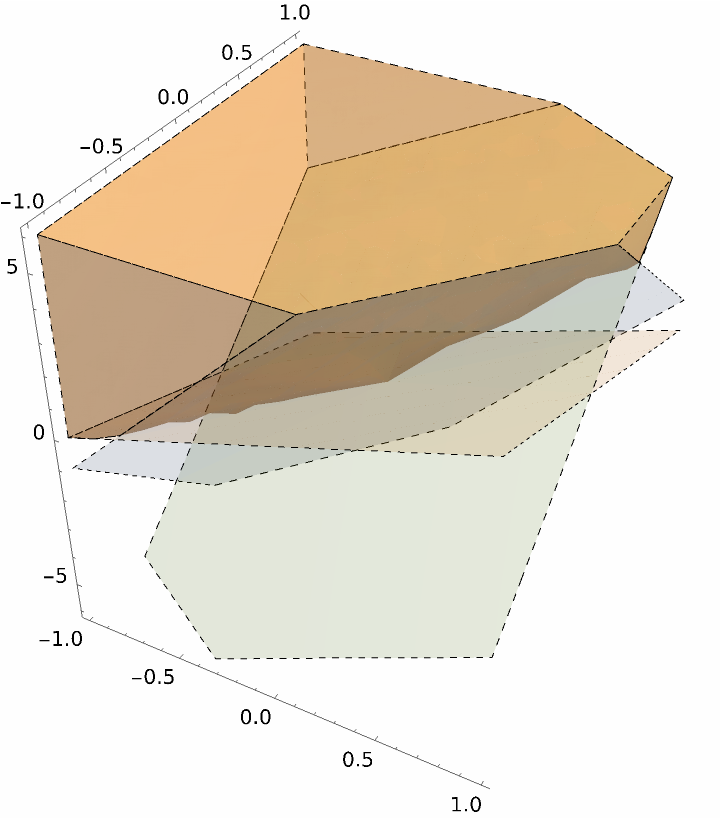 |
Three intersecting cylinders:
| In[13]:= | ![ResourceFunction["InequalityPlot"][
x^2 + y^2 <= 1 && x^2 + z^2 <= 1 && y^2 + z^2 <= 1, {x, -1, 1}, {y, -1, 1}, {z, -1, 1}, PlotStyle -> Yellow, Mesh -> 5, PlotPoints -> 50]](https://www.wolframcloud.com/obj/resourcesystem/images/78d/78d17f09-3cae-42a2-9896-c065e7a5e311/7d387cdb36685154.png) |
| Out[13]= | 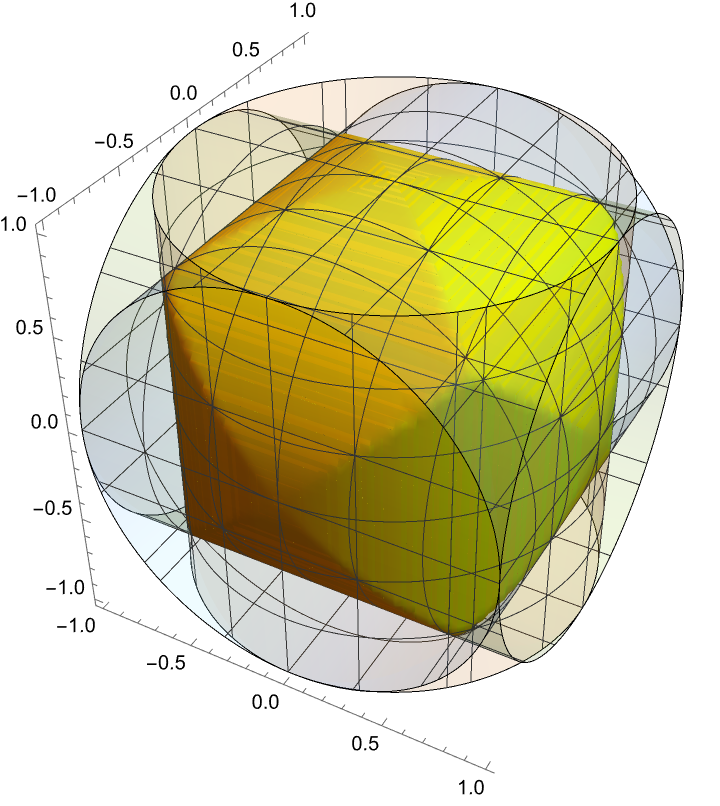 |
Region defined by planes:
| In[14]:= | ![ResourceFunction[
"InequalityPlot"][-.5 < x <= .5 && -.5 < y < .5 && -.5 < z < .5, {x, y, z}, ContourStyle -> Table[{Directive[ColorData[10, "ColorList"][[i]], Opacity[.5]]}, {i,
6}], Lighting -> "Neutral", PlotLegends -> True]](https://www.wolframcloud.com/obj/resourcesystem/images/78d/78d17f09-3cae-42a2-9896-c065e7a5e311/63d62d4d71fdf0df.png) |
| Out[14]= | 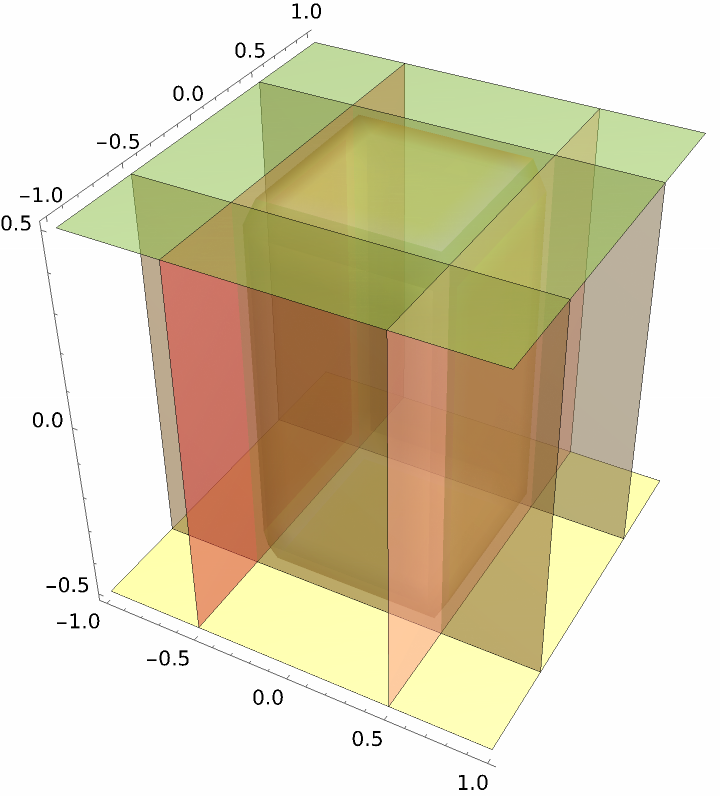 |
Region defined by two paraboloids:
| In[15]:= | ![ResourceFunction["InequalityPlot"][ x^2 + y^2 - z < 1 && x^2 + y^2 + z > 1, {x, -3, 3}, {y, -3, 3}, {z, -2, 2}, PlotPoints -> 50, MaxRecursion -> 5]](https://www.wolframcloud.com/obj/resourcesystem/images/78d/78d17f09-3cae-42a2-9896-c065e7a5e311/5740c634b5297ff2.png) |
| Out[15]= | 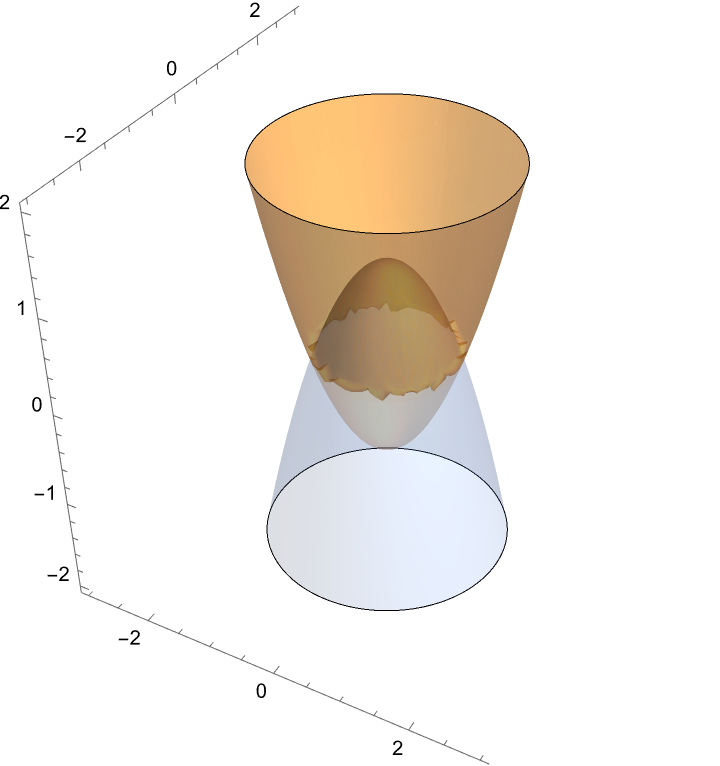 |
Higher order region:
| In[16]:= |
| Out[16]= | 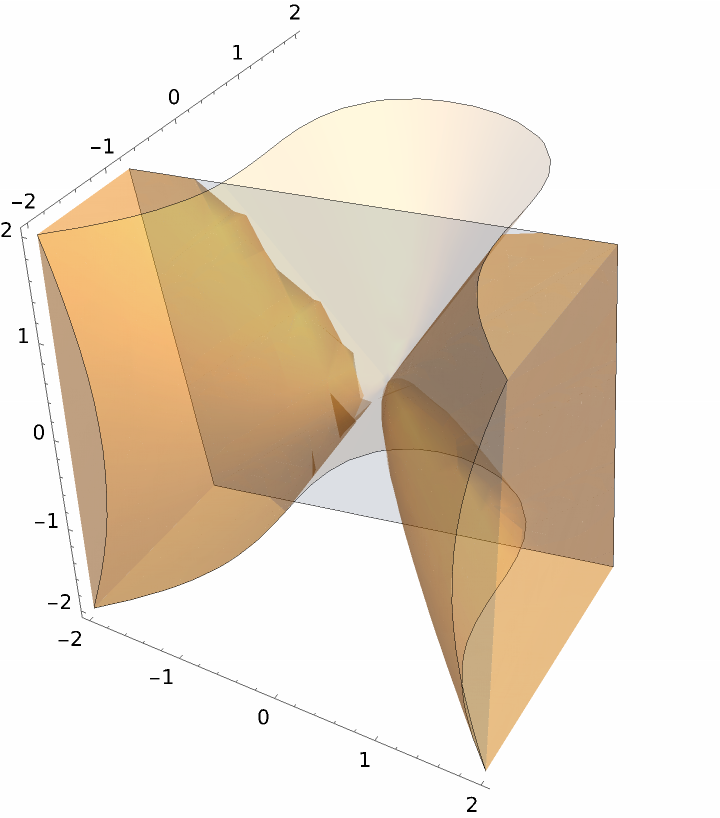 |
Random 3D region:
| In[17]:= | ![ResourceFunction["InequalityPlot"][
Table[(x - RandomReal[{-1, 1}])^2 + (y - RandomReal[{-1, 1}])^2 + (z - RandomReal[{-1, 1}])^2 <= 1, {3}],
{x, -2, 2}, {y, -2, 2}, {z, -2, 2}]](https://www.wolframcloud.com/obj/resourcesystem/images/78d/78d17f09-3cae-42a2-9896-c065e7a5e311/081d8814b5008ae1.png) |
| Out[17]= | 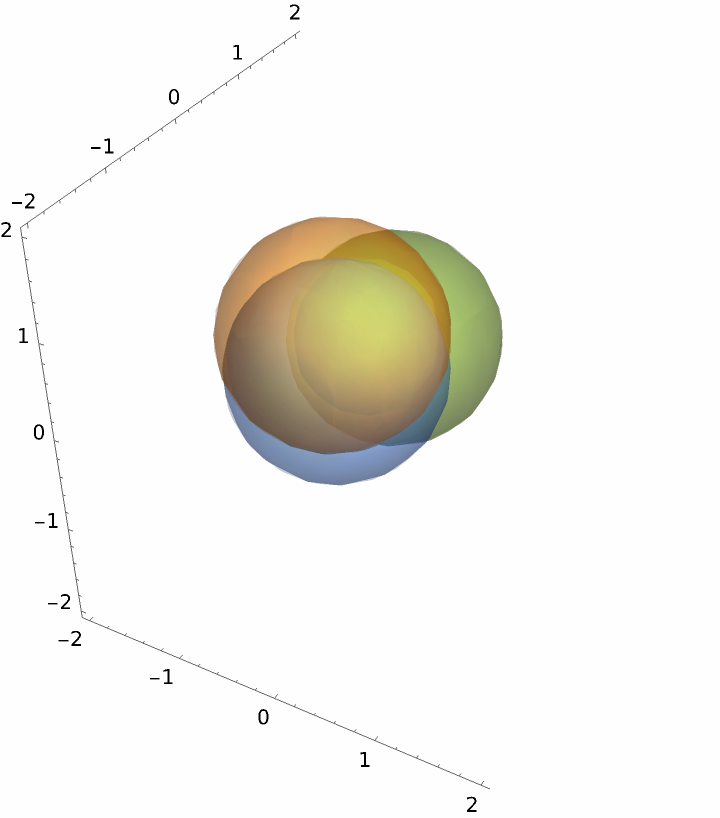 |
Do not show legends:
| In[18]:= |
| Out[18]= | 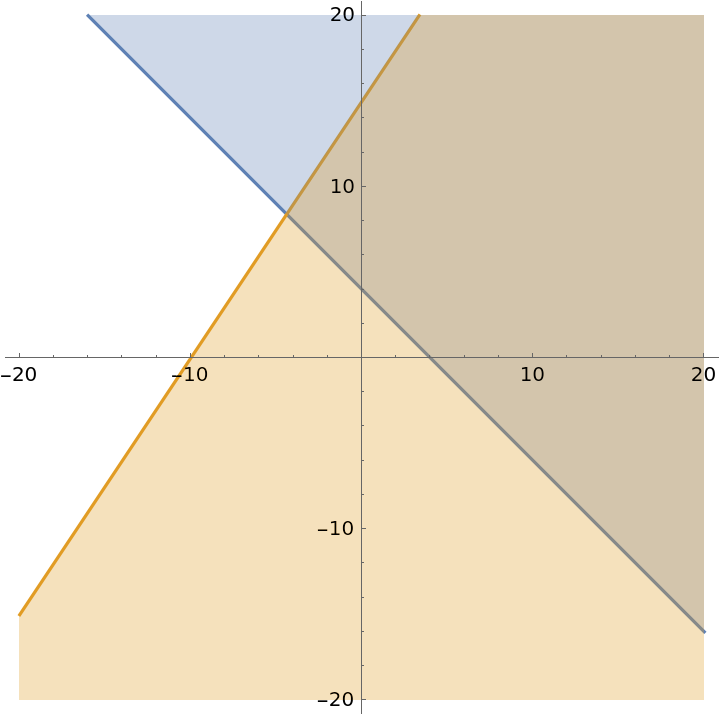 |
Do not show tooltips:
| In[19]:= |
| Out[19]= |  |
A Venn diagram:
| In[20]:= | ![setineqs = With[{ineqs = {(0.25 + x)^2 + (0.25 + y)^2 <= 1, (-0.25 + x)^2 + (0.25 + y)^2 <= 1, x^2 + (-0.25 + y)^2 <= 1}}, MapAt[Not, And @@@ Table[{ineqs[[1]], ineqs[[2]], ineqs[[3]]}, {8}], Position[Sort[Tuples[{y, n}, 3], Count[#, y] > Count[#2, y] &], y]]];](https://www.wolframcloud.com/obj/resourcesystem/images/78d/78d17f09-3cae-42a2-9896-c065e7a5e311/0010992d11a9f08d.png) |
| In[21]:= | ![labels = Text @@@ MapThread[
List, {StringJoin @@@ Rest@Subsets[{"A", "B", "C"}], RegionCentroid@Region[ImplicitRegion[#, {x, y}]] & /@ Rest@setineqs}];](https://www.wolframcloud.com/obj/resourcesystem/images/78d/78d17f09-3cae-42a2-9896-c065e7a5e311/766d46dc70a7cd28.png) |
| In[22]:= |
| Out[22]= | 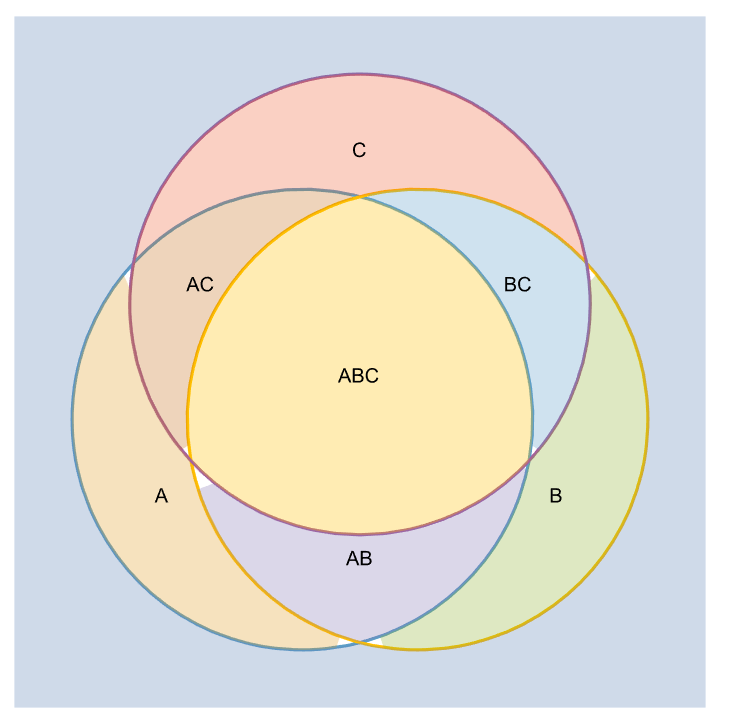 |
Define inequalities for overlapping disks which create random subregions:
| In[23]:= |
| In[24]:= |
| In[25]:= | ![labels = Text @@@ DeleteCases[
MapThread[
List, {StringJoin @@@ Rest@Subsets[{"A", "B", "C", "D"}], With[{rc = RegionCentroid@Region[ImplicitRegion[#, {x, y}]]},
If[MatchQ[rc, {__?NumericQ}], rc, {}]] & /@ Rest@setineqs}], {_, {}}];](https://www.wolframcloud.com/obj/resourcesystem/images/78d/78d17f09-3cae-42a2-9896-c065e7a5e311/46fe07f15cd629dc.png) |
Use "AllSubregions"→True to include distinct colors for each subregion in the plot:
| In[26]:= | ![Show[ResourceFunction["InequalityPlot"][
Evaluate@ineqs, {x, -1, 2}, {y, -1, 2}, "AllSubregions" -> True, "InequalityLegends" -> "Mouse", MaxRecursion -> 5, Axes -> False], Epilog -> labels, Axes -> False]](https://www.wolframcloud.com/obj/resourcesystem/images/78d/78d17f09-3cae-42a2-9896-c065e7a5e311/1c7a524277aff731.png) |
| Out[26]= | 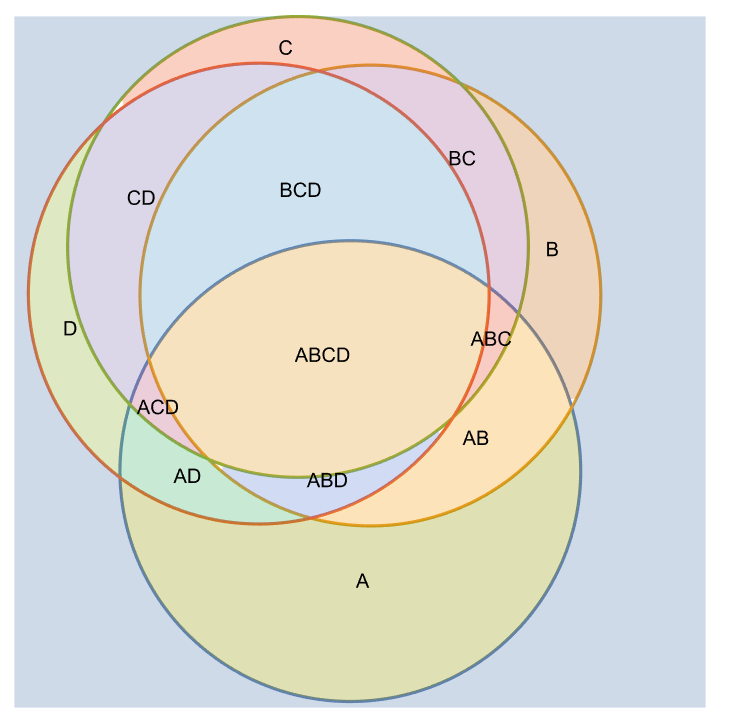 |
Random 3D region:
| In[27]:= | ![ResourceFunction["InequalityPlot"][
Table[(x - RandomReal[])^2 + (y - RandomReal[])^2 + (z - RandomReal[])^2 < 1, {3}],
{x, -1, 2}, {y, -1, 2}, {z, -1, 2}, "AllSubregions" -> True, PlotStyle -> (Directive[Opacity[.3], #] & /@ {White, Blue, Red, Yellow, Magenta, Green, Cyan, Orange}), MaxRecursion -> 5]](https://www.wolframcloud.com/obj/resourcesystem/images/78d/78d17f09-3cae-42a2-9896-c065e7a5e311/6912b72a1f8f7bba.png) |
| Out[27]= | 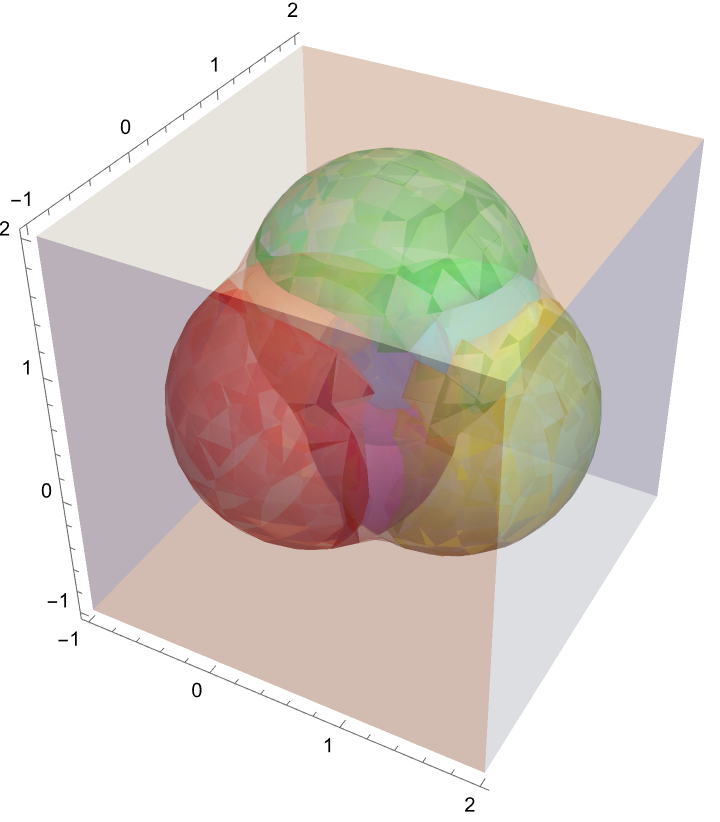 |
Specify the contour styles:
| In[28]:= | ![ResourceFunction[
"InequalityPlot"][{-2 x - 2 y <= -8, 3 x - 2 y >= -30}, {x, -20, 20}, {y, -20, 20}, ContourStyle -> {Directive[Green, Thickness[0.02]], Directive[Magenta, Thickness[0.02]]}]](https://www.wolframcloud.com/obj/resourcesystem/images/78d/78d17f09-3cae-42a2-9896-c065e7a5e311/08ad2b133c2b1341.png) |
| Out[28]= | 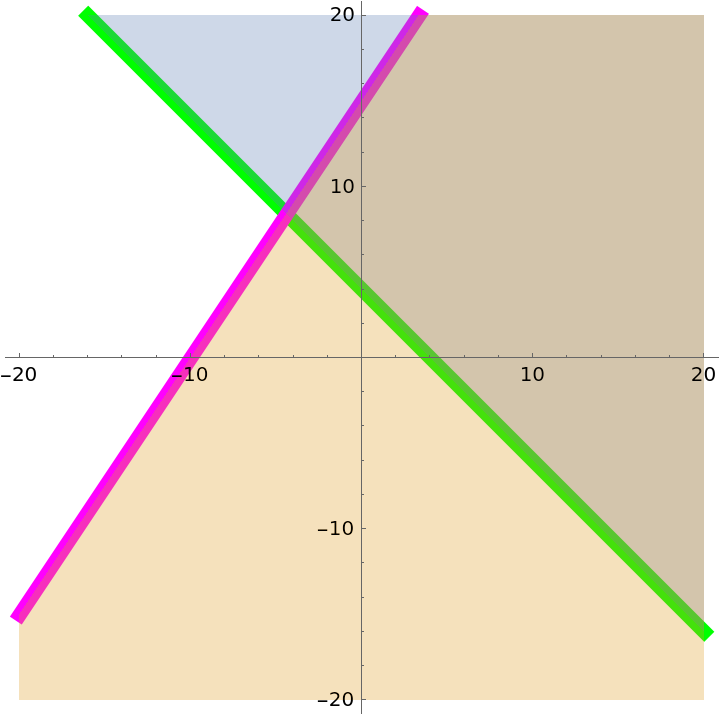 |
Change the styles for the mesh:
| In[29]:= | ![ResourceFunction[
"InequalityPlot"][{-2 x - 2 y < -8, 3 x - 2 y < -30}, {x, -15, 5}, {y, -5, 20}, Mesh -> 10, MeshShading -> {{Automatic, None}, {None, Automatic}}]](https://www.wolframcloud.com/obj/resourcesystem/images/78d/78d17f09-3cae-42a2-9896-c065e7a5e311/6099b95d11620b79.png) |
| Out[29]= | 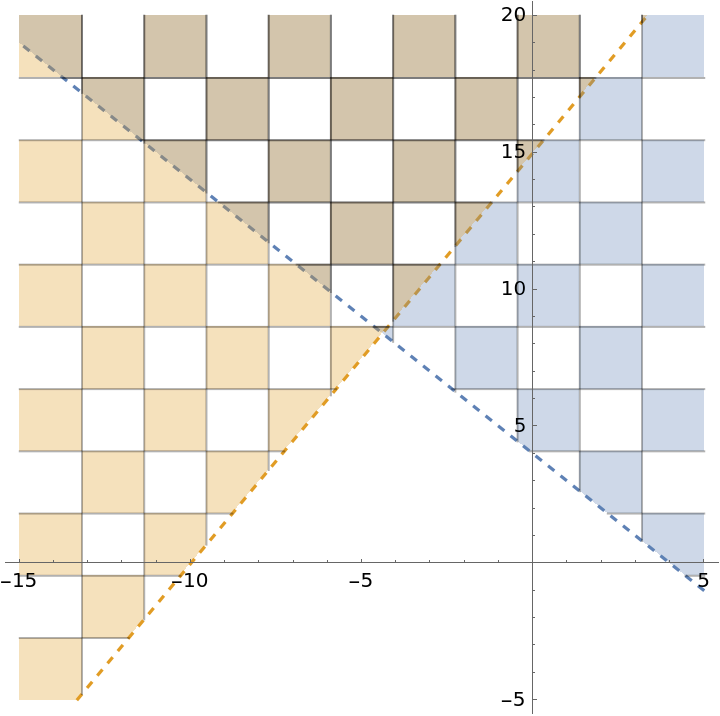 |
An inequality over a region:
| In[30]:= | ![ResourceFunction[
"InequalityPlot"][{-2 x - 2 y < -4 && (x + 5)^2 + (y - 5)^2 < 20, 3 x - 2 y < -30 && (x + 5)^2 + (y - 5)^2 < 20}, {x, -10, 0}, {y, 0, 10}, RegionFunction -> ((#1 + 5)^2 + (#2 - 5)^2 < 20 &)]](https://www.wolframcloud.com/obj/resourcesystem/images/78d/78d17f09-3cae-42a2-9896-c065e7a5e311/164a7bcc86d33ba7.png) |
| Out[30]= | 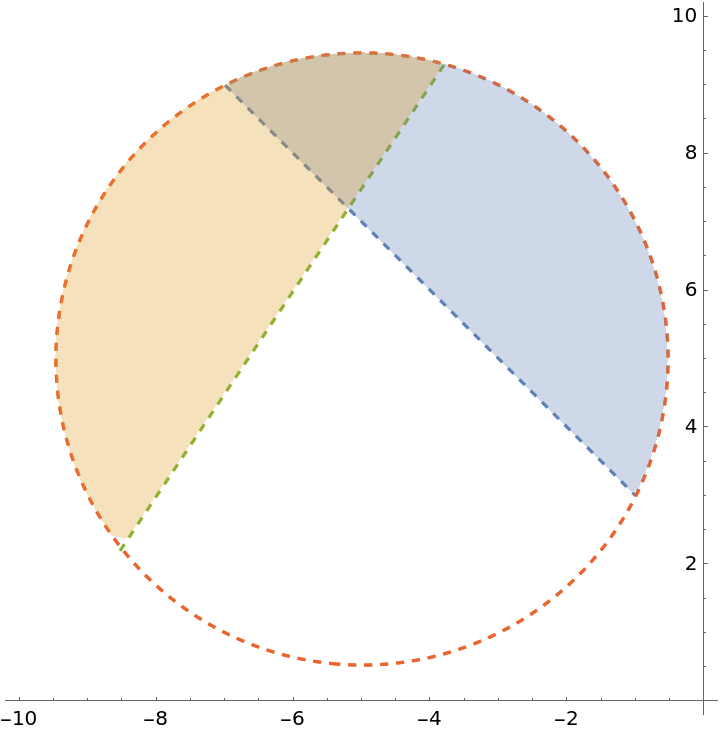 |
Modify the plot style:
| In[31]:= | ![ResourceFunction[
"InequalityPlot"][{-x^2 y^3 + (-1 + x^2 + y^2)^3 <= 0, -(x - 1)^2 y^3 + (-1 + (x - 1)^2 + y^2)^3 <= 0}, {x, -1.25, 2.25}, {y, -1.75, 1.75}, PlotStyle -> {{Opacity[.5], Blue}, {Opacity[.5], Red}}, Axes -> False, MaxRecursion -> 5]](https://www.wolframcloud.com/obj/resourcesystem/images/78d/78d17f09-3cae-42a2-9896-c065e7a5e311/67e5071ad25ef8ea.png) |
| Out[31]= |  |
A region between curves:
| In[32]:= |
| Out[32]= |  |
Compute the area using the resource function AreaBetweenCurves:
| In[33]:= |
| Out[33]= |
Control the region included (sometimes a particular intersection does not exist):
| In[34]:= |
| In[35]:= | ![Manipulate[
ResourceFunction["InequalityPlot"][
Evaluate[Not /@ And @@ MapAt[Not, ineqs, List /@ sets]],
{x, -2, 2}, {y, -2, 2}, Axes -> False, MaxRecursion -> 5, PlotLabel -> (Not /@ And @@ MapAt[Not, {"A", "B", "C", "D"}, List /@ sets])],
{sets, {1 -> "A", 2 -> "B" , 3 -> "C", 4 -> "D"}}, ControlType -> TogglerBar]](https://www.wolframcloud.com/obj/resourcesystem/images/78d/78d17f09-3cae-42a2-9896-c065e7a5e311/0cb7b61b81dfc2a6.png) |
| Out[35]= | 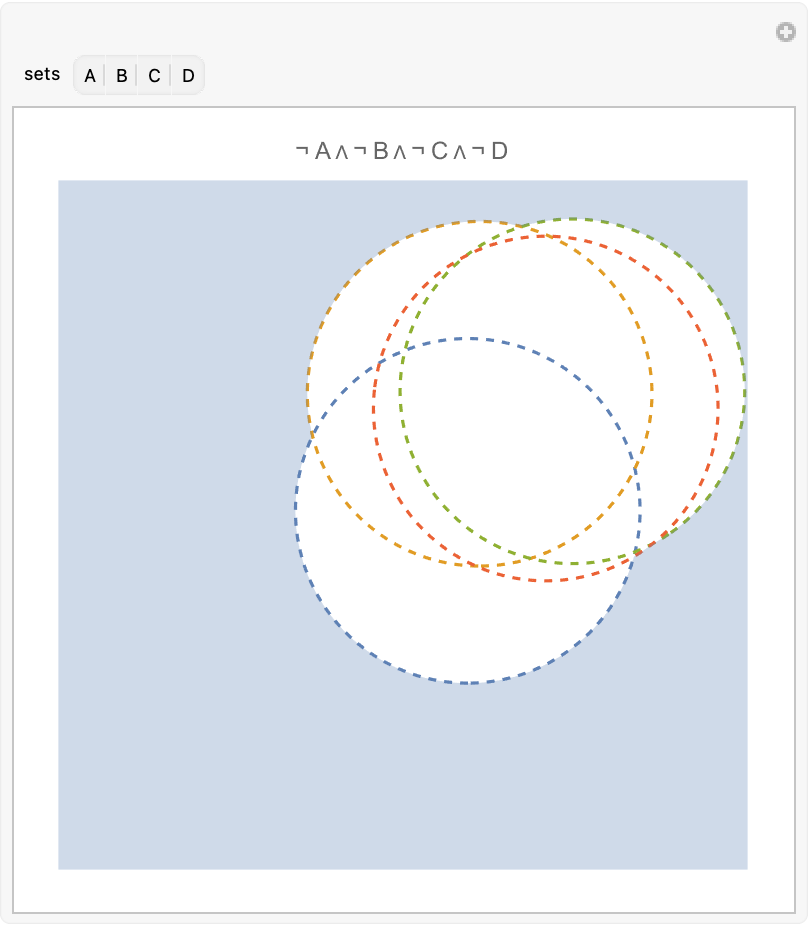 |
See all subsets in a grid:
| In[36]:= | ![ineqs2 = Table[(x - RandomReal[])^2 + (y - RandomReal[])^2 <= 1, {4}]; GraphicsGrid[
Partition[(ResourceFunction[
"InequalityPlot"][#1, {x, -1, 2}, {y, -1, 2}, MaxRecursion -> 5,
Axes -> False] &) /@ With[{subeq = Rest@Subsets[ineqs2]}, Join[{! Or @@ Last@subeq}, And @@@ Thread[{(! And @@ Complement[ineqs2, #1] &) /@ Most@subeq, And @@@ Most@subeq}], {And @@ Last@subeq}]], 4]]](https://www.wolframcloud.com/obj/resourcesystem/images/78d/78d17f09-3cae-42a2-9896-c065e7a5e311/6bb352537db309f6.png) |
| Out[36]= | 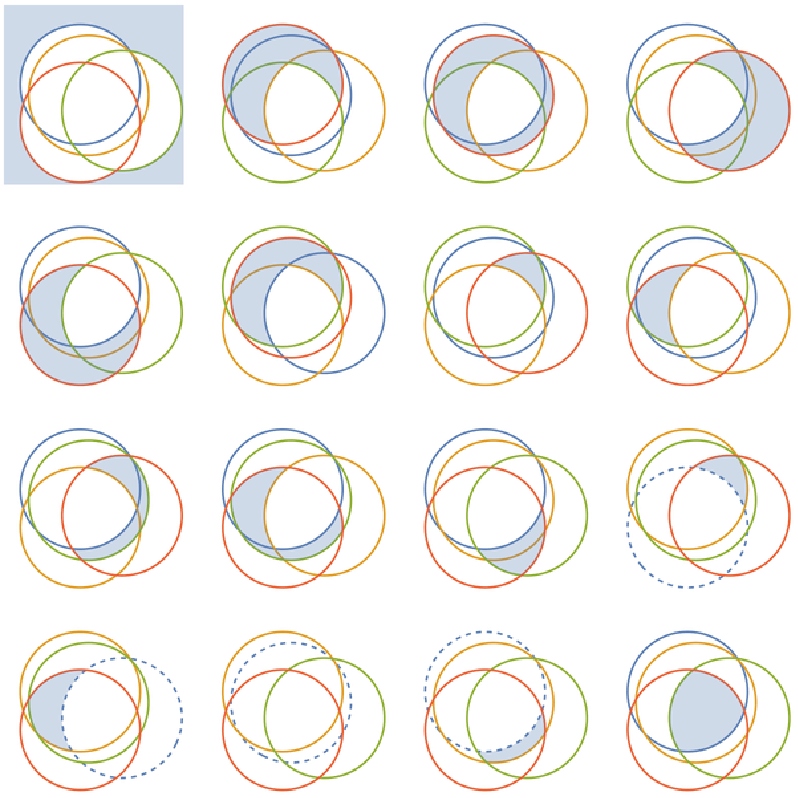 |
Wolfram Language 13.0 (December 2021) or above
This work is licensed under a Creative Commons Attribution 4.0 International License