Wolfram Function Repository
Instant-use add-on functions for the Wolfram Language
Function Repository Resource:
Get a variable range against which to plot a given function
ResourceFunction["SuggestPlotRange"][expr,x] tries to return a range in x that will produce a nice-looking plot of the expression expr versus x. |
| "Periods" | Automatic | how many periods of a periodic function to plot |
| "Range" | "Narrow" | whether to give a "Narrow" or "Wide" plot range |
Suggest a plot range for a trigonometric function:
| In[1]:= |
| Out[2]= |
| In[3]:= |
| Out[3]= | 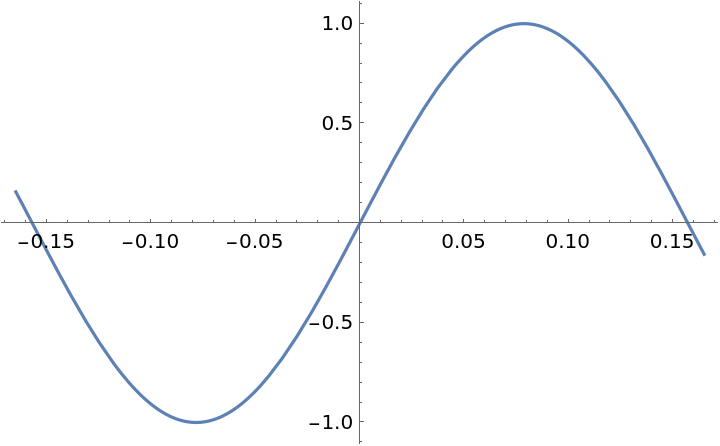 |
Suggest a plot range for a polynomial function:
| In[4]:= |
| Out[5]= |
| In[6]:= |
| Out[6]= | 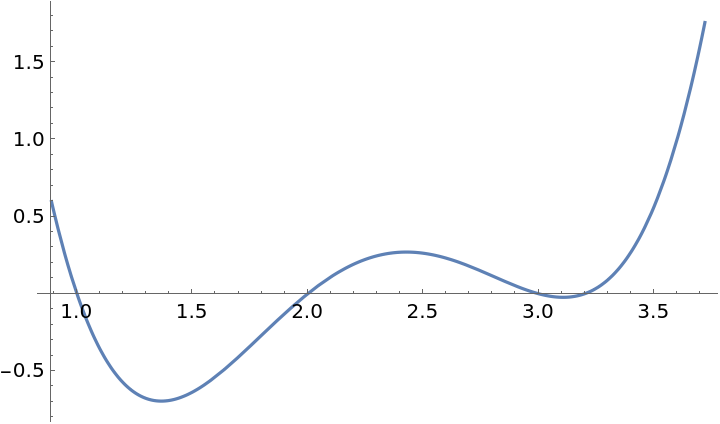 |
Suggest a plot range for a rational function:
| In[7]:= |
| Out[8]= |
| In[9]:= |
| Out[9]= | 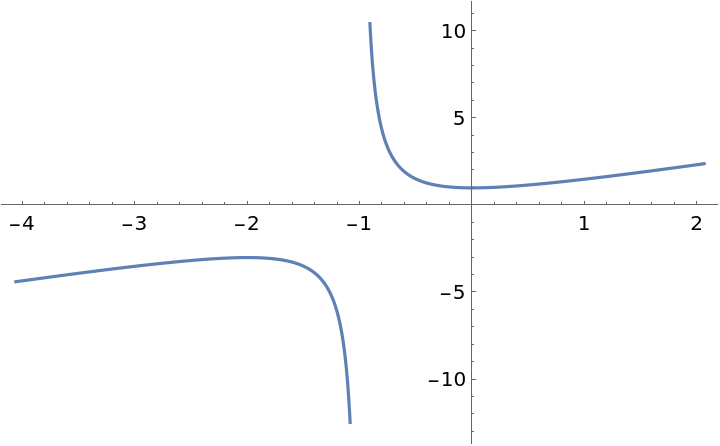 |
Suggest a plot range for a generic function:
| In[10]:= |
| Out[11]= |
| In[12]:= |
| Out[12]= | 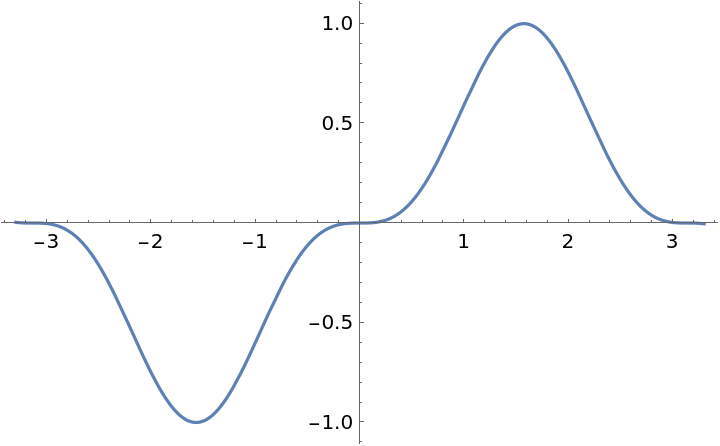 |
Suggest a plot range for another function:
| In[13]:= |
| Out[14]= |
| In[15]:= |
| Out[15]= | 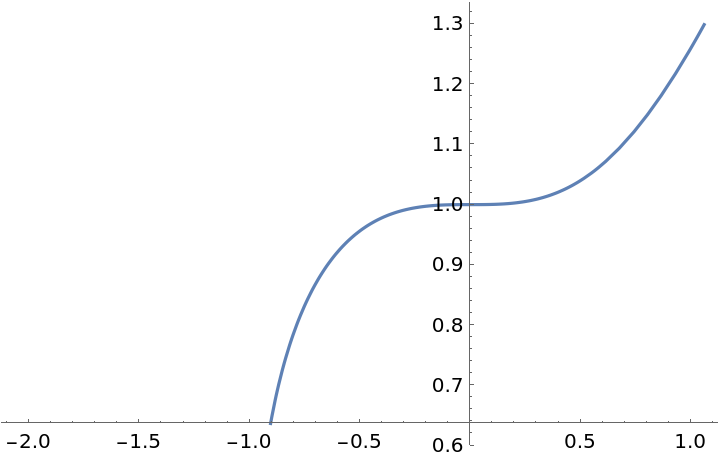 |
Using the option setting Range -> "Wide" will give a range showing more of the function but possibly revealing less detail:
| In[16]:= |
| Out[17]= |
| In[18]:= |
| Out[18]= | 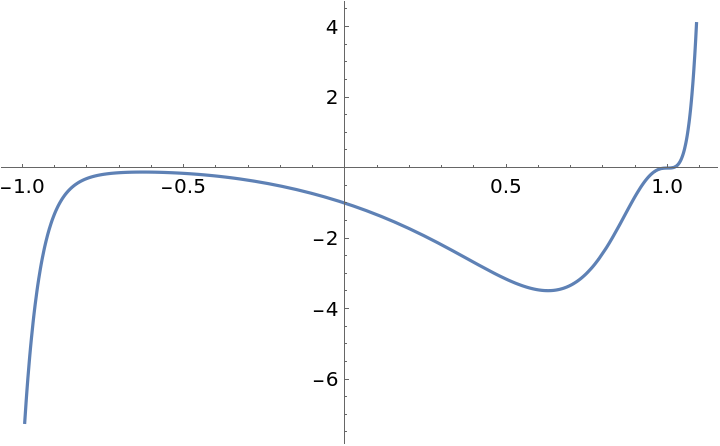 |
| In[19]:= |
| Out[19]= |
| In[20]:= |
| Out[20]= | 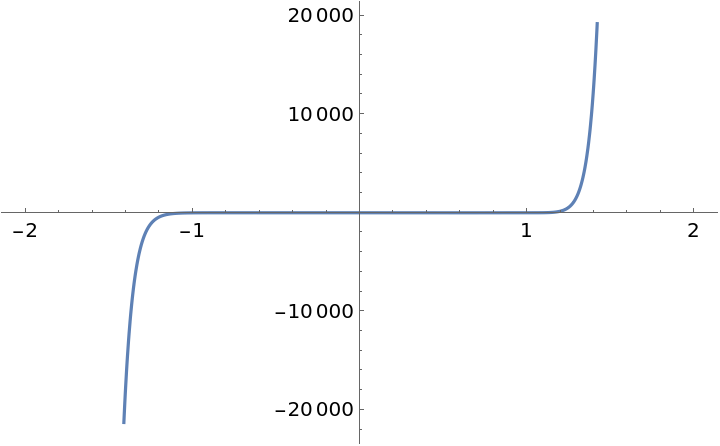 |
For periodic functions, the option setting "Periods"→n will return a range covering the specified number of periods:
| In[21]:= |
| Out[22]= |
| In[23]:= |
| Out[23]= | 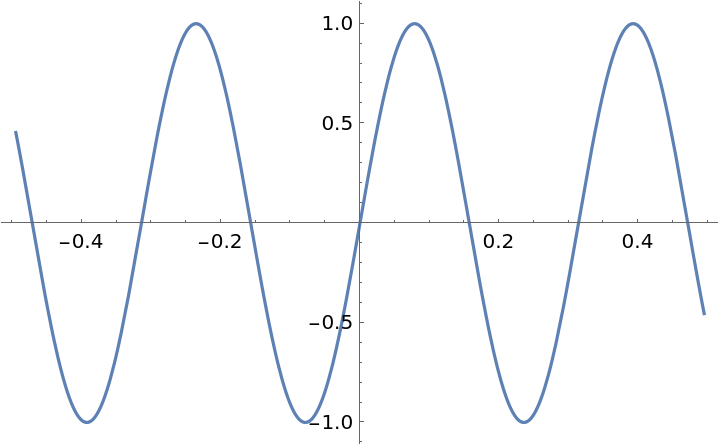 |
This work is licensed under a Creative Commons Attribution 4.0 International License