Wolfram Function Repository
Instant-use add-on functions for the Wolfram Language
Function Repository Resource:
Apply a flatter or steeper variation in the middle of an interval
ResourceFunction["GainRescale"][a,x] biases x to be flatter towards the middle if a<1/2, and steeper towards the middle if a>1/2, as x runs from 0 to 1. | |
ResourceFunction["GainRescale"][a,x,{min,max}] biases x as x runs from min to max. | |
ResourceFunction["GainRescale"][a,x,{min,max},{ymin,ymax}] biases x as x runs from min to max, with the result rescaled to run from ymin to ymax. |
Evaluate numerically:
| In[1]:= |
| Out[1]= |
Plot over a subset of the reals:
| In[2]:= |
| Out[2]= | 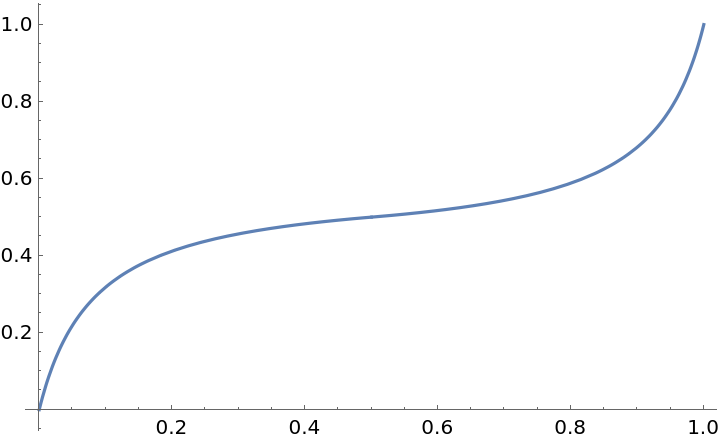 |
Plot different gain functions:
| In[3]:= | ![Plot[Evaluate@
Table[ResourceFunction["GainRescale"][a, x], {a, {1/8, 1/2, 7/8}}], {x, 0, 1}, PlotLegends -> {1/8, 1/2, 7/8}]](https://www.wolframcloud.com/obj/resourcesystem/images/59b/59b62ec9-eb2f-49b5-b574-9480ea603087/2a5bf6222312c18a.png) |
| Out[3]= | 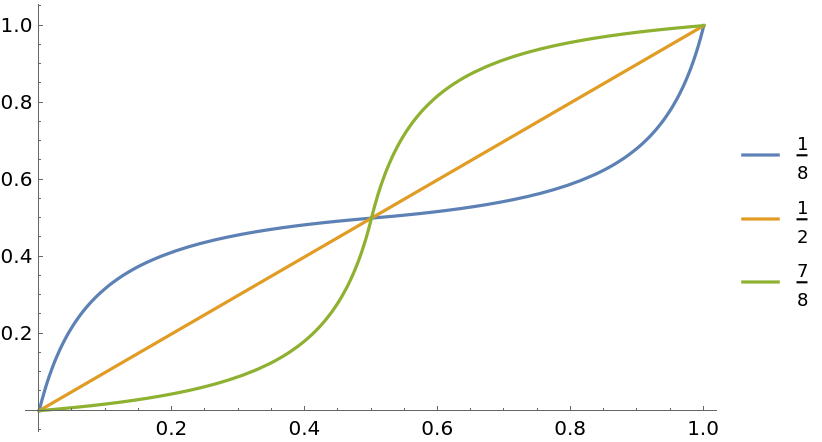 |
Evaluate for symbolic x:
| In[4]:= |
| Out[4]= |  |
GainRescale threads over lists in its first and second arguments:
| In[5]:= |
| Out[5]= |
| In[6]:= |
| Out[6]= |
Plot different gain functions with a rescaled domain:
| In[7]:= | ![Plot[Evaluate@
Table[ResourceFunction["GainRescale"][a, x, {-1, 2}], {a, {1/8, 1/2, 7/8}}], {x, -1, 2}, PlotLegends -> {1/8, 1/2, 7/8}]](https://www.wolframcloud.com/obj/resourcesystem/images/59b/59b62ec9-eb2f-49b5-b574-9480ea603087/598feb848b3c6e5d.png) |
| Out[7]= | 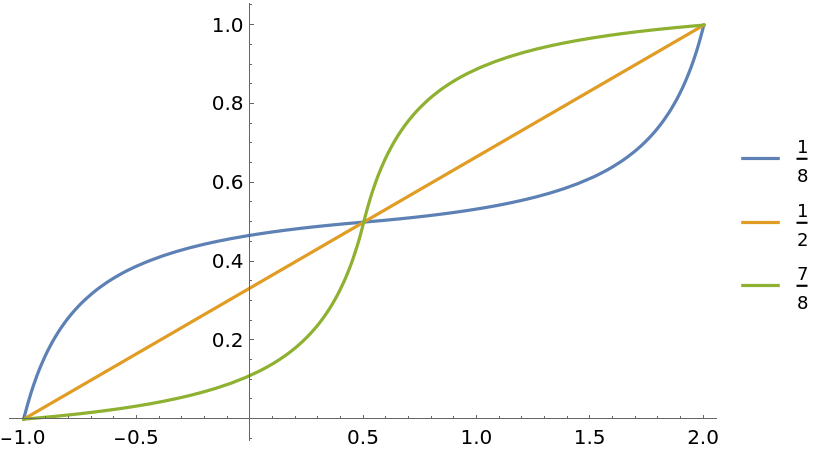 |
Plot different gain functions with a rescaled domain and range:
| In[8]:= | ![Plot[Evaluate@
Table[ResourceFunction["GainRescale"][a, x, {-1, 2}, {-1, 1}], {a, {1/8, 1/2, 7/8}}], {x, -1, 2}, PlotLegends -> {1/8, 1/2, 7/8}]](https://www.wolframcloud.com/obj/resourcesystem/images/59b/59b62ec9-eb2f-49b5-b574-9480ea603087/6dd3503307e8e603.png) |
| Out[8]= | 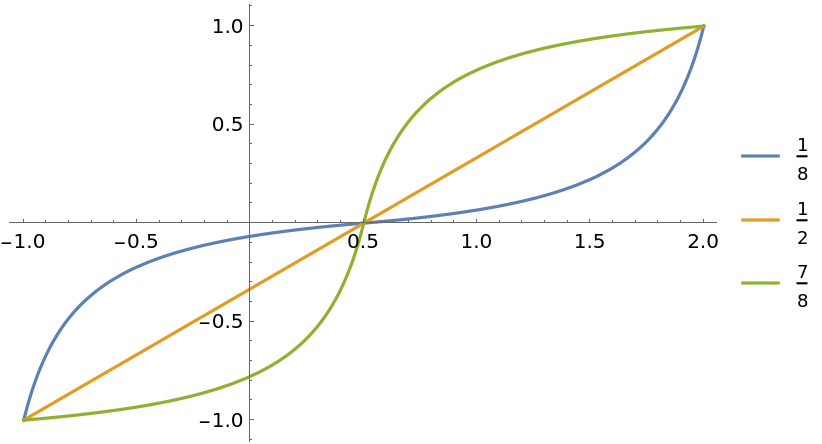 |
Compare the Schlick and Perlin gain functions:
| In[9]:= |
| Out[9]= |  |
| In[10]:= | ![Plot[{ResourceFunction["GainRescale"][3/4, x, Method -> "Schlick"], ResourceFunction["GainRescale"][3/4, x, Method -> "Perlin"]}, {x, 0,
1}, PlotLegends -> {"Schlick", "Perlin"}]](https://www.wolframcloud.com/obj/resourcesystem/images/59b/59b62ec9-eb2f-49b5-b574-9480ea603087/3ec8206e5bcf8e8c.png) |
| Out[10]= | 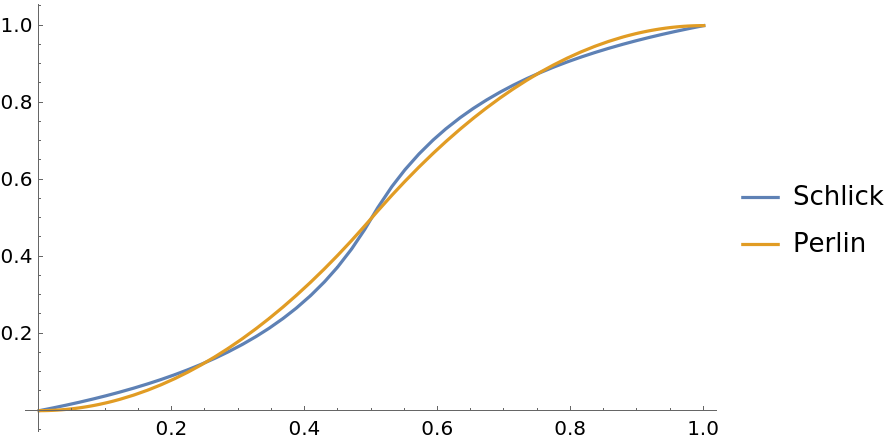 |
Adjust the middle color of a built-in color gradient:
| In[11]:= | ![Manipulate[
LinearGradientImage[
ColorData["ThermometerColors", ResourceFunction["GainRescale"][a, #]] &, {300, 30}], {{a, 1/2}, 0, 1}]](https://www.wolframcloud.com/obj/resourcesystem/images/59b/59b62ec9-eb2f-49b5-b574-9480ea603087/2a1ef0985cca6c0a.png) |
| Out[11]= | 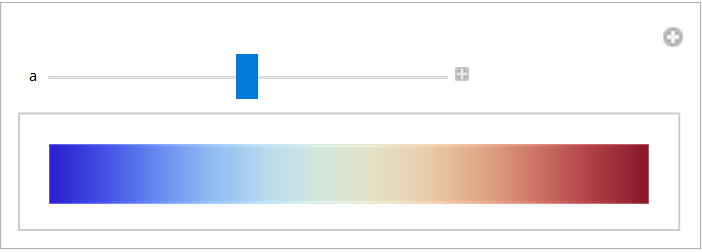 |
Demonstrate the effect of GainRescale on easing in/easing out:
| In[12]:= | ![Manipulate[
Graphics[Text[
"Zoom!", {ResourceFunction["GainRescale"][a, x, {-1, 2}], 0}], PlotRange -> {{-0.1, 1.1}, {-0.1, 0.1}}], {{a, 1/2}, 0, 1}, {x, -1, 2, ControlType -> Animator, AnimationRunning -> False}]](https://www.wolframcloud.com/obj/resourcesystem/images/59b/59b62ec9-eb2f-49b5-b574-9480ea603087/21dac21818fef9dd.png) |
| Out[12]= | 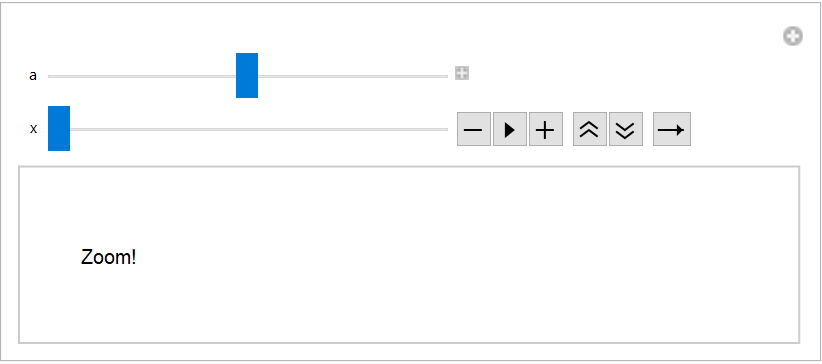 |
GainRescale[1/2,x,{min,max}] is equivalent to Rescale[x,{min,max}]:
| In[13]:= |
| Out[13]= |
GainRescale[a,x] is a symmetrized version of the resource function BiasedRescale, made symmetric about x=1/2:
| In[14]:= | ![With[{a = 1/4},
Plot[{ResourceFunction["GainRescale"][a, x], 1/2 \!\(\*
TagBox[GridBox[{
{"\[Piecewise]", GridBox[{
{
RowBox[{
RowBox[{"ResourceFunction", "[", "\"\<BiasedRescale\>\"", "]"}], "[", RowBox[{
RowBox[{"1", "-", "a"}], ",",
RowBox[{"2", "x"}]}], "]"}],
RowBox[{"x", "<",
RowBox[{"1", "/", "2"}]}]},
{
RowBox[{"1", "+",
RowBox[{
RowBox[{"ResourceFunction", "[", "\"\<BiasedRescale\>\"", "]"}], "[", RowBox[{"a", ",",
RowBox[{
RowBox[{"2", "x"}], "-", "1"}]}], "]"}]}],
RowBox[{"x", ">",
RowBox[{"1", "/", "2"}]}]}
},
AllowedDimensions->{2, Automatic},
Editable->True,
GridBoxAlignment->{"Columns" -> {{Left}}, "ColumnsIndexed" -> {}, "Rows" -> {{Baseline}}, "RowsIndexed" -> {}},
GridBoxItemSize->{"Columns" -> {{Automatic}}, "ColumnsIndexed" -> {}, "Rows" -> {{1.}}, "RowsIndexed" -> {}},
GridBoxSpacings->{"Columns" -> {
Offset[
0.27999999999999997`], {
Offset[0.84]},
Offset[0.27999999999999997`]}, "ColumnsIndexed" -> {}, "Rows" -> {
Offset[0.2], {
Offset[0.4]},
Offset[0.2]}, "RowsIndexed" -> {}},
Selectable->True]}
},
GridBoxAlignment->{"Columns" -> {{Left}}, "ColumnsIndexed" -> {}, "Rows" -> {{Baseline}}, "RowsIndexed" -> {}},
GridBoxItemSize->{"Columns" -> {{Automatic}}, "ColumnsIndexed" -> {}, "Rows" -> {{1.}}, "RowsIndexed" -> {}},
GridBoxSpacings->{"Columns" -> {
Offset[
0.27999999999999997`], {
Offset[0.35]},
Offset[0.27999999999999997`]}, "ColumnsIndexed" -> {}, "Rows" -> {
Offset[0.2], {
Offset[0.4]},
Offset[0.2]}, "RowsIndexed" -> {}}],
"Piecewise",
DeleteWithContents->True,
Editable->False,
SelectWithContents->True,
Selectable->False,
StripWrapperBoxes->True]\)}, {x, 0, 1}, PlotStyle -> {Thick, Directive[Thick, Dashed]}]]](https://www.wolframcloud.com/obj/resourcesystem/images/59b/59b62ec9-eb2f-49b5-b574-9480ea603087/3626d835506313cb.png) |
| Out[14]= | 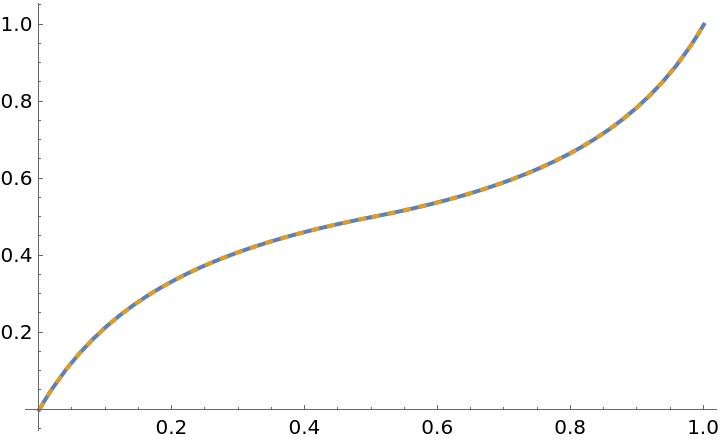 |
GainRescale is left unevaluated if the first argument is nonnumeric:
| In[15]:= |
| Out[15]= |
GainRescale is left unevaluated if the first argument is not a real number between 0 and 1:
| In[16]:= |
| Out[16]= |
This work is licensed under a Creative Commons Attribution 4.0 International License