Examples
Basic Examples (4)
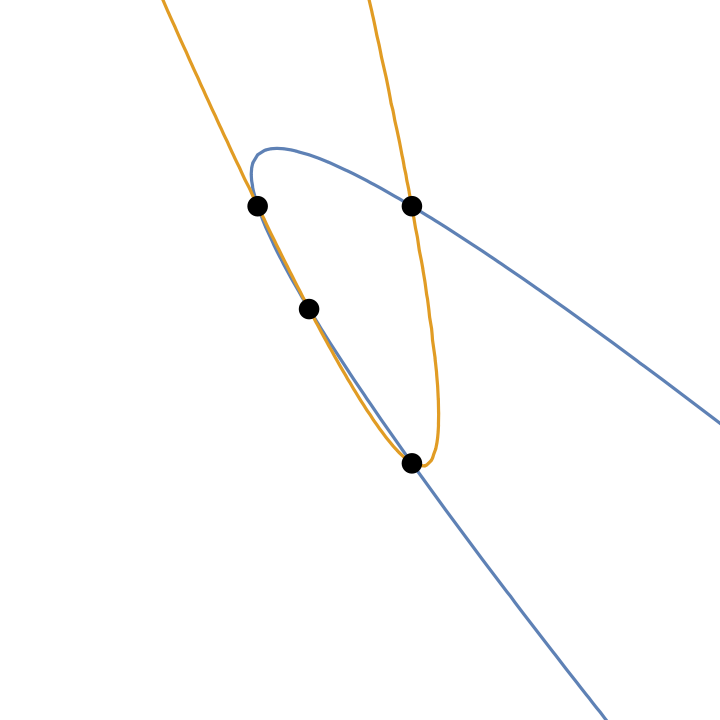
Find parabolas through four points:
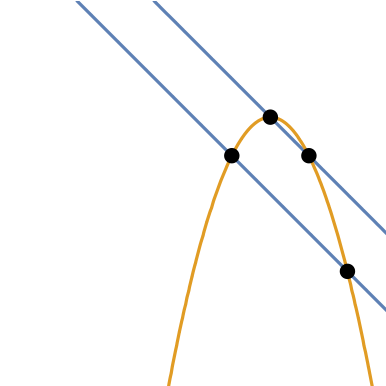
Plot the parabolas:
Find parabolas through four points:
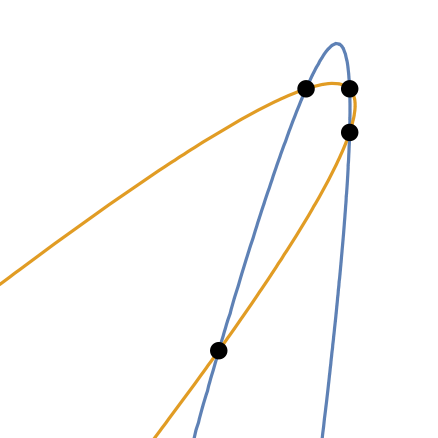
Plot the parabolas:
Recover the points by setting the equations equal to each other and zero:
Find parabolas through four points:
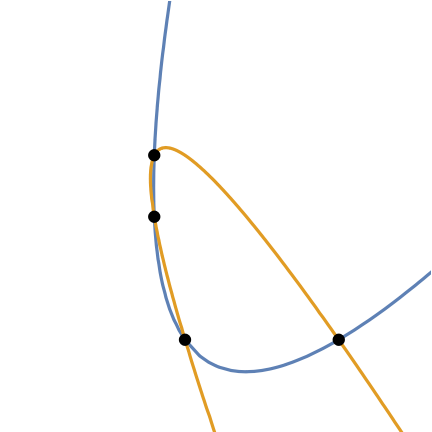
Plot the parabolas:
Find parabolas through four points:
Plot the parabolas:
Possible Issues (2)
Some point sets do not return real-valued parabolas:
When sets of points define parallel lines the parabolas are degenerate:
Neat Examples (2)
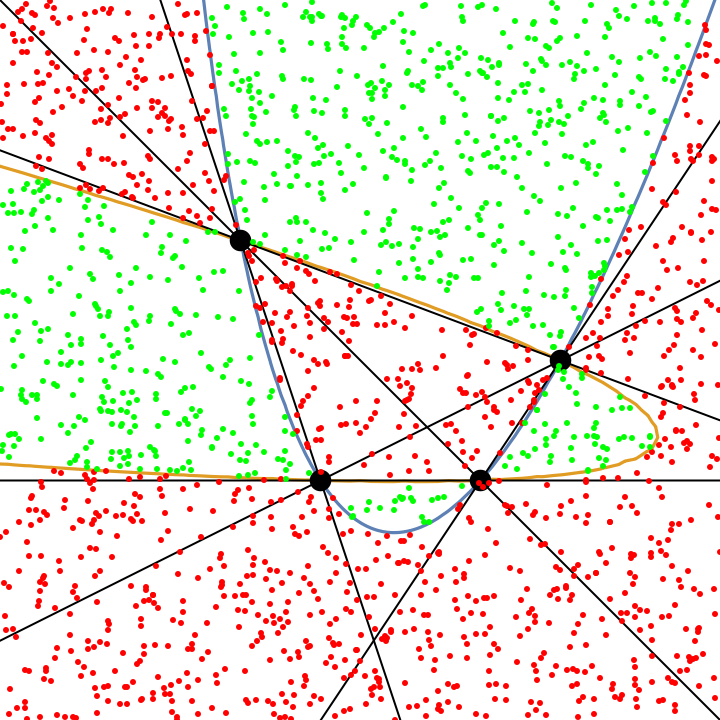
For random, uniformly-distributed points in a rectangle, the probability of a hyperbola is  and the probability of an ellipse is
  . This distribution can be seen by drawing the parabolas:
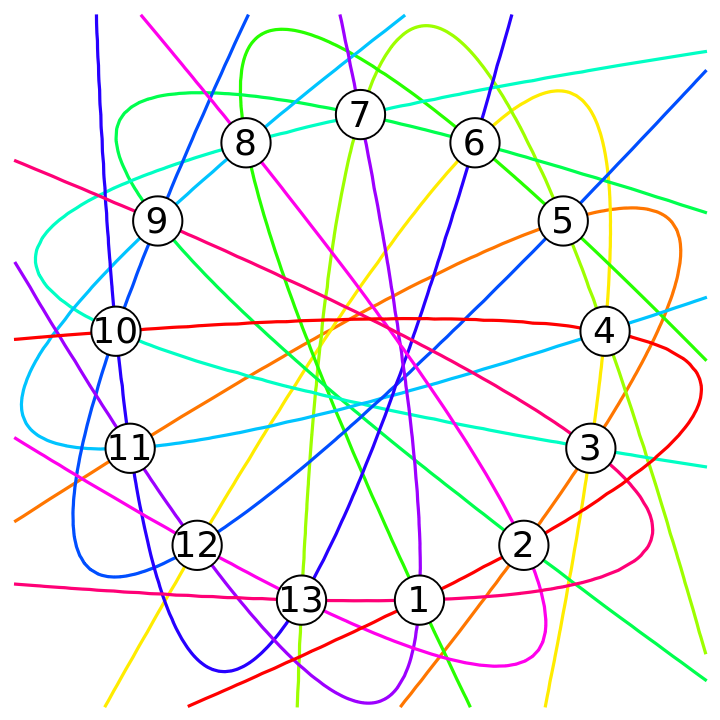
Find the parabolas through a particular set of points on the regular 13-gon:
Show the order four projective plane with parabolas:
Any pair of points defines exactly one parabola.
Any pair of parabolas (and the unit circle) defines exactly one point.
Version History
-
1.1.0
– 09 December 2022
-
1.0.0
– 02 December 2022
Related Resources
![]() and the probability of an ellipse is
and the probability of an ellipse is ![]() . This distribution can be seen by drawing the parabolas:
. This distribution can be seen by drawing the parabolas:![ellipseQ[pts_] := Module[{coeff},
coeff = CoefficientList[
ResourceFunction["FivePointConic"][
pts], {\[FormalX], \[FormalY]}]; coeff[[2, 2]]^2 - 4 coeff[[3, 1]] coeff[[1, 3]] < 0];
set2 = {{4/9, 1/3}, {2/3, 1/3}, {1/3, 2/3}, {7/9, 1/2}};
para2 = ResourceFunction["FourPointParabolas"][set2];
hypell = Last[Transpose[#]] & /@ SplitBy[Sort[{ellipseQ[Append[set2, #]], #} & /@ RandomReal[{0, 1}, {2000, 2}]], First];
Graphics[{ContourPlot[{para2[[1]] == 0, para2[[2]] == 0}, {\[FormalX], -1, 2}, {\[FormalY], -1, 2}, PlotPoints -> 50][[1]], Disk[#, .015] & /@ set2,
InfiniteLine[#] & /@ Subsets[set2, {2}], Red, Point[hypell[[1]]], Green, Point[hypell[[2]]]}, PlotRange -> {{0, 1}, {0, 1}}]](https://www.wolframcloud.com/obj/resourcesystem/images/06c/06c7468a-6f14-4710-8954-dc821422cf95/1-0-0/3ed51305328fd5e2.png)
![p13 = N[CirclePoints[
13]]; mm = {{-0.31111179783473814` - 0.6283050334156893 \[FormalX] + 1.4122762030016345` \[FormalY] + ((-0.8859226936434222) \[FormalX] + \[FormalY])^2, -1.8777222219403336` + 0.8005323479957306 \[FormalX] - 1.7994011263306269` \[FormalY] + (
1.1287666600879431` \[FormalX] + \[FormalY])^2}, {-1.3861911735742154` - 5.403106601005478 \[FormalX] + 4.270788691082614 \[FormalY] + ((-2.6367832955817603`) \[FormalX] + \[FormalY])^2, -0.9444539134765446 + 0.7771317608770479 \[FormalX] - 0.6142698600870061 \[FormalY] + (
0.3792499754058733 \[FormalX] + \[FormalY])^2}, {-11.997040084900206` - 58.583072244630486` \[FormalX] + 10.997040084900206` \[FormalY] + (
8.23574095449849 \[FormalX] + \[FormalY])^2, -0.8378673608045032 + 0.8637076924220911 \[FormalX] - 0.16213263919549686` \[FormalY] + ((-0.12142198322226049`) \[FormalX] + \[FormalY])^2}, {-0.5401531157193289 - 2.5656090340553583` \[FormalX] - 0.78735555219493 \[FormalY] + (
1.448750112780972 \[FormalX] + \[FormalY])^2, -1.2190918803426274` + 1.22237233024751 \[FormalX] + 0.375131841326789 \[FormalY] + ((-0.6902501619692256) \[FormalX] + \[FormalY])^2}, {-0.22232001698956125` - 0.7844155728192462 \[FormalX] - 0.7776799830104387 \[FormalY] + (
0.5248404873646182 \[FormalX] + \[FormalY])^2, -3.8232300011829414` + 2.8476823718743858` \[FormalX] + 2.8232300011829414` \[FormalY] + ((-1.9053408113030694`) \[FormalX] + \[FormalY])^2}, {-0.17430609056700133` - 0.26120790172820385` \[FormalX] - 0.8256939094329987 \[FormalY] + ((-1.0195403255745119`*^-17) \[FormalX] + \[FormalY])^2, -3.1100114586113416`*^34 + 9.838507444149416*^33 \[FormalX] + 3.1100114586113416`*^34 \[FormalY] + (
1.9407583082237312`*^17 \[FormalX] + \[FormalY])^2}, {-0.22232001698956128` + 0.1944192451405043 \[FormalX] - 1.0873339431726845` \[FormalY] + ((-0.5248404873646182) \[FormalX] + \[FormalY])^2, -3.8232300011829428` - 0.7058047753308895 \[FormalX] + 3.9473740828281882` \[FormalY] + (
1.9053408113030699` \[FormalX] + \[FormalY])^2}, {-0.5401531157193288 + 1.645967731787313 \[FormalX] - 2.119685992573801 \[FormalY] + ((-1.448750112780972) \[FormalX] + \[FormalY])^2, -1.2190918803426276` - 0.7842135668803749 \[FormalX] + 1.0099143991708972` \[FormalY] + (
0.6902501619692256 \[FormalX] + \[FormalY])^2}, {-11.997040084900199` + 54.24899068248843 \[FormalX] - 24.697332936569882` \[FormalY] + ((-8.235740954498489) \[FormalX] + \[FormalY])^2, -0.8378673608045031 - 0.7998090363534014 \[FormalX] + 0.3641201395268242 \[FormalY] + (
0.12142198322226043` \[FormalX] + \[FormalY])^2}, {-1.386191173574215 + 6.876340113982251 \[FormalX] + 0.3861911735742149 \[FormalY] + (
2.63678329558176 \[FormalX] + \[FormalY])^2, -0.9444539134765445 - 0.989027738259701 \[FormalX] - 0.05554608652345553 \[FormalY] + ((-0.37924997540587335`) \[FormalX] + \[FormalY])^2}, {-0.31111179783473814` + 1.3262453164815902` \[FormalX] + 0.7939550674256386 \[FormalY] + (
0.885922693643422 \[FormalX] + \[FormalY])^2, -1.8777222219403336` - 1.6897879545060424` \[FormalX] - 1.0115894040734963` \[FormalY] + ((-1.1287666600879431`) \[FormalX] + \[FormalY])^2}, {-0.184895418610056 + 0.4786313285751155 \[FormalX] + 0.7840963591682427 \[FormalY] + (
0.24647786303197752` \[FormalX] + \[FormalY])^2, -14.417064086377 - 7.878531609145634 \[FormalX] - 12.906651908293375` \[FormalY] + ((-4.057159485638115) \[FormalX] + \[FormalY])^2}, {-0.1848954186100559 + 0.05941924673260154 \[FormalX] + 0.916713915173215 \[FormalY] + ((-0.24647786303197738`) \[FormalX] + \[FormalY])^2, -14.417064086377 - 0.9780730713304249 \[FormalX] - 15.089608903656124` \[FormalY] + (
4.057159485638115 \[FormalX] + \[FormalY])^2}}; Graphics[{Table[
ContourPlot[{mm[[k, 1]] == 0}, {\[FormalX], -1.4, 1.4}, {\[FormalY], -1.4, 1.4}, ContourStyle -> Hue[k/13]][[
1]], {k, 1, 13}], EdgeForm[Black], White, Disk[#, .1] & /@ p13, Black, MapIndexed[Style[Text[#2[[1]], #1], 18] &, p13]}]](https://www.wolframcloud.com/obj/resourcesystem/images/06c/06c7468a-6f14-4710-8954-dc821422cf95/1-0-0/5df5ba41514c76b0.png)
