Wolfram Function Repository
Instant-use add-on functions for the Wolfram Language
Function Repository Resource:
Find a conic equation that passes through five given points
ResourceFunction["FivePointConic"][pts,{x,y}] returns the implicit Cartesian equation in the variables x and y of the conic section that goes through the points pts. | |
ResourceFunction["FivePointConic"][pts] uses the formal variables x and y. |
Find a conic section through five points:
| In[1]:= |
| Out[2]= |
Show the conic and points:
| In[3]:= |
| Out[3]= | 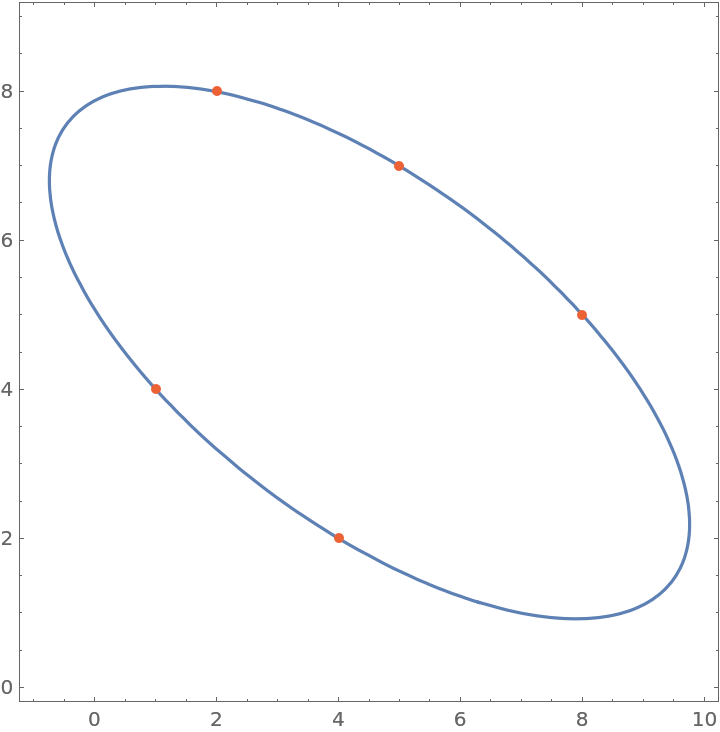 |
Use formal variables:
| In[4]:= |
| Out[4]= |
The results of a five point conic are usually a hyperbola:
| In[5]:= | ![points = {{-2, 1}, {-1, -2}, {1, -2}, {2, 1}, {0, 0}};
conic = ResourceFunction["FivePointConic"][points, {x, y}];
curve = ContourPlot[conic == 0, {x, -3, 3}, {y, -4, 4}][[1]];
Labeled[Graphics[{curve, {Directive[
AbsolutePointSize[5],
RGBColor[0.922526, 0.385626, 0.209179]], Point[points]}}, ImageSize -> Small], conic]](https://www.wolframcloud.com/obj/resourcesystem/images/939/9392aae5-a470-4807-9fa5-efc97608de61/238cebb885fb98c9.png) |
| Out[8]= | 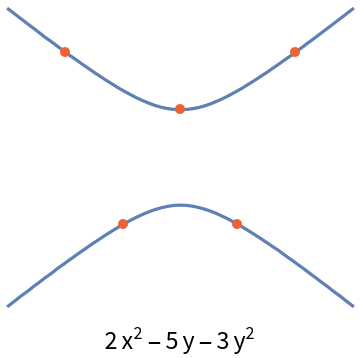 |
A random five point conic is also frequently an ellipse:
| In[9]:= | ![points = {{-2, 1}, {-1, -2}, {1, -2}, {2, 1}, {0, 2}};
conic = ResourceFunction["FivePointConic"][points, {x, y}];
curve = ContourPlot[conic == 0, {x, -3, 3}, {y, -4, 4}][[1]];
Labeled[Graphics[{curve, {Directive[
AbsolutePointSize[5],
RGBColor[0.922526, 0.385626, 0.209179]], Point[points]}}, ImageSize -> Small], conic]](https://www.wolframcloud.com/obj/resourcesystem/images/939/9392aae5-a470-4807-9fa5-efc97608de61/62d6e784d15e797a.png) |
| Out[12]= | 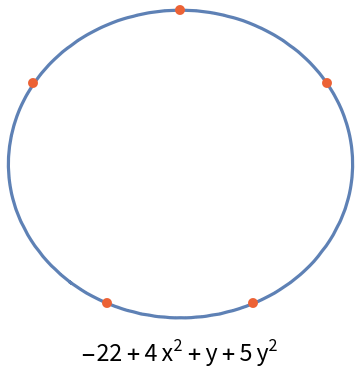 |
A circle can also be the result of a five point conic:
| In[13]:= | ![points = {{-2, 1}, {-1, -2}, {1, -2}, {2, 1}, {1, 2}};
conic = ResourceFunction["FivePointConic"][points, {x, y}];
curve = ContourPlot[conic == 0, {x, -3, 3}, {y, -4, 4}][[1]];
Labeled[Graphics[{curve, {Directive[
AbsolutePointSize[5],
RGBColor[0.922526, 0.385626, 0.209179]], Point[points]}}, ImageSize -> Small], conic]](https://www.wolframcloud.com/obj/resourcesystem/images/939/9392aae5-a470-4807-9fa5-efc97608de61/198e7840209e5979.png) |
| Out[16]= | 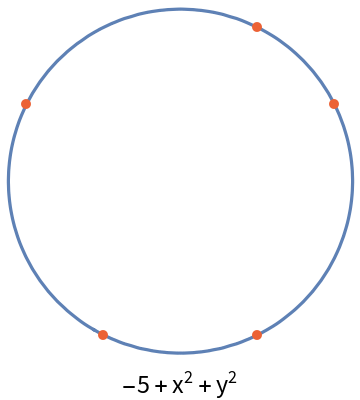 |
A parabola may also appear:
| In[17]:= | ![points = {{-2, 1}, {-1, -2}, {1, -2}, {2, 1}, {0, -3}};
conic = ResourceFunction["FivePointConic"][points, {x, y}];
curve = ContourPlot[conic == 0, {x, -3, 3}, {y, -4, 4}][[1]];
Labeled[Graphics[{curve, {Directive[
AbsolutePointSize[5],
RGBColor[0.922526, 0.385626, 0.209179]], Point[points]}}, ImageSize -> Small], conic]](https://www.wolframcloud.com/obj/resourcesystem/images/939/9392aae5-a470-4807-9fa5-efc97608de61/09ac48a9df829b57.png) |
| Out[20]= | 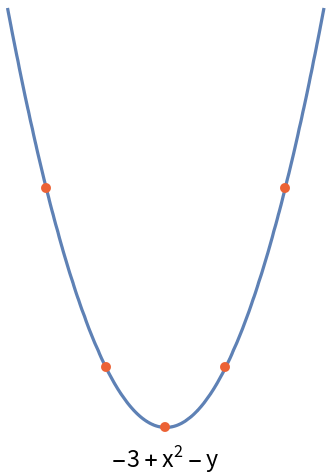 |
Degenerate conics are also possible:
| In[21]:= | ![points = {{-2, 1}, {-1, -2}, {1, -2}, {2, 1}, {0, -1}};
conic = ResourceFunction["FivePointConic"][points, {x, y}];
curve = ContourPlot[conic == 0, {x, -3, 3}, {y, -4, 4}][[1]];
Labeled[Graphics[{curve, {Directive[
AbsolutePointSize[5],
RGBColor[0.922526, 0.385626, 0.209179]], Point[points]}}, ImageSize -> Small], conic]](https://www.wolframcloud.com/obj/resourcesystem/images/939/9392aae5-a470-4807-9fa5-efc97608de61/5895c190f225000a.png) |
| Out[24]= | 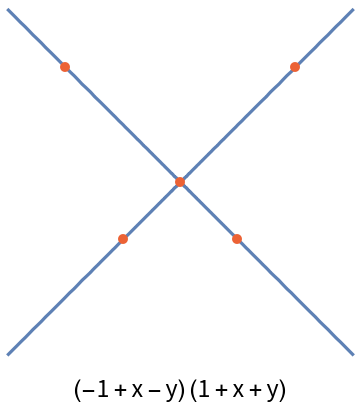 |
See the properties of the non-degenerate conics with the resource function ConicProperties:
| In[25]:= | ![base = {{-2, 1}, {-1, -2}, {1, -2}, {2, 1}};
last = {{0, 0}, {0, 2}, {0, -3}, {1, 2}};
ResourceFunction["ConicProperties"][
ResourceFunction["FivePointConic"][Append[base, #]] == 0, {\[FormalX], \[FormalY]}] & /@ last](https://www.wolframcloud.com/obj/resourcesystem/images/939/9392aae5-a470-4807-9fa5-efc97608de61/6b6b58fec5872fc0.png) |
| Out[26]= |  |
A function for characterizing a conic section:
| In[27]:= | ![CharacterizeConic[poly_] := Module[{\[FormalCapitalA], \[FormalCapitalB], \[FormalCapitalC], \[FormalCapitalD], \[FormalCapitalE], \[FormalCapitalF], discriminant,
coeff},
If[Length[FactorList[poly]] > 2 || NumericQ[poly], Return["D" (*degenerate*)]];
coeff = Flatten[CoefficientList[poly, {\[FormalX], \[FormalY]}, {3, 3}]];
{\[FormalCapitalA], \[FormalCapitalB], \[FormalCapitalC], \[FormalCapitalD], \[FormalCapitalE], \[FormalCapitalF]} = coeff[[{7, 5, 3, 4, 2, 1}]]; discriminant = \[FormalCapitalB]^2 - 4 \[FormalCapitalA] \[FormalCapitalC];
Which[
\[FormalCapitalB] == 0 && \[FormalCapitalA] == \[FormalCapitalC], "C" (*circle*),
discriminant == 0, "P" (*parabola*),
discriminant < 0, "E" (*ellipse*),
discriminant > 0, "H" (*hyperbola*),
True, "D" (*degenerate*)
]]](https://www.wolframcloud.com/obj/resourcesystem/images/939/9392aae5-a470-4807-9fa5-efc97608de61/274ec3d39b6ecf36.png) |
A sample conic section:
| In[28]:= | ![SeedRandom[2];
r5 = RandomInteger[{-10, 10}, {5, 2}];
poly = ResourceFunction["FivePointConic"][r5]](https://www.wolframcloud.com/obj/resourcesystem/images/939/9392aae5-a470-4807-9fa5-efc97608de61/575ea31f0a5cb3e3.png) |
| Out[29]= |
The above polynomial defines a hyperbola:
| In[30]:= |
| Out[30]= |
Degenerate conics appear frequently when selecting from a limited lattice:
| In[31]:= | ![SeedRandom[1];
pols = Table[
ResourceFunction["FivePointConic"][
RandomInteger[{-4, 4}, {5, 2}]], {5000}];
SortBy[Tally[CharacterizeConic /@ pols], -Last[#] &]](https://www.wolframcloud.com/obj/resourcesystem/images/939/9392aae5-a470-4807-9fa5-efc97608de61/63f75a989047e725.png) |
| Out[32]= |
For random real-valued points, the result is always a hyperbola or ellipse:
| In[33]:= | ![SeedRandom[1];
pols = Table[
ResourceFunction["FivePointConic"][
RandomReal[{-4, 4}, {5, 2}]], {5000}];
SortBy[Tally[CharacterizeConic /@ pols], -Last[#] &]](https://www.wolframcloud.com/obj/resourcesystem/images/939/9392aae5-a470-4807-9fa5-efc97608de61/0a382c626eb08fe9.png) |
| Out[34]= |
This work is licensed under a Creative Commons Attribution 4.0 International License