Basic Examples (2)
Form a Graphics object:
Extract the underlying primitives:
Apart from the primitives, also include their accompanying directives one level up:
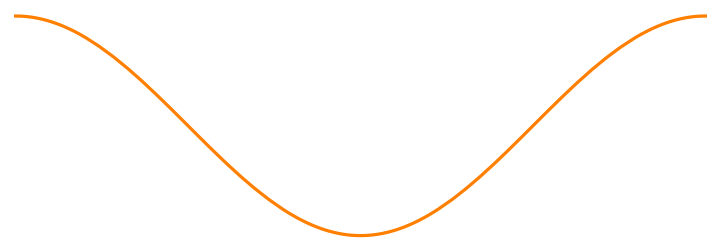
Keep the primitives but remove the directives:
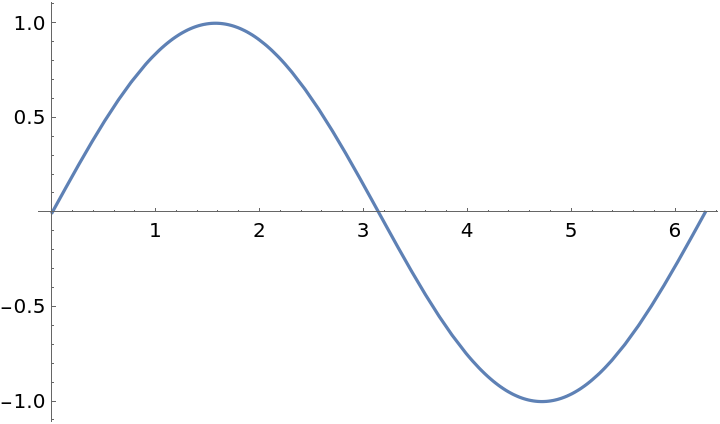
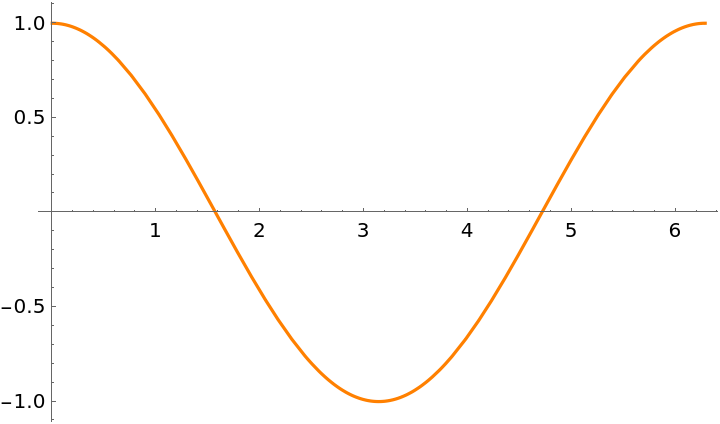
Extract primitives from a plot:
Display the primitives:
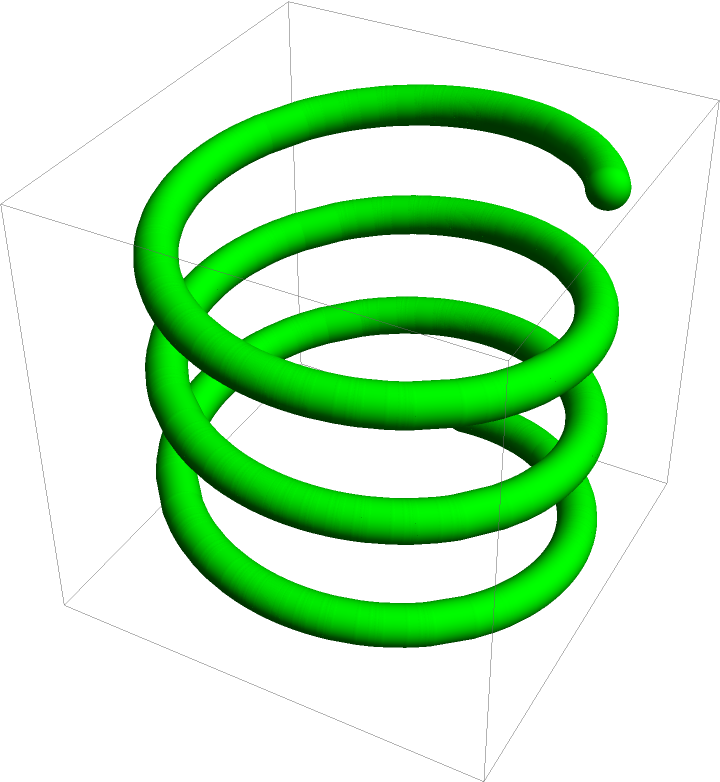
Apply a different styling to the extracted primitive:
Scope (8)
Input objects (4)
Extract primitives from Graphics objects generated by 2D plotting functions:
Show the primitive:
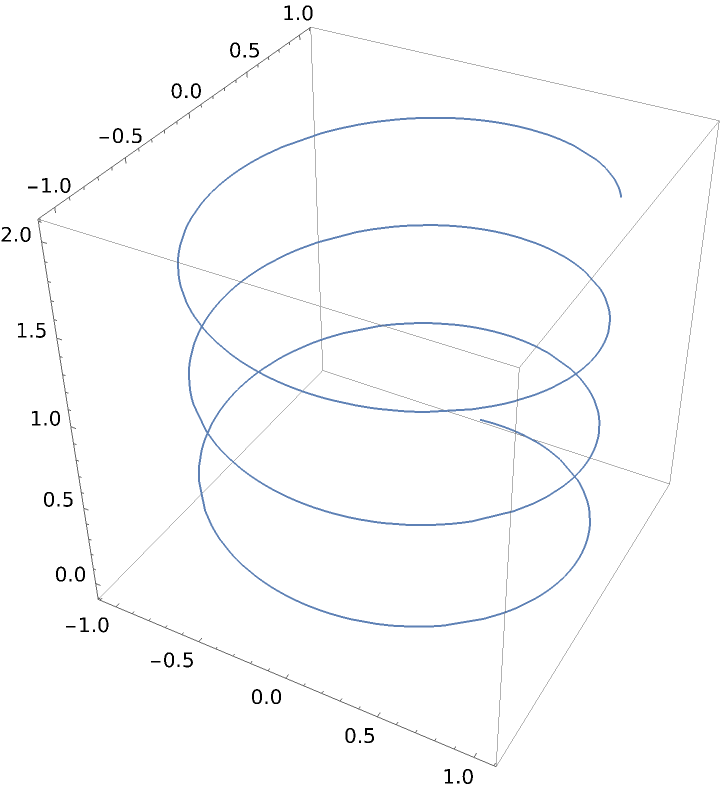
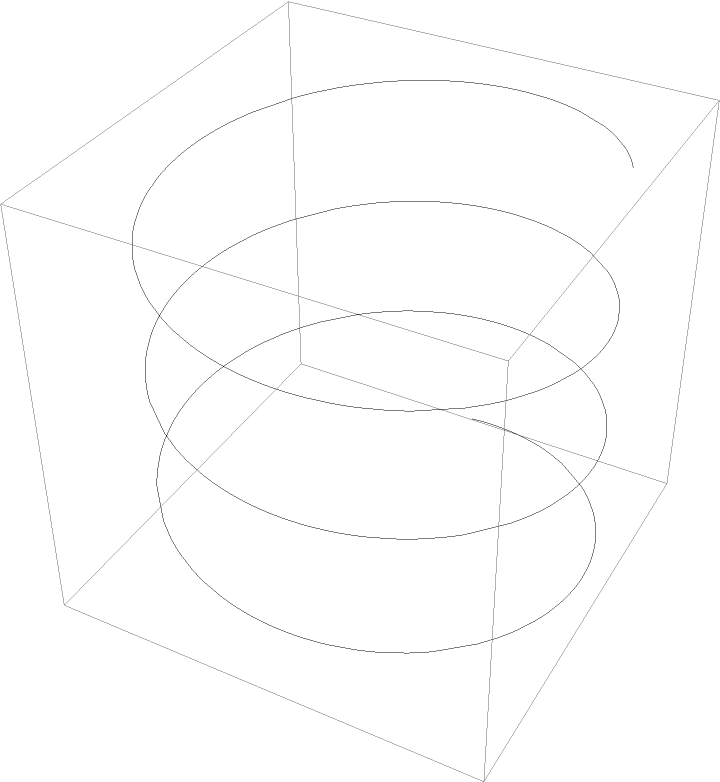
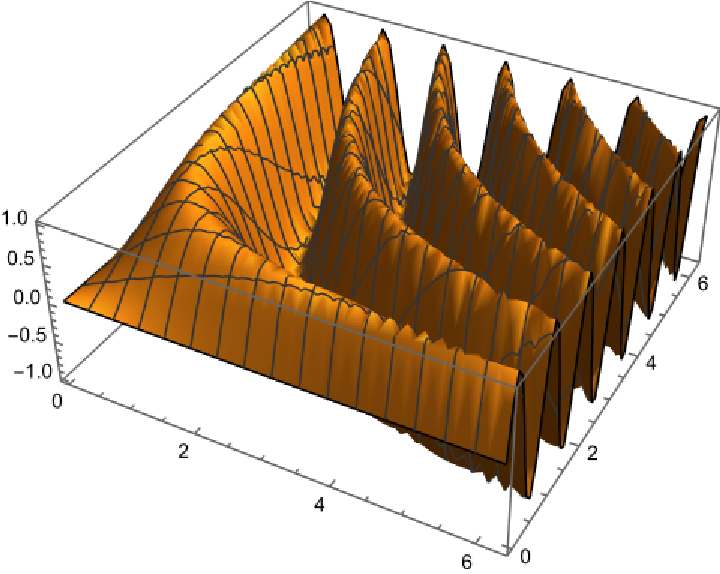
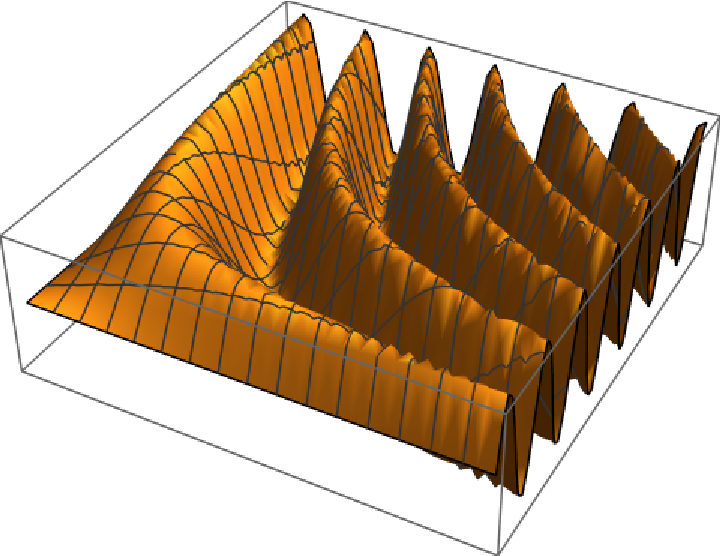
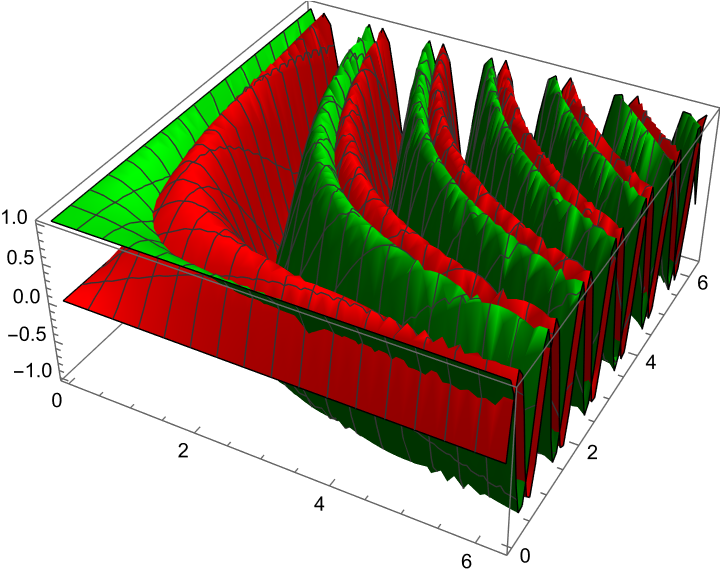
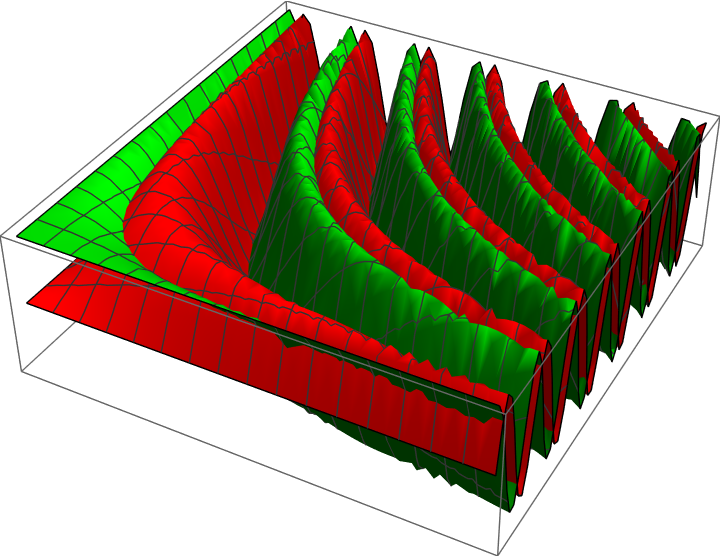
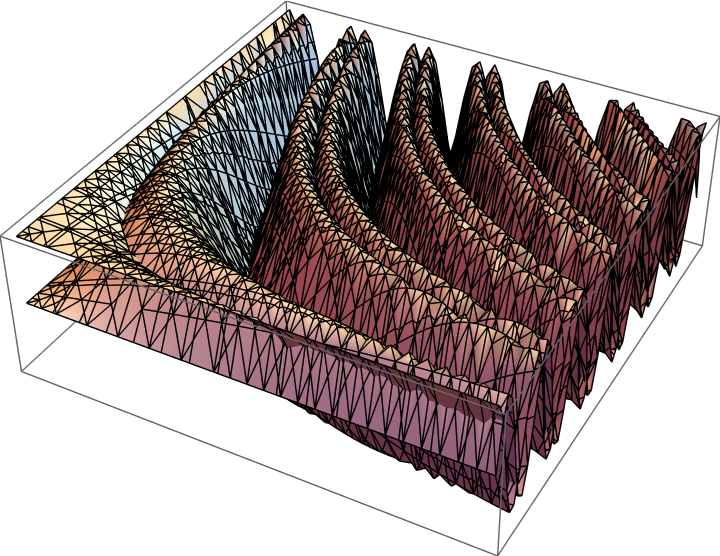
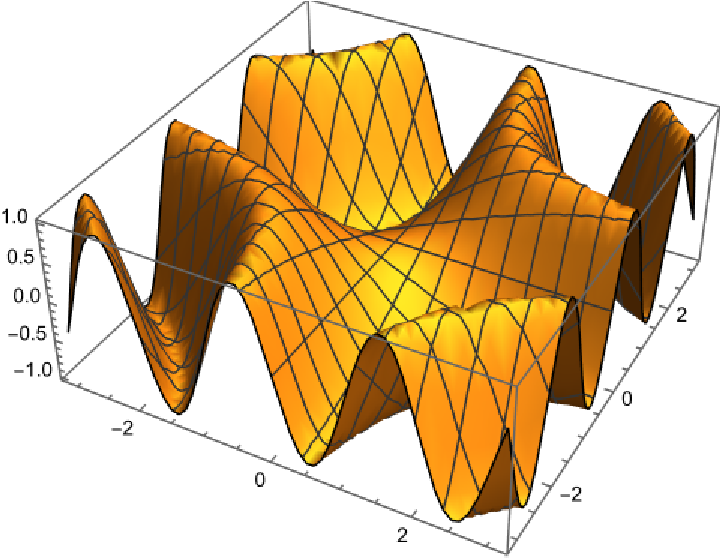
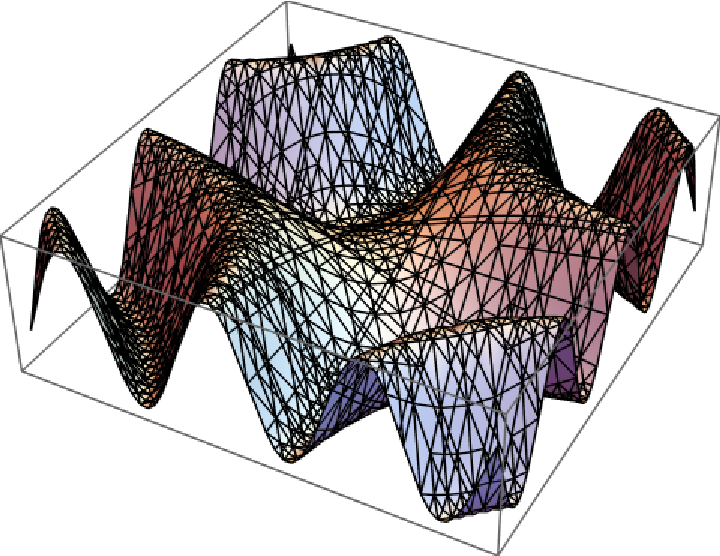
Extract primitives from Graphics3D objects generated by 3D plotting functions:
Show the primitive:
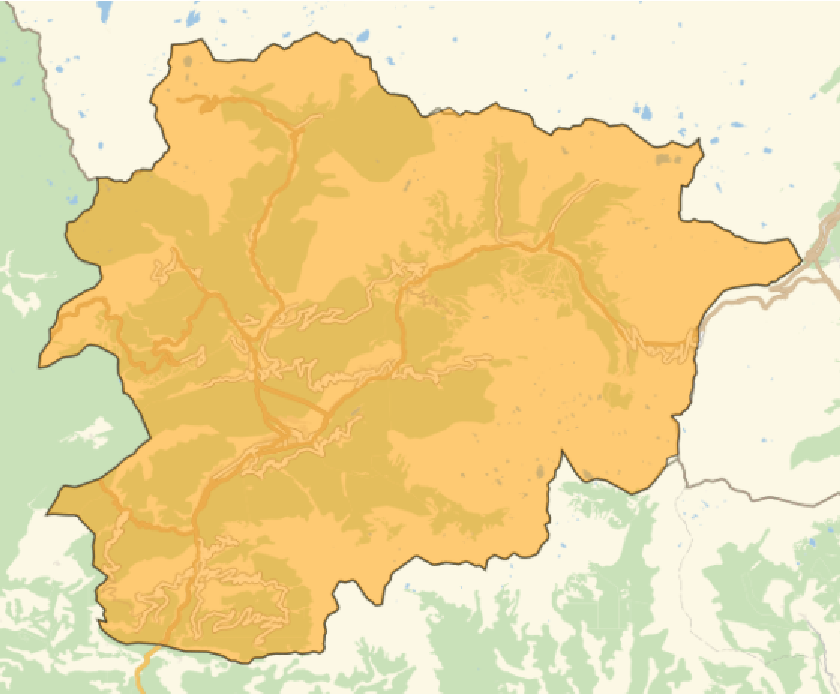
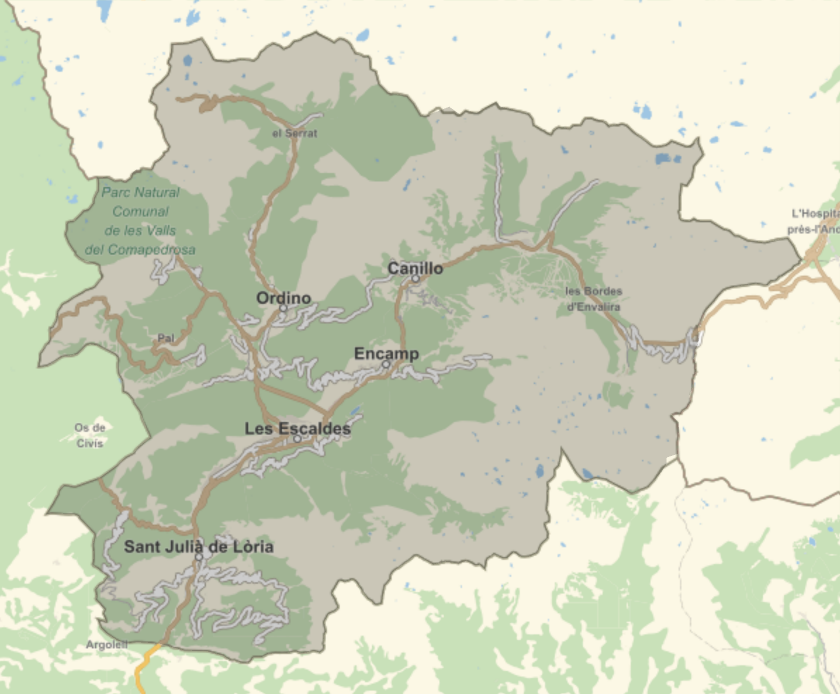
Extract primitives from GeoGraphics objects generated by geo plotting functions:
Show the primitives:
The input object can be more general:
Level specification (2)
By default, only the primitives themselves are extracted, which might lead to the loss of styling:
Include also the styling by increasing the level parameter:
Usually only a certain range of level values gives useful results:
Styling preservation (2)
By default, the styling is preserved (provided that the level specification is correct):
Remove the styling:
Properties and Relations (2)
The internal structure of graphics objects can be examined using InputForm:
Relevant primitives can be retrieved from this expression using Cases or Position:
Removing the styling of a graphical object via the third argument in ExtractGraphicsPrimitives gives similar results to menu option Format ▶ Clear Formatting:
Compare with the approach when the output of Plot3D above is selected and then shortcut + + (for Windows) is pressed:
Possible Issues (5)
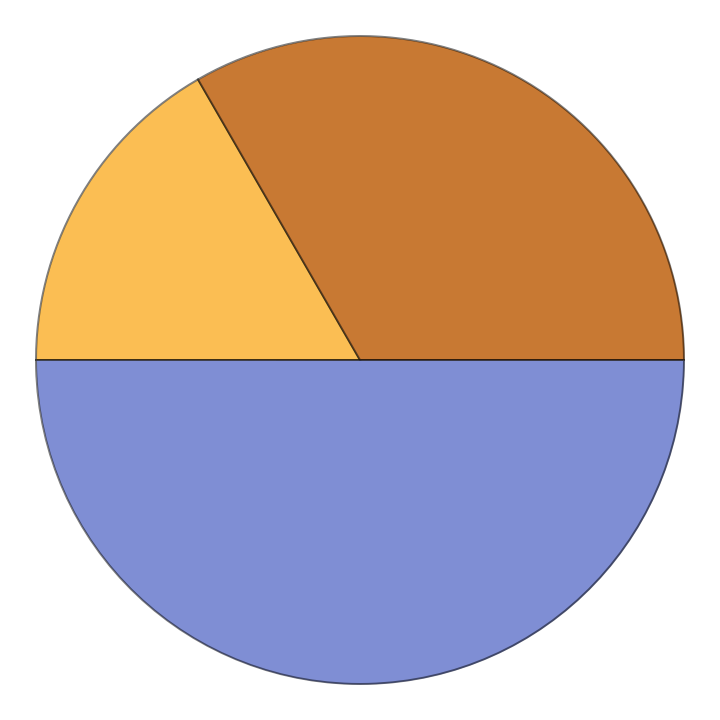
Charts are by default interactive, which may cause problems when extracting the primitives:
Effectively turn off interactivity by setting PerformanceGoal to "Speed":
Some charts and plots store styling information in the higher levels of the hierarchy:
Increment the level parameter to include also the styling information:
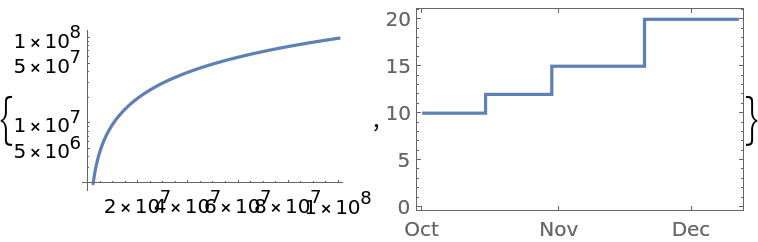
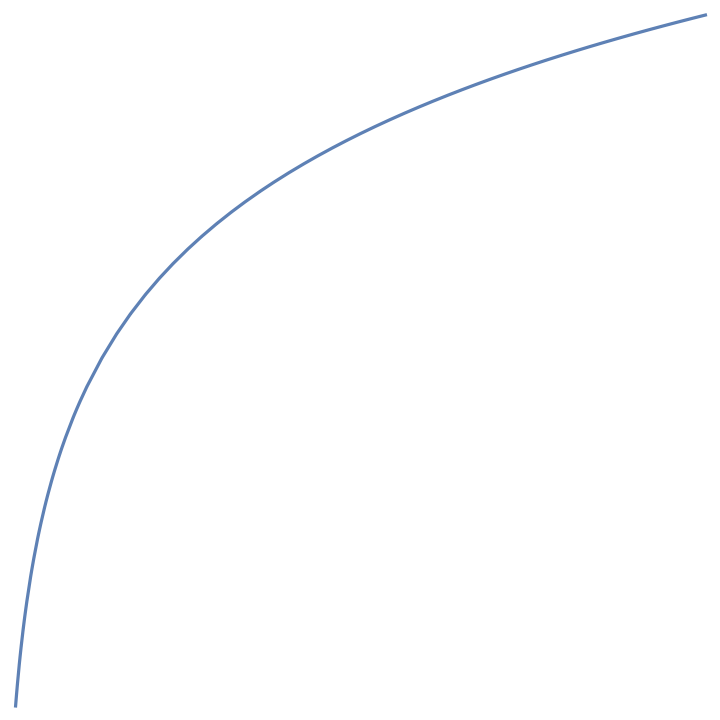
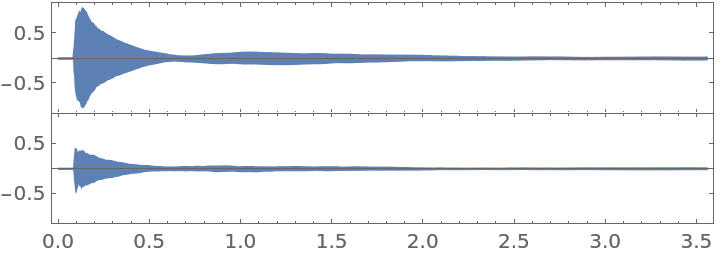
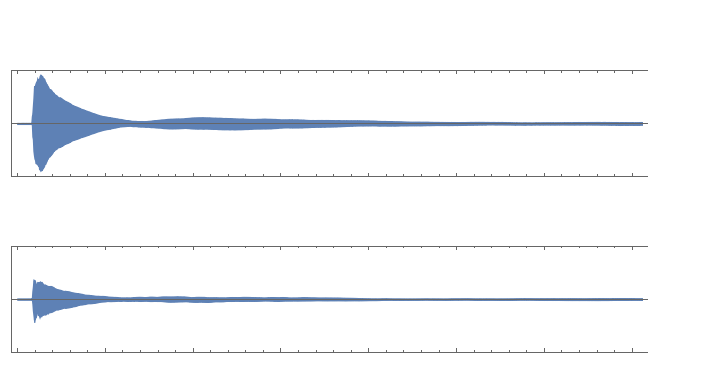
Some plotting functions adjust the aspect ratio to accommodate the plot. Extracting the primitives resets this ratio:
The line appears flat due to disproportionate values in the horizontal and vertical axes. Set the aspect ratio appropriately:
Similar problems arise when plotting against dates:
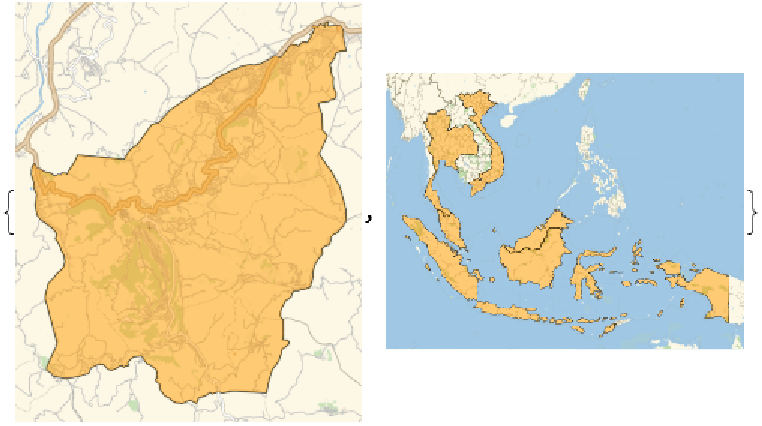
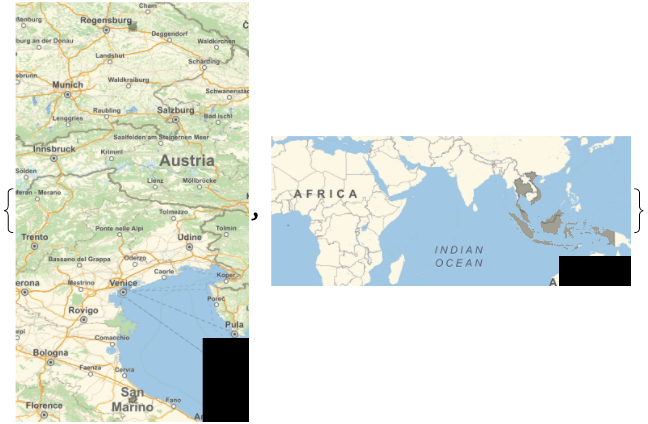
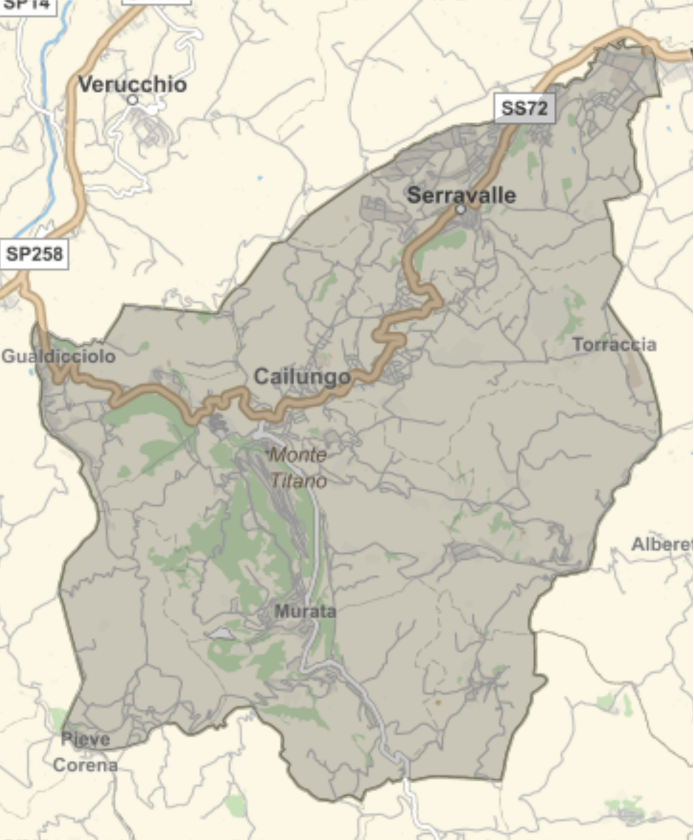
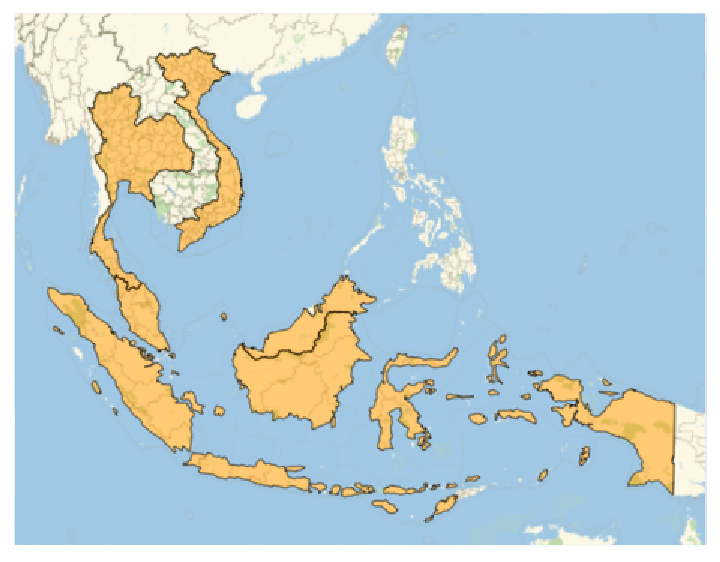
The output of geographics functions contains more primitives than are directly visible:
Plotting all these primitives may lead to unexpected results:
Choose only the relevant primitives:
Additional primitives might be stored inside the value for the option Method. Remove it to obtain better results:
The output of some plotting functions contains more graphics wrapped in Inset, which may lead to unexpected results:
Adjust manually the position of Inset objects or fix the PlotRange:


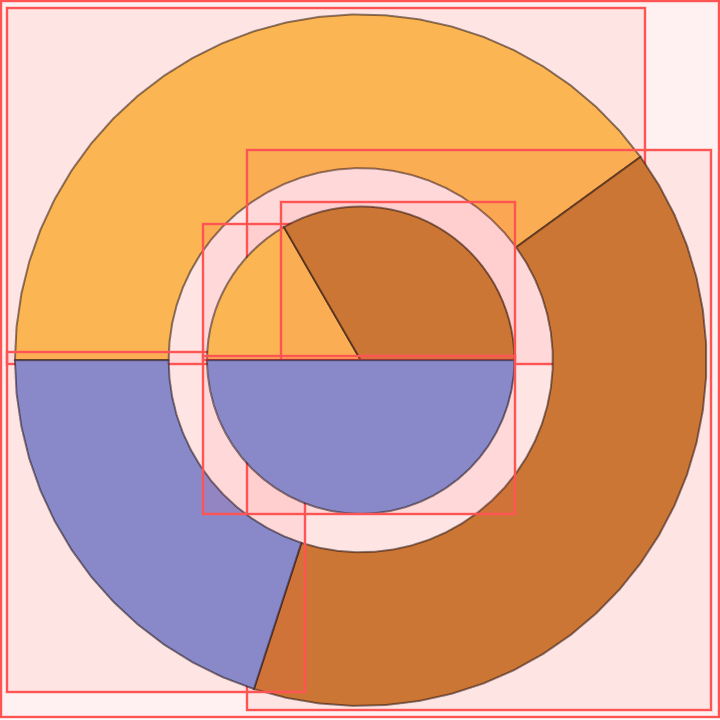
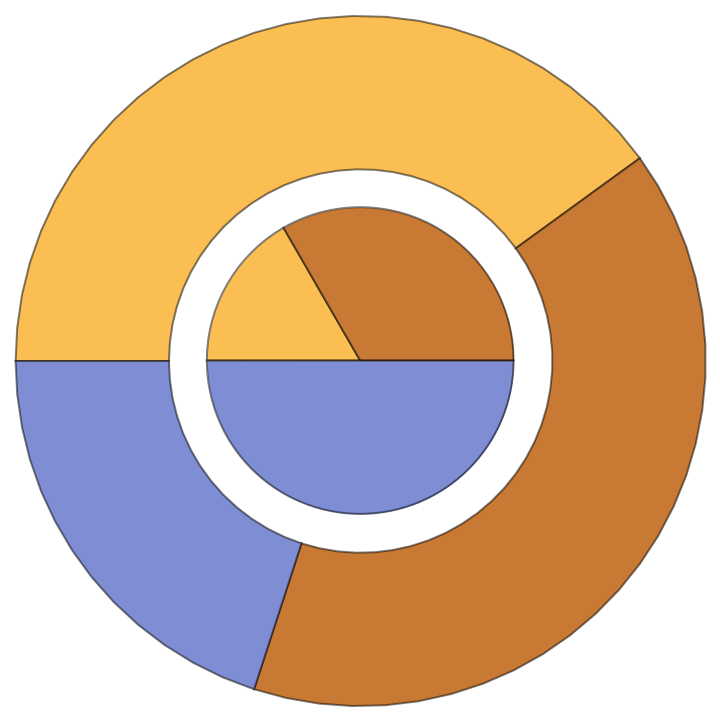
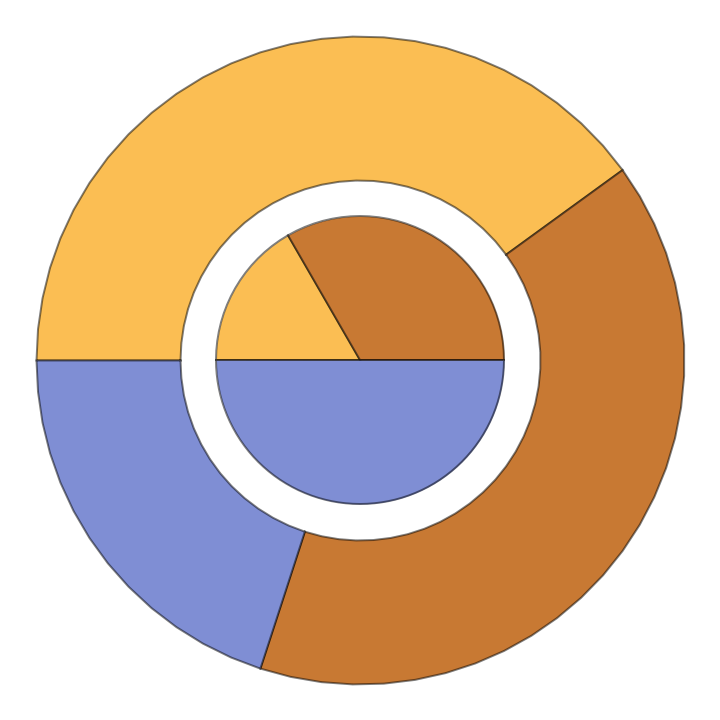
![Framed@Graphics[ResourceFunction["ExtractGraphicsPrimitives"][pie, #],
PlotLabel -> "Level = " <> ToString[#]] & /@ {0, 1, 20}](https://www.wolframcloud.com/obj/resourcesystem/images/95e/95ed8a34-1642-41dd-9602-88d879852fa9/54b66a83771c903d.png)


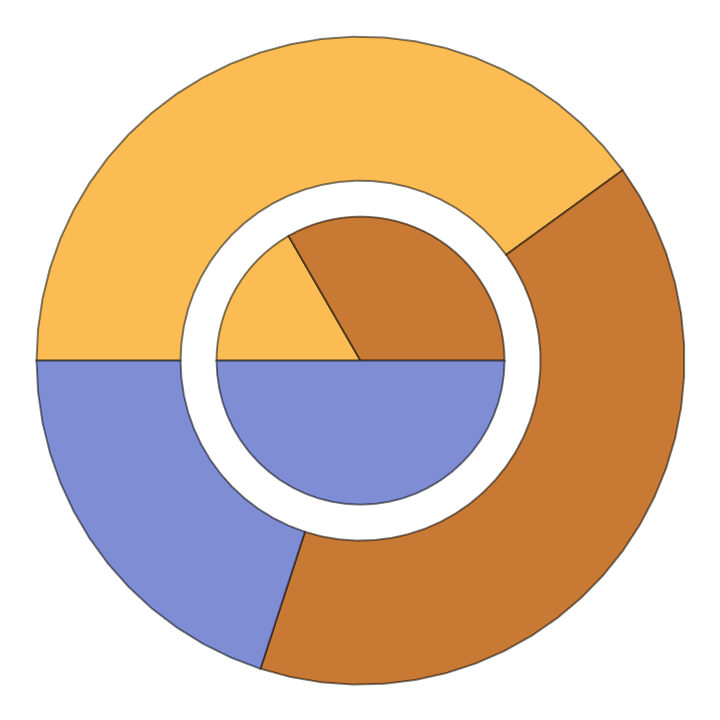
![pie = PieChart[{{1, 2, 3}, {2, 2, 1}}, PerformanceGoal -> "Speed"];
Graphics[ResourceFunction["ExtractGraphicsPrimitives"][pie, 5]]](https://www.wolframcloud.com/obj/resourcesystem/images/95e/95ed8a34-1642-41dd-9602-88d879852fa9/72de898c93877e6c.png)


![{plot, dateplot} = {LogPlot[x, {x, 0, 10^8}], DateListStepPlot[{{DateObject[{2006, 10, 1}, "Day", "Gregorian", -6.`], 10}, {DateObject[{2006, 10, 15}, "Day", "Gregorian", -6.`], 12}, {DateObject[{2006, 10, 30}, "Day", "Gregorian", -6.`], 15}, {DateObject[{2006, 11, 20}, "Day", "Gregorian", -6.`], 20}}]}](https://www.wolframcloud.com/obj/resourcesystem/images/95e/95ed8a34-1642-41dd-9602-88d879852fa9/758bdee100feaf4b.png)

![{plot1, plot2} = {GeoListPlot[Entity["Country", "SanMarino"]], GeoListPlot[{Entity["Country", "Indonesia"], Entity["Country", "Malaysia"], Entity["Country", "Thailand"], Entity["Country", "Vietnam"]}]}](https://www.wolframcloud.com/obj/resourcesystem/images/95e/95ed8a34-1642-41dd-9602-88d879852fa9/377947af7dd195d8.png)

![(* Evaluate this cell to get the example input *) CloudGet["https://www.wolframcloud.com/obj/2d85216d-1194-427d-a7bf-ed5f26fbd845"]](https://www.wolframcloud.com/obj/resourcesystem/images/95e/95ed8a34-1642-41dd-9602-88d879852fa9/7f19c236f3692893.png)
![outer = ResourceFunction["ExtractGraphicsPrimitives"][#, 0, False] &@
RevolutionPlot3D[-10 + 5 x, {x, 2, 3}, Mesh -> None];
inner = ResourceFunction["ExtractGraphicsPrimitives"][#, 0, False] &@
RevolutionPlot3D[-7.7 + 4.7 x, {x, 1.7, 2.7}, Mesh -> None];
liquid = ResourceFunction["ExtractGraphicsPrimitives"][#, 0, False] &@
RevolutionPlot3D[-7.71 + 4.7 x, {x, 1.69, 2.19}, Mesh -> None];](https://www.wolframcloud.com/obj/resourcesystem/images/95e/95ed8a34-1642-41dd-9602-88d879852fa9/423d1ae1997b58dd.png)

![Graphics3D[{Opacity[0.5, LightBlue], EdgeForm[], rim, outer, inner, Green, liquid, Translate[
Scale[#, {1, 1, 1} (2.5 - 0.4)/BesselJZero[3, 3]], {0, 0, 2.5}] &@ResourceFunction["ExtractGraphicsPrimitives"][surface, 0, False]}, Boxed -> False]](https://www.wolframcloud.com/obj/resourcesystem/images/95e/95ed8a34-1642-41dd-9602-88d879852fa9/663784dfd7042be8.png)
