Wolfram Function Repository
Instant-use add-on functions for the Wolfram Language
Function Repository Resource:
Test if an expression is a graphics directive
ResourceFunction["GraphicsDirectiveQ"][expr] test if expr is a graphics directive. |
Test common directives:
| In[1]:= |
| Out[1]= |
| In[2]:= |
| Out[2]= |
Test a more complicated directive:
| In[3]:= | ![ResourceFunction["GraphicsDirectiveQ"][
Directive[Specularity[GrayLevel[1], 3], RGBColor[
0.880722, 0.611041, 0.142051], Lighting -> {{"Ambient", RGBColor[
0.30100577, 0.22414668499999998`, 0.090484535]}, {"Directional", RGBColor[0.2642166, 0.18331229999999998`, 0.04261530000000001], ImageScaled[{0, 2, 2}]}, {"Directional", RGBColor[
0.2642166, 0.18331229999999998`, 0.04261530000000001], ImageScaled[{2, 2, 2}]}, {"Directional", RGBColor[
0.2642166, 0.18331229999999998`, 0.04261530000000001], ImageScaled[{2, 0, 2}]}}]]](https://www.wolframcloud.com/obj/resourcesystem/images/bc4/bc41d675-7254-4312-ba5c-214bc1447f70/51b69c34fdec006c.png) |
| Out[3]= |
A plot:
| In[4]:= |
| Out[4]= | 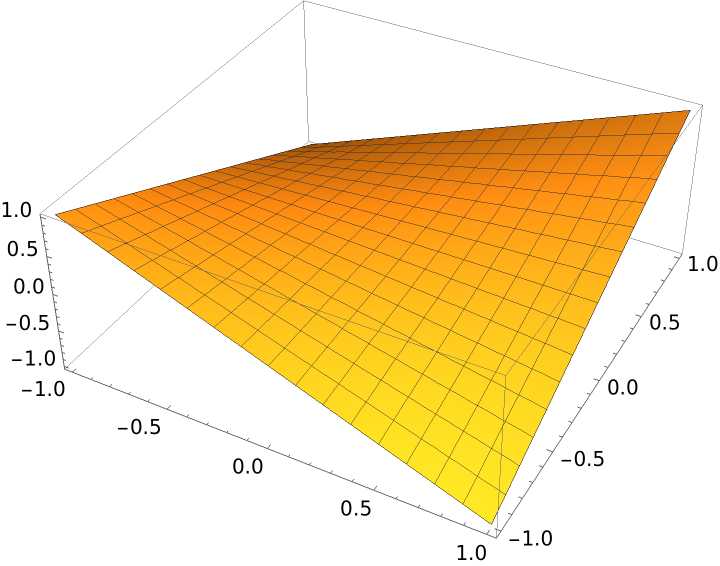 |
Extract directives from the plot:
| In[5]:= |
| Out[5]= |  |
The directive for a sphere with glow:
| In[6]:= | ![Cases[\!\(\*
Graphics3DBox[
{RGBColor[1., 0.5, 0.5], Glow[
RGBColor[0., 0., 0.19999999999999996`]], Specularity[
RGBColor[1, 1, 0], 30], SphereBox[{0, 0, 0}]},
Lighting->{{"Point",
RGBColor[0.88, 1, 0.88], {0, 0, 3}}}]\), _?ResourceFunction[
"GraphicsDirectiveQ"], {2}]](https://www.wolframcloud.com/obj/resourcesystem/images/bc4/bc41d675-7254-4312-ba5c-214bc1447f70/7abc3369e723f138.png) |
| Out[6]= |
Pass directives from the previous plot to another plot:
| In[7]:= |
| Out[7]= | 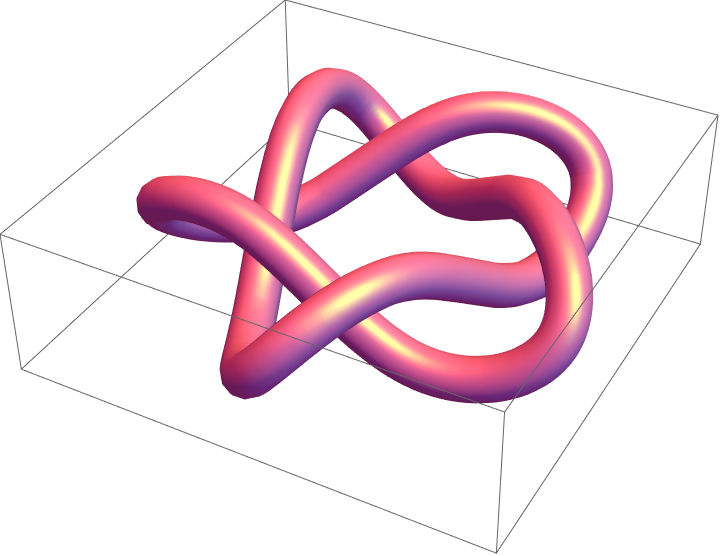 |
Create a plot containing some directives:
| In[8]:= |
| Out[8]= | 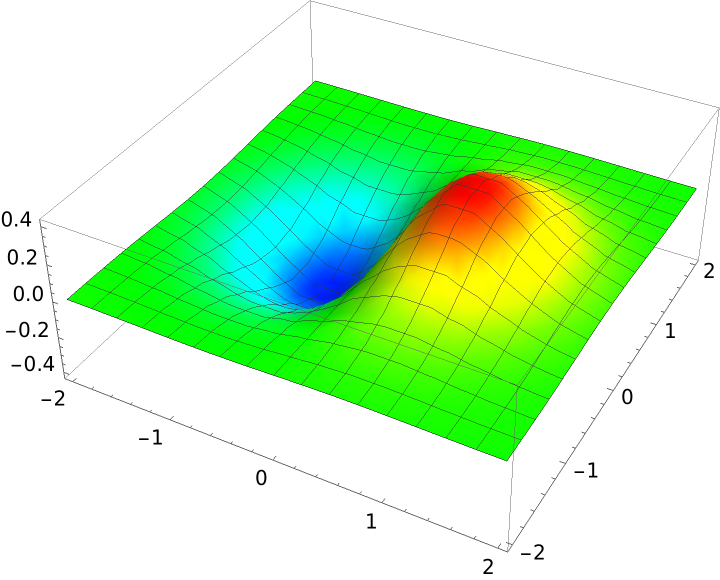 |
Delete the directives within the plot:
| In[9]:= |
| Out[9]= | 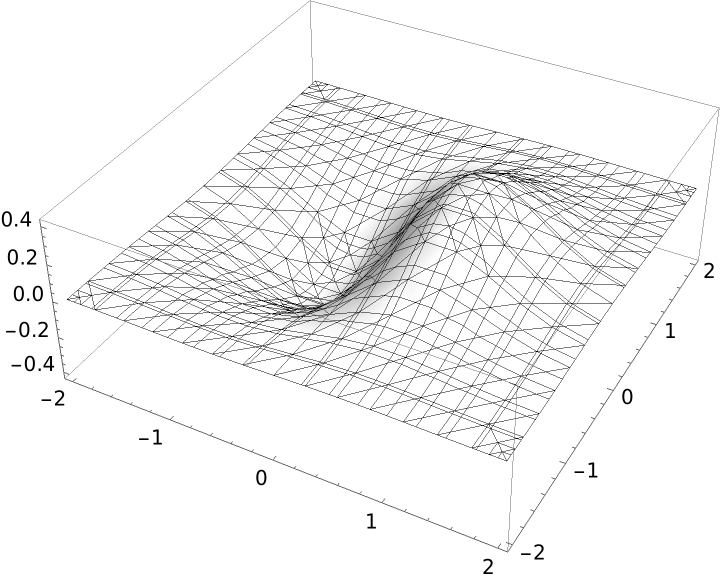 |
Create a plot using a PlotTheme:
| In[10]:= |
| Out[10]= | 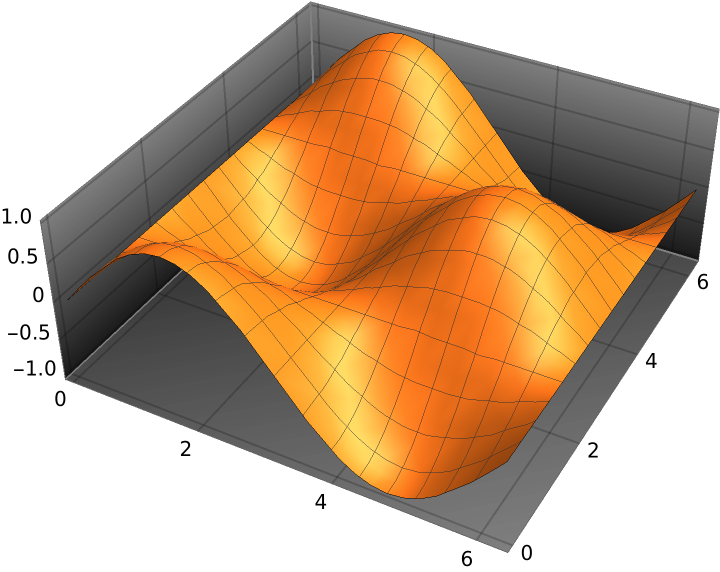 |
Extract directives that appear in the previous output that were generated automatically by the PlotTheme:
| In[11]:= |
| Out[11]= |  |
Create a plot whose output contains some directives:
| In[12]:= |
| Out[12]= | 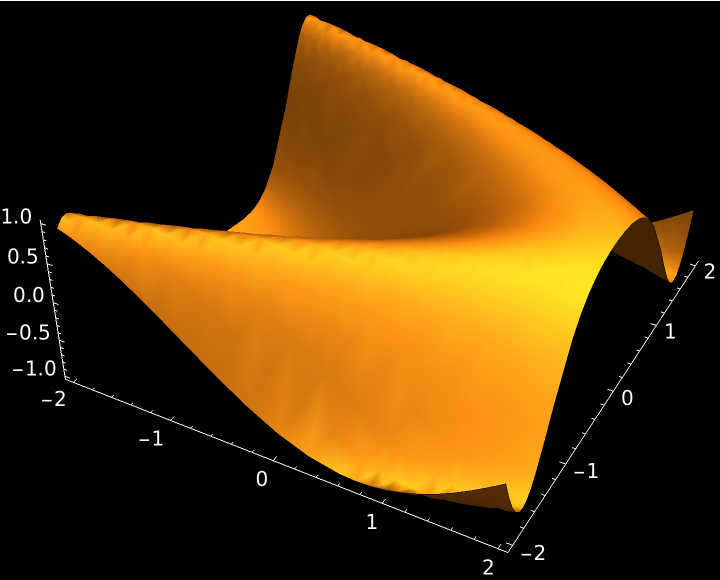 |
Look at the structure of the code of the plot, showing explicitly only directives:
| In[13]:= | ![MapAt[Inactive, gr /. {v_?VectorQ /; ! MemberQ[v, _?ResourceFunction[
"GraphicsDirectiveQ"], \[Infinity]] :> Iconize[v, "vector"],
m_?MatrixQ :> Iconize[m, "matrix"], r_Rule | r_RuleDelayed /; ! MemberQ[r, _?ResourceFunction[
"GraphicsDirectiveQ"], \[Infinity]] :> Iconize[r, "option"]},
0]](https://www.wolframcloud.com/obj/resourcesystem/images/bc4/bc41d675-7254-4312-ba5c-214bc1447f70/6bf4088f39bec5fa.png) |
| Out[13]= | 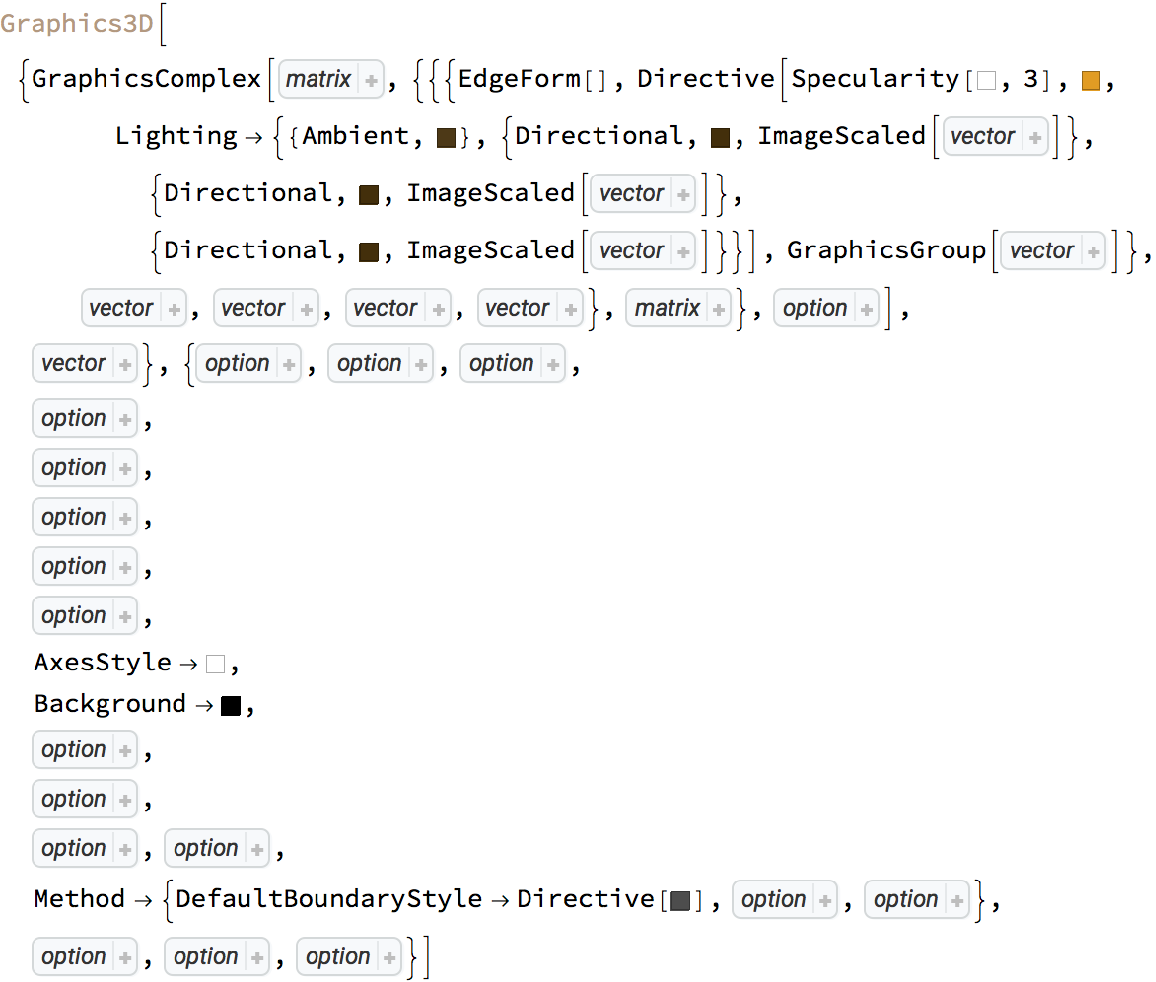 |
This work is licensed under a Creative Commons Attribution 4.0 International License