Wolfram Function Repository
Instant-use add-on functions for the Wolfram Language
Function Repository Resource:
Computes an expectation of classifier measurements over a probability distribution of utility functions
ResourceFunction["ExpectedClassifierMeasurements"][classifier,testset,{probs1,…probsn}→{u1,…,un}, prop] gives the expected measurements for property prop when classifier is evaluated on testset and utility functions ui, determining how an example is classified, are chosen from distributions with corresponding probabilities probsi. | |
ResourceFunction["ExpectedClassifierMeasurements"][classifier,testset,{probs1,probs2,…probsn}→{u1,u2,…,un},{prop1,prop2,…}] gives the expected measurements for properties propi. | |
ResourceFunction["ExpectedClassifierMeasurements"][classifier,testset,dist,prop] specifies the probability distribution directly as any form of DataDistribution. |
Get training data on the Titanic:
| In[1]:= |
| Out[1]= |
Get test data:
| In[2]:= |
| Out[2]= |
Build a classifier:
| In[3]:= |
| Out[3]= |
Develop two different utility functions:
| In[4]:= |  |
Compute the expected confusion matrix:
| In[5]:= |
| Out[5]= |
Compute the expected "F1Score" and "CohenKappa" measure:
| In[6]:= |
| Out[6]= |
Get training and test data on the Titanic and generate a classifier:

Develop two different utility functions:
| In[7]:= |  |
Use rules rather than a type of DataDistribution to represent the distribution of utility functions:
| In[8]:= |
| Out[8]= |
Use a symbolic distribution of utilities:
| In[9]:= |
| Out[9]= |  |
The function works with more than two utility functions:
| In[10]:= | ![ResourceFunction[
"ExpectedClassifierMeasurements"][c, titanicTest, {0.5, 0.4, 0.1} -> Append[utilities, <|"died" -> <|"died" -> 0, "survived" -> -0.5`|>, "survived" -> <|"died" -> -1, "survived" -> 0|>|>], {"ConfusionMatrix", "F1Score", "CohenKappa"}]](https://www.wolframcloud.com/obj/resourcesystem/images/dc1/dc1368c6-51c0-4a6b-ab7e-21a876001c02/04ac8b1b0ec09330.png) |
| Out[10]= |
Get training and test data on the Titanic, generate a classifier and create utility functions:
You can use weighted data by employing the Weights option:
| In[11]:= | ![With[{weights = RandomReal[{}, Length[titanicTest]]}, ResourceFunction["ExpectedClassifierMeasurements"][c, titanicTest, {0.2, 0.8} -> utilities, {"ConfusionMatrix", "F1Score",
"CohenKappa"}, Weights -> weights]]](https://www.wolframcloud.com/obj/resourcesystem/images/dc1/dc1368c6-51c0-4a6b-ab7e-21a876001c02/15add4a2ffa64dfe.png) |
| Out[11]= |
It will compute uncertainty where appropriate when the ComputeUncertainty option is set to True:
| In[12]:= | ![(SeedRandom[1234]; With[{weights = RandomReal[{}, Length[titanicTest]]}, ResourceFunction["ExpectedClassifierMeasurements"][c, titanicTest, {0.2, 0.8} -> utilities, {"ConfusionMatrix", "F1Score", "CohenKappa"}, ComputeUncertainty -> True]])](https://www.wolframcloud.com/obj/resourcesystem/images/dc1/dc1368c6-51c0-4a6b-ab7e-21a876001c02/11e137821c7a1e40.png) |
| Out[12]= |
It will work with an indeterminacy threshold if the IndeterminateThreshold option is used:
| In[13]:= |
| Out[13]= |
It will work with class priors if the ClassPriors option is used:
| In[14]:= | ![ResourceFunction[
"ExpectedClassifierMeasurements"][c, titanicTest, {0.2, 0.8} -> utilities, {"ConfusionMatrix", "F1Score", "CohenKappa"}, ClassPriors -> Association["died" -> 0.9, "survived" -> 0.1]]](https://www.wolframcloud.com/obj/resourcesystem/images/dc1/dc1368c6-51c0-4a6b-ab7e-21a876001c02/78a45212ac1e0650.png) |
| Out[14]= |
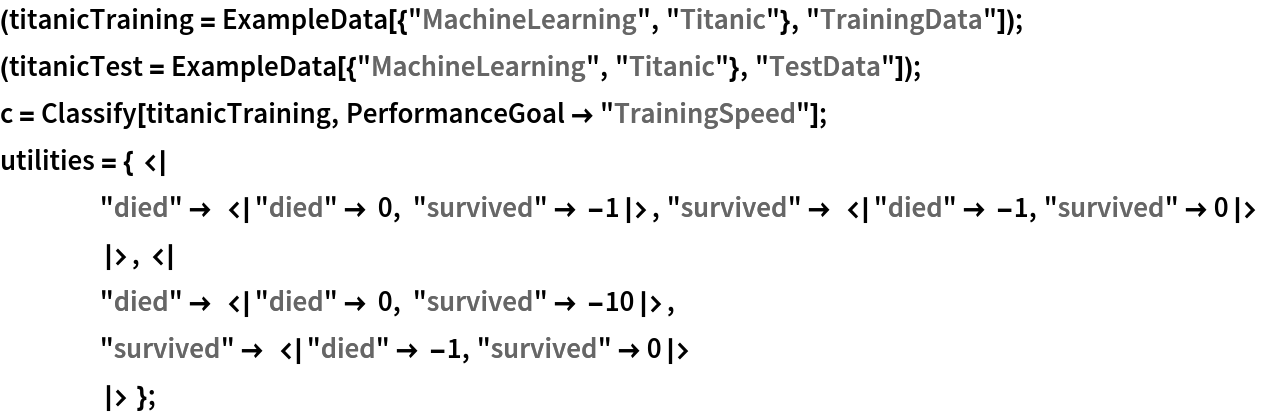
Get training and test data on the Titanic and generate a classifier:
| In[15]:= | ![(titanicTraining = ExampleData[{"MachineLearning", "Titanic"}, "TrainingData"]);
(titanicTest = ExampleData[{"MachineLearning", "Titanic"}, "TestData"]);
c = Classify[titanicTraining, PerformanceGoal -> "TrainingSpeed"];](https://www.wolframcloud.com/obj/resourcesystem/images/dc1/dc1368c6-51c0-4a6b-ab7e-21a876001c02/4be898546409ad70.png) |
Plot the possible combinations of false positive rates and true positive rates as the weight placed on the second of two utility functions goes from 0 to 1:
| In[16]:= | ![With[{\[Gamma] = Query[Values, "survived"][
ResourceFunction["ExpectedClassifierMeasurements"][c, titanicTest, {w, 1 - w} -> { <| "died" -> <|"died" -> 0, "survived" -> -1|>, "survived" -> <|"died" -> -1, "survived" -> 0|>
|>, <| "died" -> <|"died" -> 0, "survived" -> -3|>, "survived" -> <|"died" -> -1, "survived" -> 0|>
|> }, {"FalsePositiveRate", "TruePositiveRate"}]]}, ParametricPlot[\[Gamma], {w, 0, 1}, AspectRatio -> 1, Frame -> True, FrameLabel -> {"FPR", "TPR"}]
]](https://www.wolframcloud.com/obj/resourcesystem/images/dc1/dc1368c6-51c0-4a6b-ab7e-21a876001c02/40081d7b8f17c995.png) |
| Out[16]= | 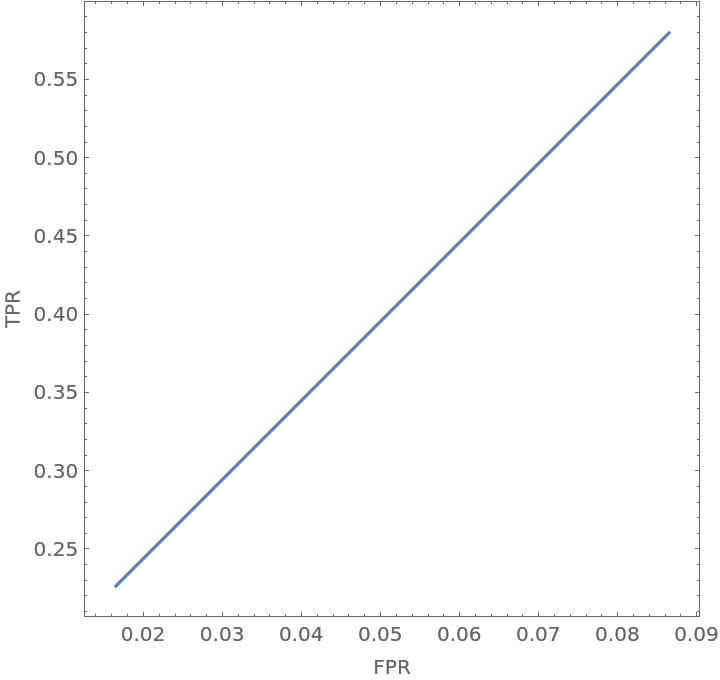 |
Show how the trajectory of false positive rates and true positive rates changes as one varies the second of two utility functions:
| In[17]:= | ![Manipulate[
With[{\[Gamma] = Query[Values, "survived"][
ResourceFunction["ExpectedClassifierMeasurements"][c, titanicTest, {w, 1 - w} -> { <| "died" -> <|"died" -> 0, "survived" -> -1|>, "survived" -> <|"died" -> -1, "survived" -> 0|>
|>, <| "died" -> <|"died" -> 0, "survived" -> -fn|>, "survived" -> <|"died" -> -1, "survived" -> 0|>
|> }, {"FalsePositiveRate", "TruePositiveRate"}]]},
ParametricPlot[\[Gamma], {w, 0, 1}, PlotRange -> {{0, 1}, {0, 1}}, AspectRatio -> 1, Frame -> True, FrameLabel -> {"FPR", "TPR"}]
],
{{fn, 2}, 0.1, 4}
]](https://www.wolframcloud.com/obj/resourcesystem/images/dc1/dc1368c6-51c0-4a6b-ab7e-21a876001c02/6f54f4a3452cf463.png) |
| Out[17]= | 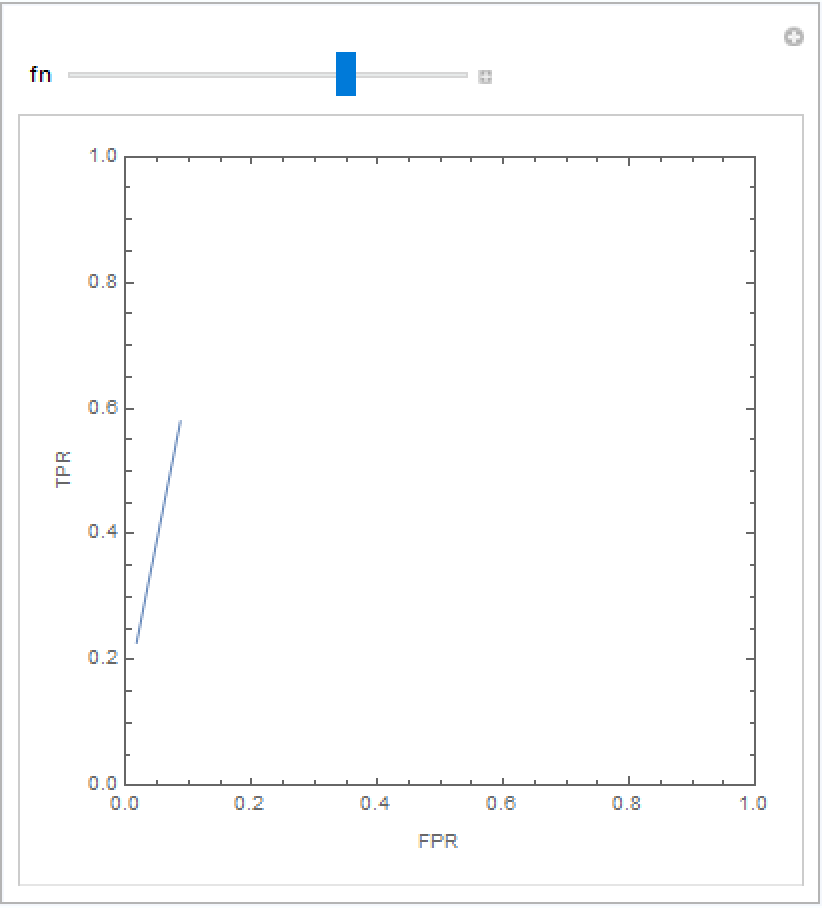 |
This work is licensed under a Creative Commons Attribution 4.0 International License