Wolfram Function Repository
Instant-use add-on functions for the Wolfram Language
Function Repository Resource:
A version of Show that allows you to zoom in on a graphic using your mouse
Click and drag to select regions of a plot that you wish to see enlarged. Single-click to reset the zoom area:
| In[1]:= |
| Out[1]= | 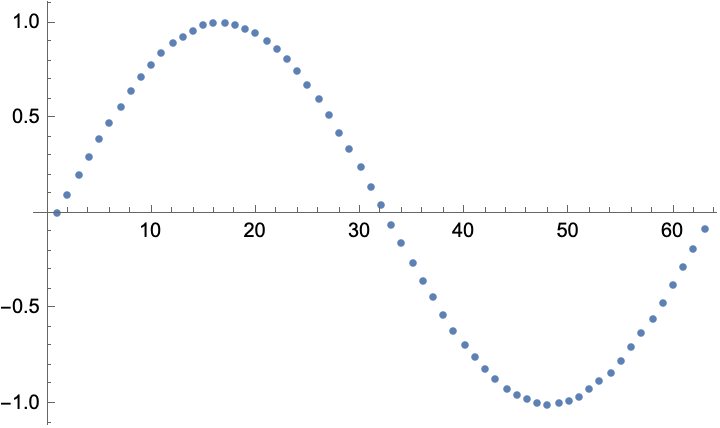 |
The selected range can dynamically update a variable and the plot updates if the variable changes value:
| In[2]:= | ![range = {{0, 25}, {0, 1}};
Column[{ResourceFunction["DragZoomShow"][Dynamic[range], ListPlot[Sin[Range[0, 2 Pi, 0.1]]], ImageSize -> 300], Dynamic[range]}]](https://www.wolframcloud.com/obj/resourcesystem/images/78b/78b9ef91-be8a-491d-920d-31847144a651/7a24d7d2ec7d9735.png) |
| Out[3]= | 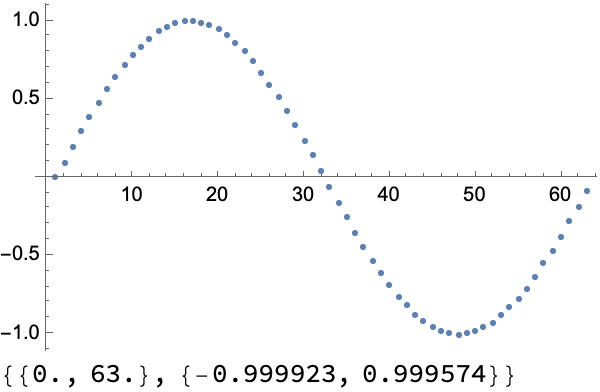 |
You cannot use the mouse to resize the result of DragZoomShow, so it is is necessary to use ImageSize to control the size:
| In[5]:= |
| Out[5]= |  |
Within Dynamic or Manipulate plot ranges automatically reset with each refresh:
| In[6]:= |
| Out[6]= | 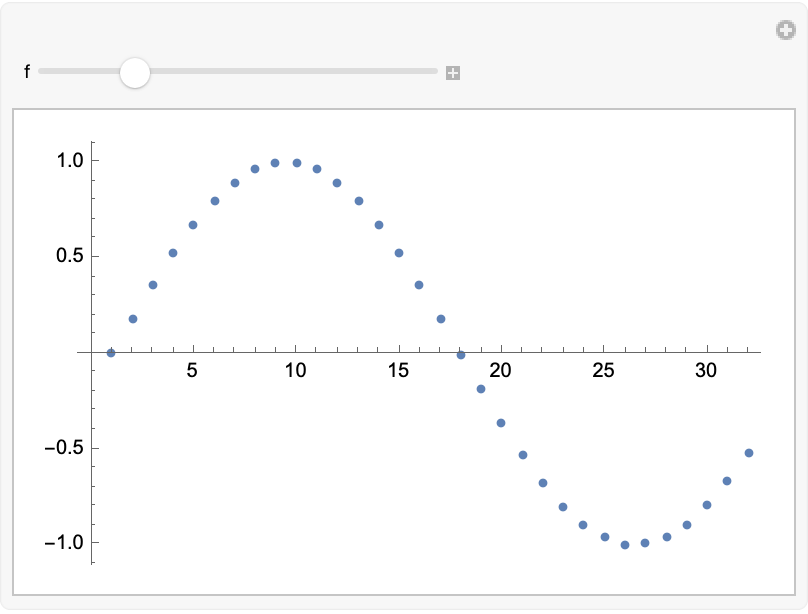 |
Specify a range variable to prevent automatic resets:
| In[7]:= | ![DynamicModule[{range},
Manipulate[
ResourceFunction["DragZoomShow"][Dynamic[range], ListPlot[Sin[f Range[0, Pi, 0.1]]]], {f, 1, 5}]]](https://www.wolframcloud.com/obj/resourcesystem/images/78b/78b9ef91-be8a-491d-920d-31847144a651/0896e6df9187c757.png) |
| Out[7]= | 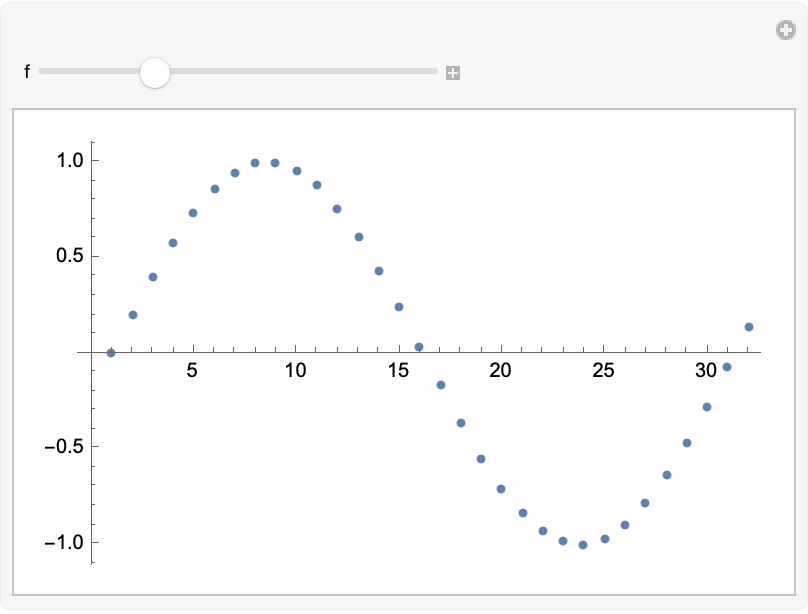 |
Zooming graphics with a fixed AxesOrigin may cause Axes not to be visible if the drag area does not cross the Axes:
| In[8]:= |
| Out[8]= |
| In[9]:= |
| Out[10]= | 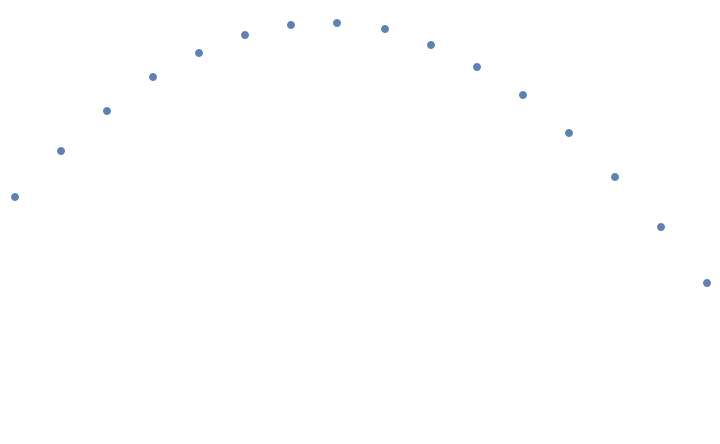 |
Including AxesOrigin → Automatic in the DragZoomShow will cause Axes to be reconsidered after a zoom action:
| In[11]:= |
| Out[12]= |  |
The original graphic is not recomputed after a zoom action. This will cause a loss of sampling resolution:
| In[13]:= |
| Out[14]= | 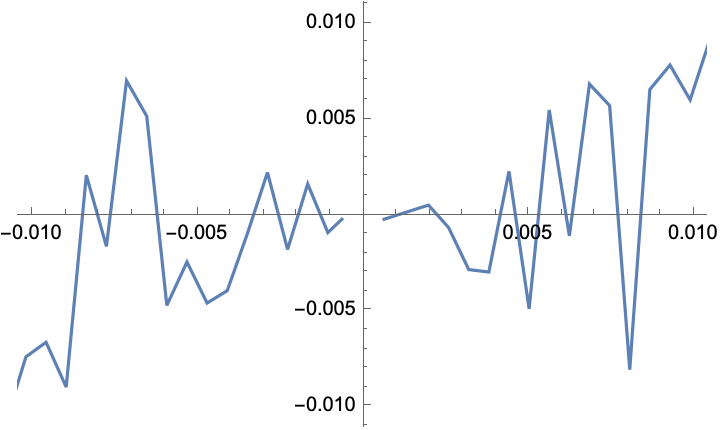 |
Increasing the sample rate much higher than is initially visible will help:
| In[15]:= |
| Out[16]= | 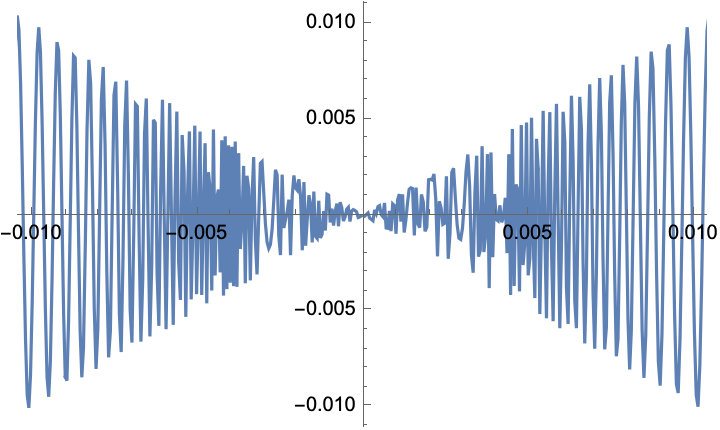 |
Use the ResourceFunction DragZoomPlot instead to recompute the contents after zoom:
| In[17]:= |
| Out[18]= | 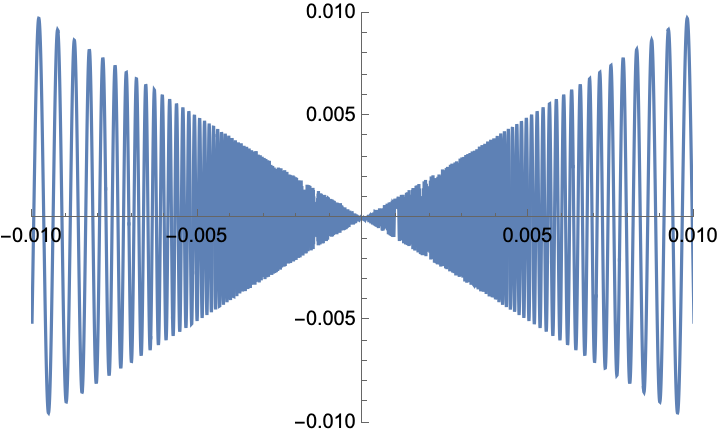 |
This work is licensed under a Creative Commons Attribution 4.0 International License
