Wolfram Function Repository
Instant-use add-on functions for the Wolfram Language
Function Repository Resource:
Get access to the ColorBrewer's colors
ResourceFunction["ColorBrewerData"][name,n] gives a sequence of n colors from the ColorBrewer scheme name. | |
ResourceFunction["ColorBrewerData"][name,"ColorFunction"] gives back a continuous function. | |
ResourceFunction["ColorBrewerData"][] gives the ColorBrewer color scheme categories. | |
ResourceFunction["ColorBrewerData"][category] gives a list of the color schemes in category. | |
ResourceFunction["ColorBrewerData"][name] gives the number of colors for the standard color scheme name. |
| "qual" | qualitative color schemes |
| "seq" | sequential color schemes |
| "div" | diverging color schemes |
| "qual" | "seq" | "div" |
| "Accent", "Dark2", "Paired", "Pastel1", "Pastel2", "Set1", "Set2", "Set3" | "Blues", "BuGn", "BuPu", "GnBu", "Greens", "Greys", "Oranges", "OrRd", "PuBu", "PuBuGn", "PuRd", "Purples", "RdPu", "Reds", "YlGn", "YlGnBu", "YlOrBr", "YlOrRd" | "BrBG", "PiYG", "PRGn", "PuOr", "RdBu", "RdGy", "RdYlBu", "RdYlGn", "Spectral" |
Give nine colors from ColorBrewer's color scheme "PuBuGn":
| In[1]:= |
| Out[1]= |
Give all the categories of ColorBrewer color schemes:
| In[2]:= |
| Out[2]= |
Give all the ColorBrewer color schemes from the category "seq":
| In[3]:= |
| Out[3]= |
Retrieve a color function based on a ColorBrewer color scheme:
| In[4]:= |
| Out[4]= | 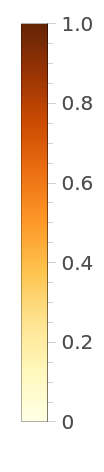 |
Retrieve the standard number of colors for a ColorBrewer scheme:
| In[5]:= |
| Out[5]= |
Use a ColorBrewer scheme for a plot:
| In[6]:= |
| Out[6]= | 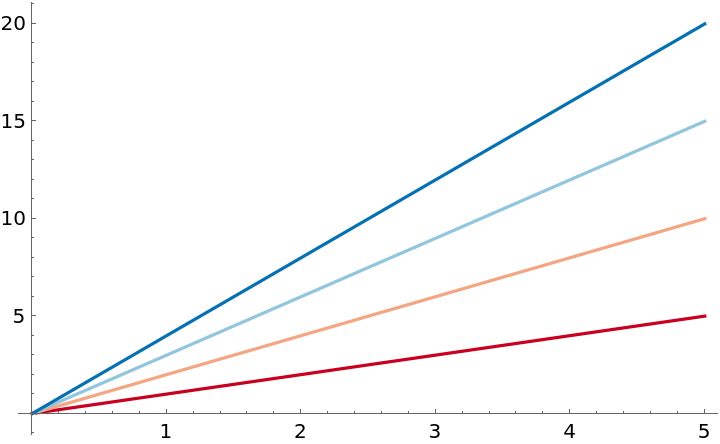 |
Use a ColorBrewer scheme for a contour plot:
| In[7]:= |
| Out[7]= | 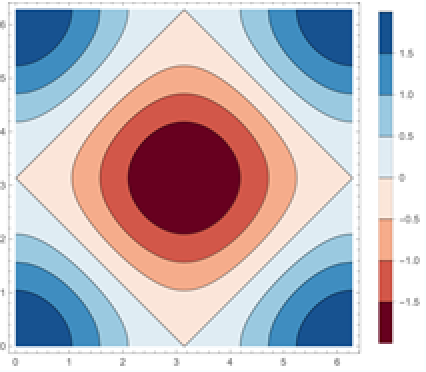 |
Unknown color schemes return $Failed:
| In[8]:= |
| Out[8]= |
For small n, the smallest color set is subsampled:
| In[9]:= |
| Out[9]= |
| In[10]:= |
| Out[10]= |
A color function based on a qualitative color scheme is possible, but not ideal:
| In[11]:= |
| Out[11]= | 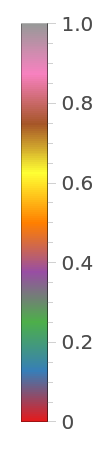 |
Interpolating a qualitative color scheme is possible, but not ideal:
| In[12]:= |
| Out[12]= |
Show all ColorBrewer categories and color schemes:
| In[13]:= | ![(* Evaluate this cell to get the example input *) CloudGet["https://www.wolframcloud.com/obj/085930c3-2d79-4946-8b5f-676d0c8a3436"]](https://www.wolframcloud.com/obj/resourcesystem/images/89f/89f811af-688d-4e18-9f8c-4f992661bb4b/5fed6534683d770c.png) |
| Out[13]= | 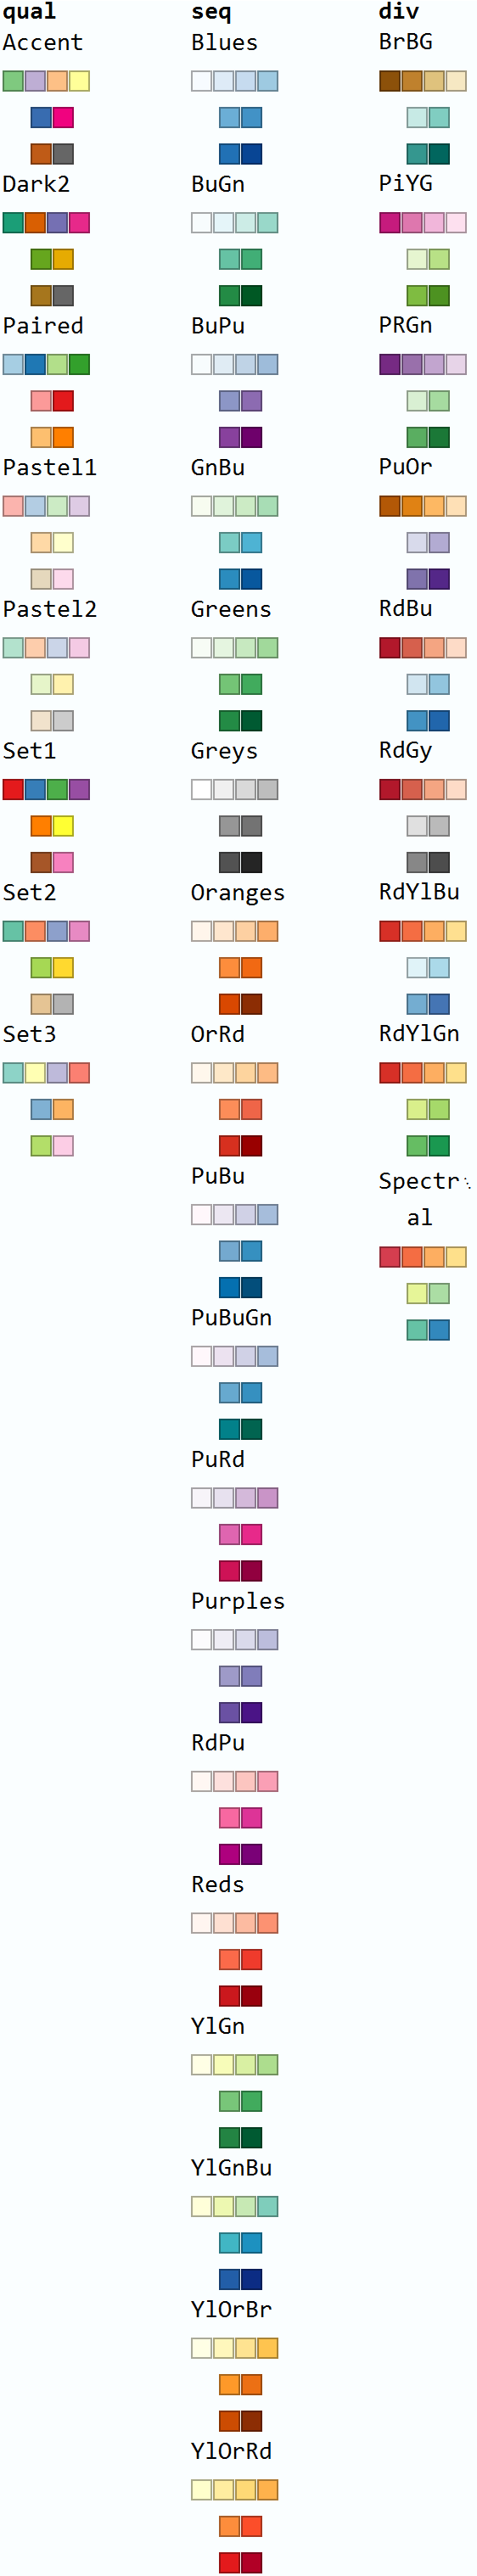 |
This work is licensed under a Creative Commons Attribution 4.0 International License