Wolfram Function Repository
Instant-use add-on functions for the Wolfram Language
Function Repository Resource:
A cellular automata method for creating cartograms
ResourceFunction["CellularAutomataCartogram"][loc→val] attempts to equalize the density of val over an area by adjusting the boundaries of loc. | |
ResourceFunction["CellularAutomataCartogram"][{loc1→val1,loc2→val2,…}] attempts to equalize the density of vali over an area by adjusting the boundaries of loci. |
Use a small RasterSize to reduce the number of pixels and thus speed up the calculation. Check the initial state:
| In[1]:= | ![ResourceFunction[
"CellularAutomataCartogram"][{Polygon[{{-10, -10}, {-10, 10}, {0, 10}, {0, -10}}] -> 1, Polygon[{{0, -10}, {0, 10}, {10, 10}, {10, -10}}] -> 1.1}, RasterSize -> 50, MaxIterations -> 0]](https://www.wolframcloud.com/obj/resourcesystem/images/5e7/5e7476be-4cce-406b-885c-fda1819b88e8/72cf8858d833cd78.png) |
| Out[1]= |  |
Equalize the density:
| In[2]:= | ![res = ResourceFunction[
"CellularAutomataCartogram"][{Polygon[{{-10, -10}, {-10, 10}, {0, 10}, {0, -10}}] -> 1, Polygon[{{0, -10}, {0, 10}, {10, 10}, {10, -10}}] -> 1.1}, RasterSize -> 50]](https://www.wolframcloud.com/obj/resourcesystem/images/5e7/5e7476be-4cce-406b-885c-fda1819b88e8/66ee9d76ae98d338.png) |
| Out[2]= |  |
Check the result:
| In[3]:= |
| Out[3]= |
| In[4]:= |
| Out[4]= |
Here is the same example in a colorized version:
| In[5]:= | ![res = ResourceFunction[
"CellularAutomataCartogram"][{Polygon[{{-10, -10}, {-10, 10}, {0, 10}, {0, -10}}] -> 1, Polygon[{{0, -10}, {0, 10}, {10, 10}, {10, -10}}] -> 1.1}, ColorFunction -> "Rainbow", RasterSize -> 50]](https://www.wolframcloud.com/obj/resourcesystem/images/5e7/5e7476be-4cce-406b-885c-fda1819b88e8/482c81660176bde6.png) |
| Out[5]= |  |
Adjust the administrative division boundaries of the UK to equalize population density:
| In[6]:= | ![UKadd1 = EntityList[
Entity["AdministrativeDivision", {EntityProperty[
"AdministrativeDivision", "ParentRegion"] -> Entity["Country", "UnitedKingdom"]}]];](https://www.wolframcloud.com/obj/resourcesystem/images/5e7/5e7476be-4cce-406b-885c-fda1819b88e8/54fe2f648bc3c067.png) |
| In[7]:= | ![UKadd2 = Flatten[EntityList[
Entity["AdministrativeDivision", {EntityProperty[
"AdministrativeDivision", "ParentRegion"] -> #}]] & /@ UKadd1];](https://www.wolframcloud.com/obj/resourcesystem/images/5e7/5e7476be-4cce-406b-885c-fda1819b88e8/251893acd184c6de.png) |
Initial state:
| In[8]:= |
| Out[8]= | 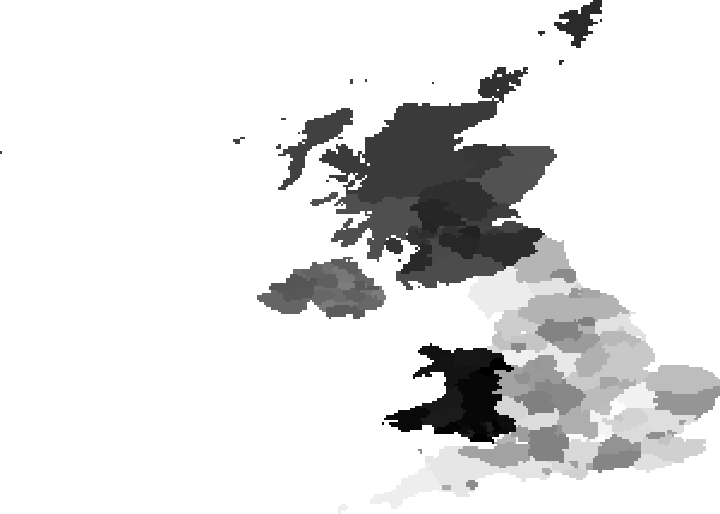 |
Final state after population density adaptation:
| In[9]:= |
| Out[9]= | 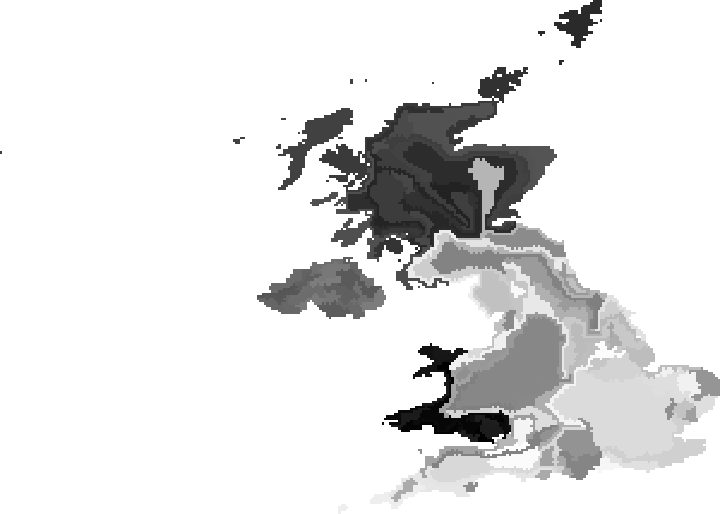 |
Adjust the size of the image, which affects rasterization and thus the final result:
| In[10]:= | ![ResourceFunction[
"CellularAutomataCartogram"][{Polygon[{{-10, -10}, {-10, 10}, {0, 10}, {0, -10}}] -> 1, Polygon[{{0, -10}, {0, 10}, {10, 10}, {10, -10}}] -> 1.1}, ImageSize -> 100]](https://www.wolframcloud.com/obj/resourcesystem/images/5e7/5e7476be-4cce-406b-885c-fda1819b88e8/15e3ebf12b1a63ce.png) |
| Out[10]= |  |
Adjust the raster size of the image, which affects the final result:
| In[11]:= | ![ResourceFunction[
"CellularAutomataCartogram"][{Polygon[{{-10, -10}, {-10, 10}, {0, 10}, {0, -10}}] -> 1, Polygon[{{0, -10}, {0, 10}, {10, 10}, {10, -10}}] -> 1.1}, RasterSize -> 100]](https://www.wolframcloud.com/obj/resourcesystem/images/5e7/5e7476be-4cce-406b-885c-fda1819b88e8/2d5c3e9688e8c194.png) |
| Out[11]= |  |
The initial state is the zeroth iteration:
| In[12]:= | ![ResourceFunction[
"CellularAutomataCartogram"][{Polygon[{{-10, -10}, {-10, 10}, {0, 10}, {0, -10}}] -> 1, Polygon[{{0, -10}, {0, 10}, {10, 10}, {10, -10}}] -> 1.1}, MaxIterations -> 0]](https://www.wolframcloud.com/obj/resourcesystem/images/5e7/5e7476be-4cce-406b-885c-fda1819b88e8/7958e1435bbee6e8.png) |
| Out[12]= |  |
The Gini coefficient is a measure of statistical dispersion. A Gini coefficient of zero expresses perfect equality, where all values are the same. A Gini coefficient of 1 expresses maximal inequality among values. The Gini coefficient is calculated each 100th iteration:
| In[13]:= | ![ResourceFunction[
"CellularAutomataCartogram"][{Polygon[{{-10, -10}, {-10, 10}, {0, 10}, {0, -10}}] -> 1, Polygon[{{0, -10}, {0, 10}, {10, 10}, {10, -10}}] -> 1.1}, RasterSize -> 100, "TrackGini" -> True]](https://www.wolframcloud.com/obj/resourcesystem/images/5e7/5e7476be-4cce-406b-885c-fda1819b88e8/215bf6d9eb2e7a43.png) |
| Out[13]= |  |
This work is licensed under a Creative Commons Attribution 4.0 International License