Wolfram Function Repository
Instant-use add-on functions for the Wolfram Language
Function Repository Resource:
Create a non-overlapping cartogram type with visual equalization, partial topology preservation and no shape preservation
ResourceFunction["DorlingCartogram"][loc→val] generates a graphic of non-overlapping circles for initial locations loc with areas corresponding to val. | |
ResourceFunction["DorlingCartogram"][{loc1→val1 ,loc2→val2,…}] generates a graphic of non-overlapping circles with initial locations loci with areas corresponding to vali. | |
ResourceFunction["DorlingCartogram"][spec,n] generates a graphic of non-overlapping regular n-sided polygons with initial locations and values as given by spec. |
Define an example dataset of random values:
| In[1]:= |
Create a cartogram with circles:
| In[2]:= |
| Out[2]= |  |
Create a cartogram for the 250 most populous cities in the United States:
| In[3]:= | ![ResourceFunction["DorlingCartogram"][
EntityValue[
EntityClass[
"City", {"Country" -> Entity["Country", "UnitedStates"], "Population" -> TakeLargest[100]}], "Entities"] -> "Population"]](https://www.wolframcloud.com/obj/resourcesystem/images/0ae/0aefb6c3-e358-401f-9b61-05cc612fe40c/7ef650bd7b3b4516.png) |
| Out[3]= |  |
Create a non-overlapping cartogram for the 250 most populous cities in the United Kingdom:
| In[4]:= | ![ResourceFunction["DorlingCartogram"][
EntityValue[
EntityClass[
"City", {"Country" -> Entity["Country", "UnitedKingdom"], "Population" -> TakeLargest[250]}], "Entities"] -> "Population", ColorFunction -> "Aquamarine"]](https://www.wolframcloud.com/obj/resourcesystem/images/0ae/0aefb6c3-e358-401f-9b61-05cc612fe40c/1b76c4d57f4cdb3a.png) |
| Out[4]= | 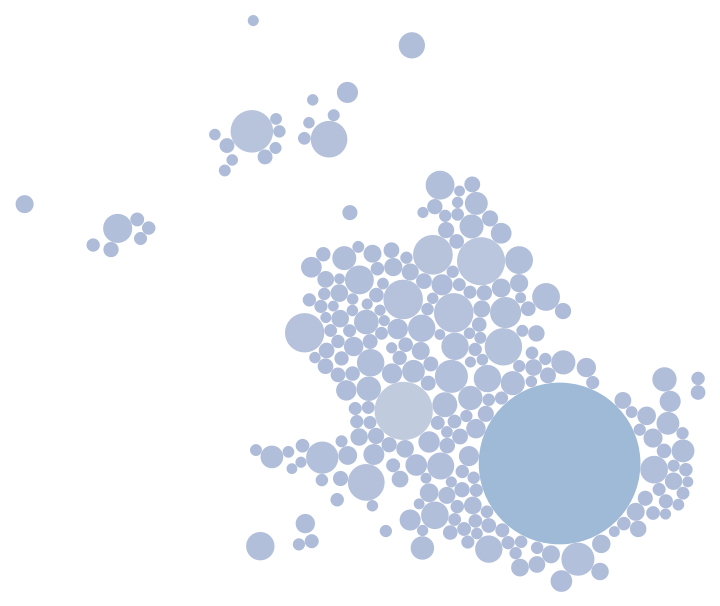 |
Create a non-overlapping cartogram for the level-2 administrative division in the United Kingdom:
| In[5]:= | ![UKadd1 = EntityList[
Entity["AdministrativeDivision", {EntityProperty[
"AdministrativeDivision", "ParentRegion"] -> Entity["Country", "UnitedKingdom"]}]];](https://www.wolframcloud.com/obj/resourcesystem/images/0ae/0aefb6c3-e358-401f-9b61-05cc612fe40c/2e0420ed43fc7817.png) |
| In[6]:= | ![UKadd2 = Flatten[EntityList[
Entity["AdministrativeDivision", {EntityProperty[
"AdministrativeDivision", "ParentRegion"] -> #}]] & /@ UKadd1];](https://www.wolframcloud.com/obj/resourcesystem/images/0ae/0aefb6c3-e358-401f-9b61-05cc612fe40c/44e1361ea541b7fa.png) |
| In[7]:= |
| Out[7]= | 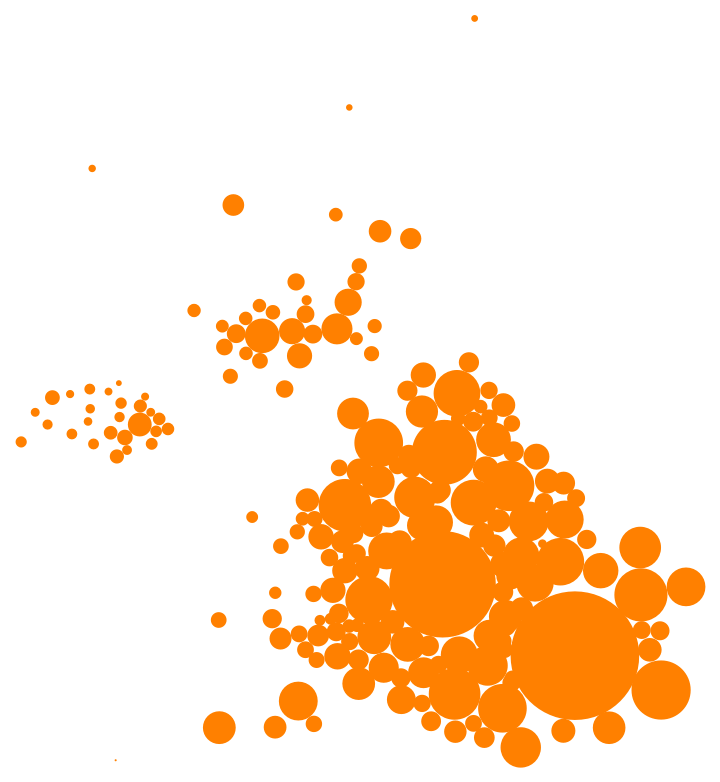 |
Create a cartogram for the 250 most populous cities in India:
| In[8]:= | ![ResourceFunction["DorlingCartogram"][
EntityValue[
EntityClass[
"City", {"Country" -> Entity["Country", "India"], "Population" -> TakeLargest[250]}], "Entities"] -> "Population", "Square", ColorFunction -> "Rainbow"]](https://www.wolframcloud.com/obj/resourcesystem/images/0ae/0aefb6c3-e358-401f-9b61-05cc612fe40c/077018ec0f40f52b.png) |
| Out[8]= | 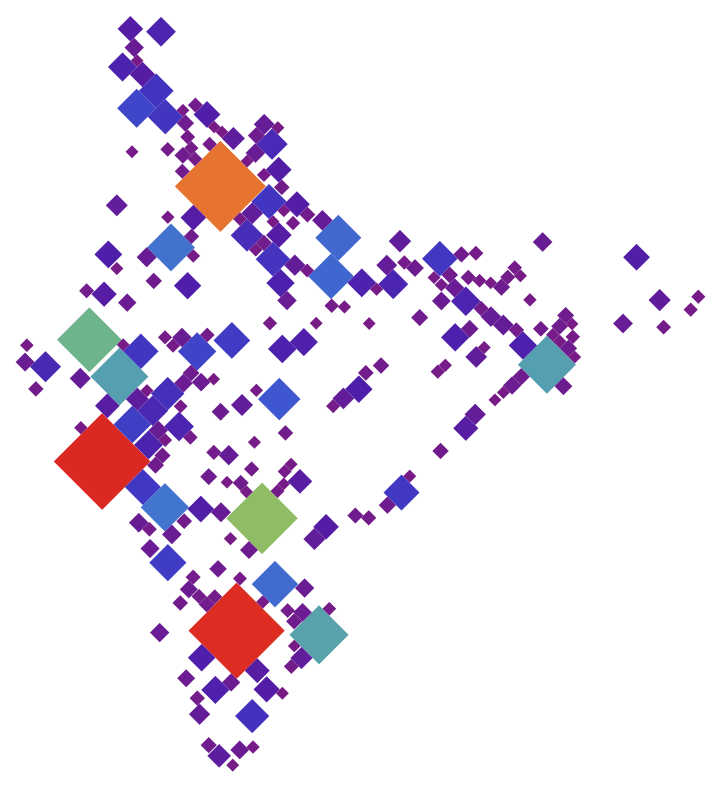 |
Create a cartogram for the 250 most populous cities in Poland:
| In[9]:= | ![ResourceFunction["DorlingCartogram"][
EntityValue[
EntityClass[
"City", {"Country" -> Entity["Country", "Poland"], "Population" -> TakeLargest[250]}], "Entities"] -> "Population", 5, ColorFunction -> Function[{z}, Hue[Log[z]]], ColorFunctionScaling -> False]](https://www.wolframcloud.com/obj/resourcesystem/images/0ae/0aefb6c3-e358-401f-9b61-05cc612fe40c/24276defe88c8feb.png) |
| Out[9]= | 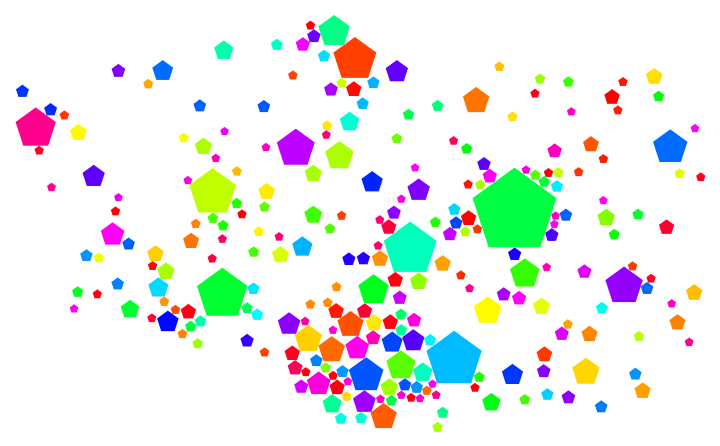 |
Define an example dataset:
| In[10]:= |
The default method "FixedStepSize" employs a step size on the magnitude of scale, which enables a quick calculation of many iterations:
| In[11]:= |
| Out[11]= |  |
The default of the maximum number of potential iterations is coupled to the method. The computation can finish earlier if no shapes overlap anymore.
Define an example dataset:
| In[12]:= |
MaxIterations→0 returns the initial configuration:
| In[13]:= |
| Out[13]= |  |
Supported methods are "FixedStepSize" and "AdjustedStepSize".
Define an example dataset:
| In[14]:= |
The default method "FixedStepSize" employs a step size on the magnitude of scale, which enables a quick calculation of many iterations:
| In[15]:= |
| Out[15]= |  |
In the "AdjustedStepSize" method, the step size is adjusted after each step, which leads to good visual results after just a few iterations, but often slows overall convergence:
| In[16]:= |
| Out[16]= |  |
Define an example dataset:
| In[17]:= |
Rotate the regular triangle shape by 30 degrees counterclockwise:
| In[18]:= |
| Out[18]= |  |
Define an example dataset:
| In[19]:= |
The default scale is determined such that approximately a quarter of the available space is filled:
| In[20]:= |
| Out[20]= |  |
Use a custom scale:
| In[21]:= |
| Out[21]= |  |
This work is licensed under a Creative Commons Attribution 4.0 International License