Function Repository Resource:

BioMoleculeFluctuationPlot3D

Source Notebook

Show the fluctuations of residues in a biomolecule

Contributed by: Soutick Saha

ResourceFunction["BioMoleculeFluctuationPlot3D"][biomol]

shows the fluctuations of the residues in a biomolecule biomol.

Details and Options

BioMoleculeFluctuationPlot3D is based on Bahar, Ivet, et al. "Vibrational dynamics of folded proteins: significance of slow and fast motions in relation to function and stability." Physical review letters 80.12 (1998): 2733.
Fluctuations represents the overall flexibility of specific regions of a protein.
Fluctuations are calculated using the resource function BioMoleculeResidueFluctuations.
The backbone atom for amino acids is Cα and for nucleic acids is O3'.
The biomol can be ExternalIdentifier or a String.
ExternalIdentifier can take "PDBStructureID" or "UniProtKBAccessionNumber" as "Type".
The String can be a file name, URL or a four letter PDB ID.
BioMoleculeFluctuationPlot3D can take all options of ResourceFunction["BioMoleculeResidueFluctuations"] and BiomoleculePlot3D and the following Options:
"Modes"{2}modes of fluctuations
ColorFunctionAutomaticways to color biomolecule residues
PlotLegendsAutomaticlegends for biomolecule structure
The option "Modes" accepts a list of modes for which the cumulative fluctuations can be visualized in the structure. It corresponds to slow (small values) and fast mode (large values). The slowest mode with interesting fluctuations is always 2.

Examples

Basic Examples (1) 

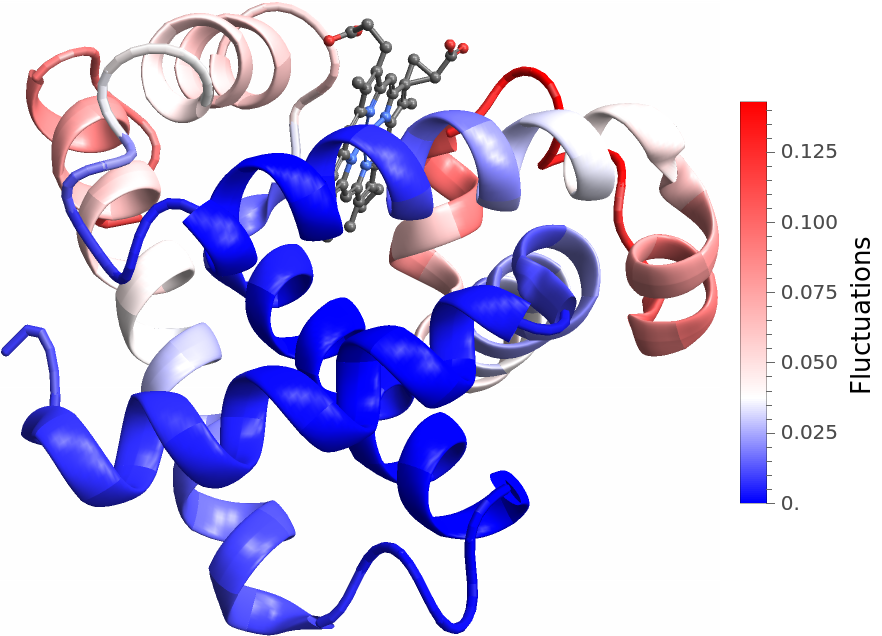
Visualize the fluctuations in myoglobin:

In[1]:=
ResourceFunction["BioMoleculeFluctuationPlot3D"][
 ExternalIdentifier["PDBStructureID", "1MBN"]]
Out[1]=

Scope (1) 

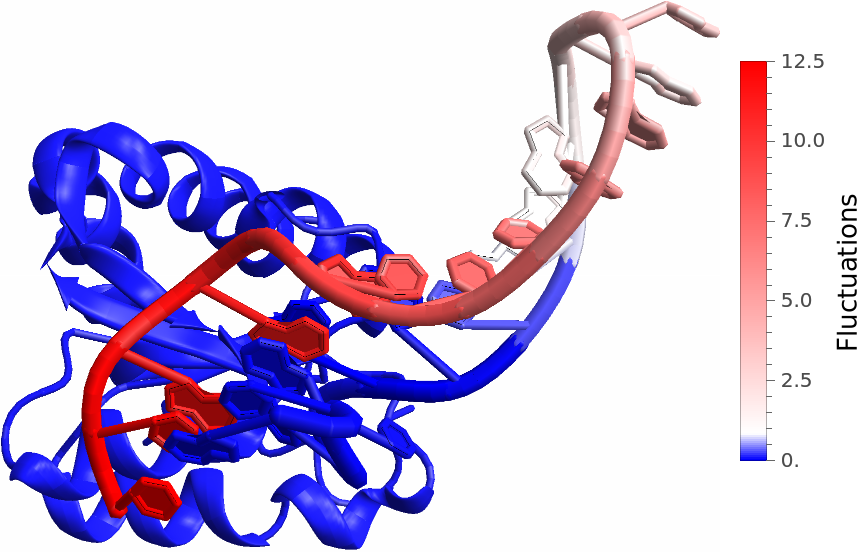
Visualize the fluctuations in a RNA-protein complex:

In[2]:=
ResourceFunction["BioMoleculeFluctuationPlot3D"][
 ExternalIdentifier["PDBStructureID", "6TPH"]]
Out[2]=

Options (5) 

Modes (2) 

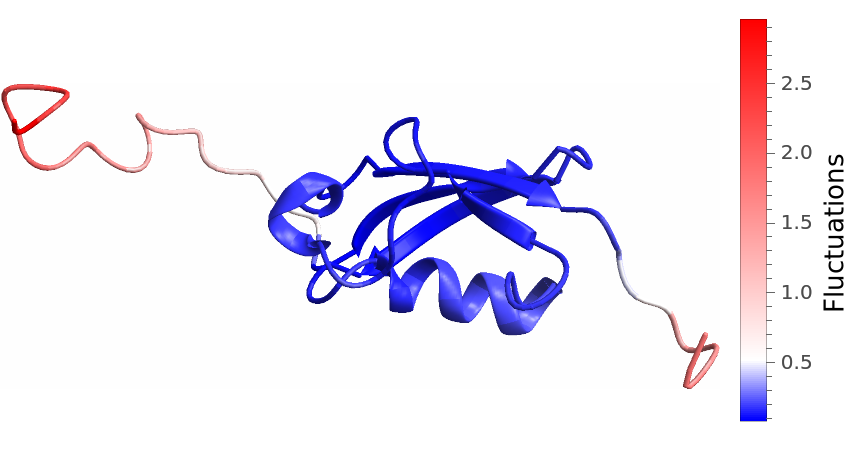
Visualize the fluctuations in a protein with intrinsically disordered regions in slowest 6 modes:

In[3]:=
ResourceFunction["BioMoleculeFluctuationPlot3D"]["1A5R", "Modes" -> {2, 3, 4, 5, 6, 7}]
Out[3]=

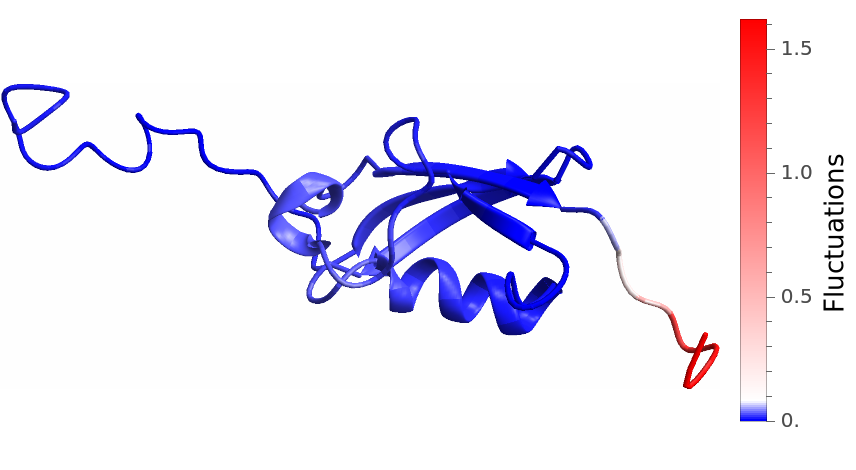
And just in the 3rd mode:

In[4]:=
ResourceFunction["BioMoleculeFluctuationPlot3D"]["1A5R", "Modes" -> {3}]
Out[4]=

ColorFunction (2) 

Visualize the fluctuations in a protein with custom ColorFunction:

In[5]:=
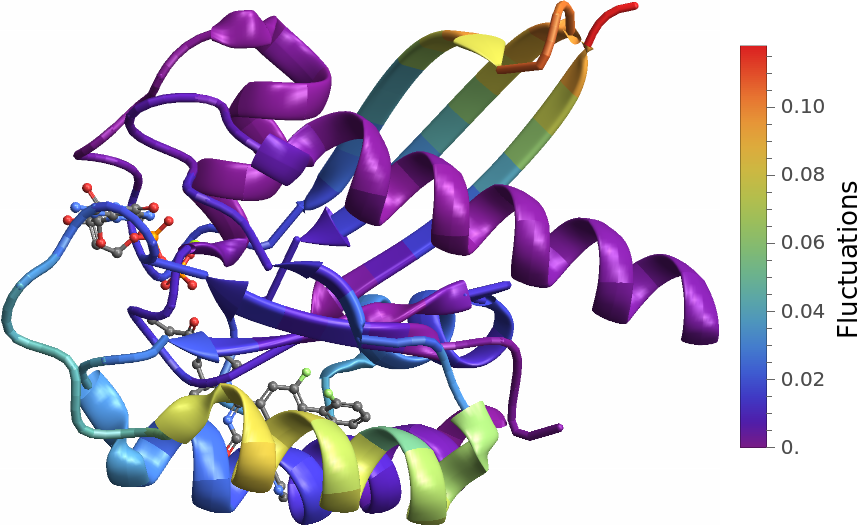
ResourceFunction["BioMoleculeFluctuationPlot3D"]["6OIM", ColorFunction -> "Rainbow"]
Out[5]=

In[6]:=
ResourceFunction["BioMoleculeFluctuationPlot3D"]["1CRN", ColorFunction -> (Blend[{{0, RGBColor[0.5, 0, 0.5]}, {0.12, RGBColor[
       0.3333333333333333, 0.6679738562091503, 0.6679738562091503]}}, #] &)]
Out[6]=

PlotLegends (1) 

Visualize the fluctuations in green fluorescent protein (GFP) without the color-bar:

In[7]:=
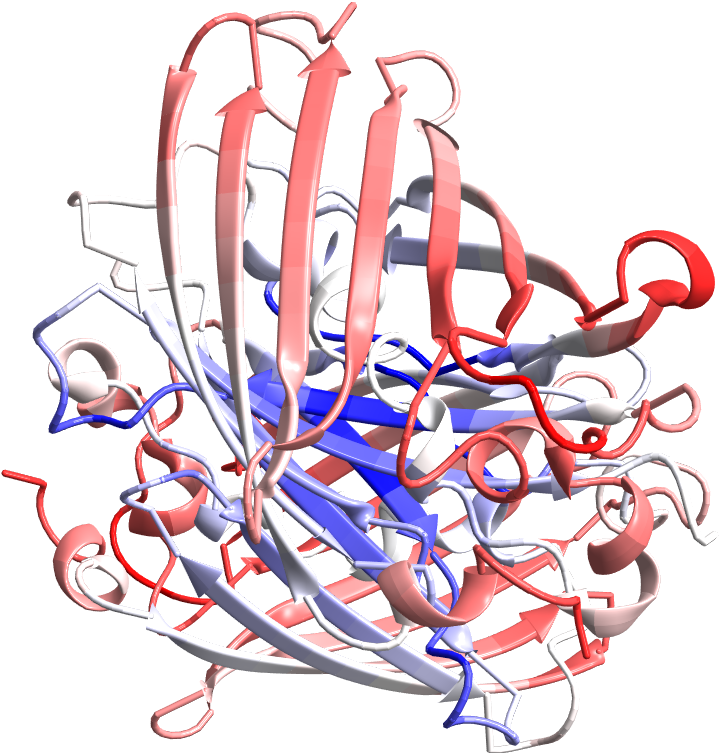
ResourceFunction["BioMoleculeFluctuationPlot3D"]["1GFL", PlotLegends -> None]
Out[7]=

Publisher

WolframChemistry

Requirements

Wolfram Language 14.0 (January 2024) or above

Version History

  • 1.0.0 – 25 October 2024

Source Metadata

Related Resources

License Information