Wolfram Function Repository
Instant-use add-on functions for the Wolfram Language
Function Repository Resource:
Get osmolality data for common beverages
ResourceFunction["BeverageOsmolality"][] gives a structured Dataset of osmolality values for 40 common beverages. | |
ResourceFunction["BeverageOsmolality"][bev] gives the osmolality value for a single specified beverage. | |
ResourceFunction["BeverageOsmolality"][{bev1,bev2, …}] gives the osmolality values for a list of specified beverages. | |
ResourceFunction["BeverageOsmolality"][prop] gives a list of all beverages in the dataset with the associated value for the specified property. |
| "Data" | data associations instead of a dataset |
| "OsmolalityRules" | osmolality values as a list of rules |
| "EntityRules" | beverage entities as a list of rules |
Retrieve the dataset:
| In[1]:= |
| Out[1]= | 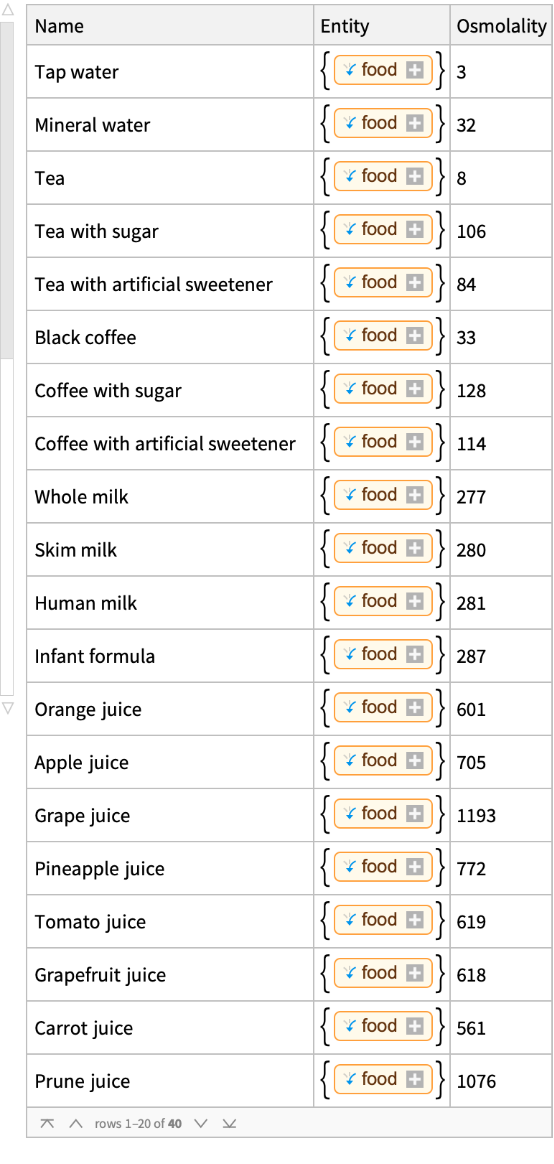 |
Retrieve the data as an Association for each beverage:
| In[2]:= |
| Out[2]= | 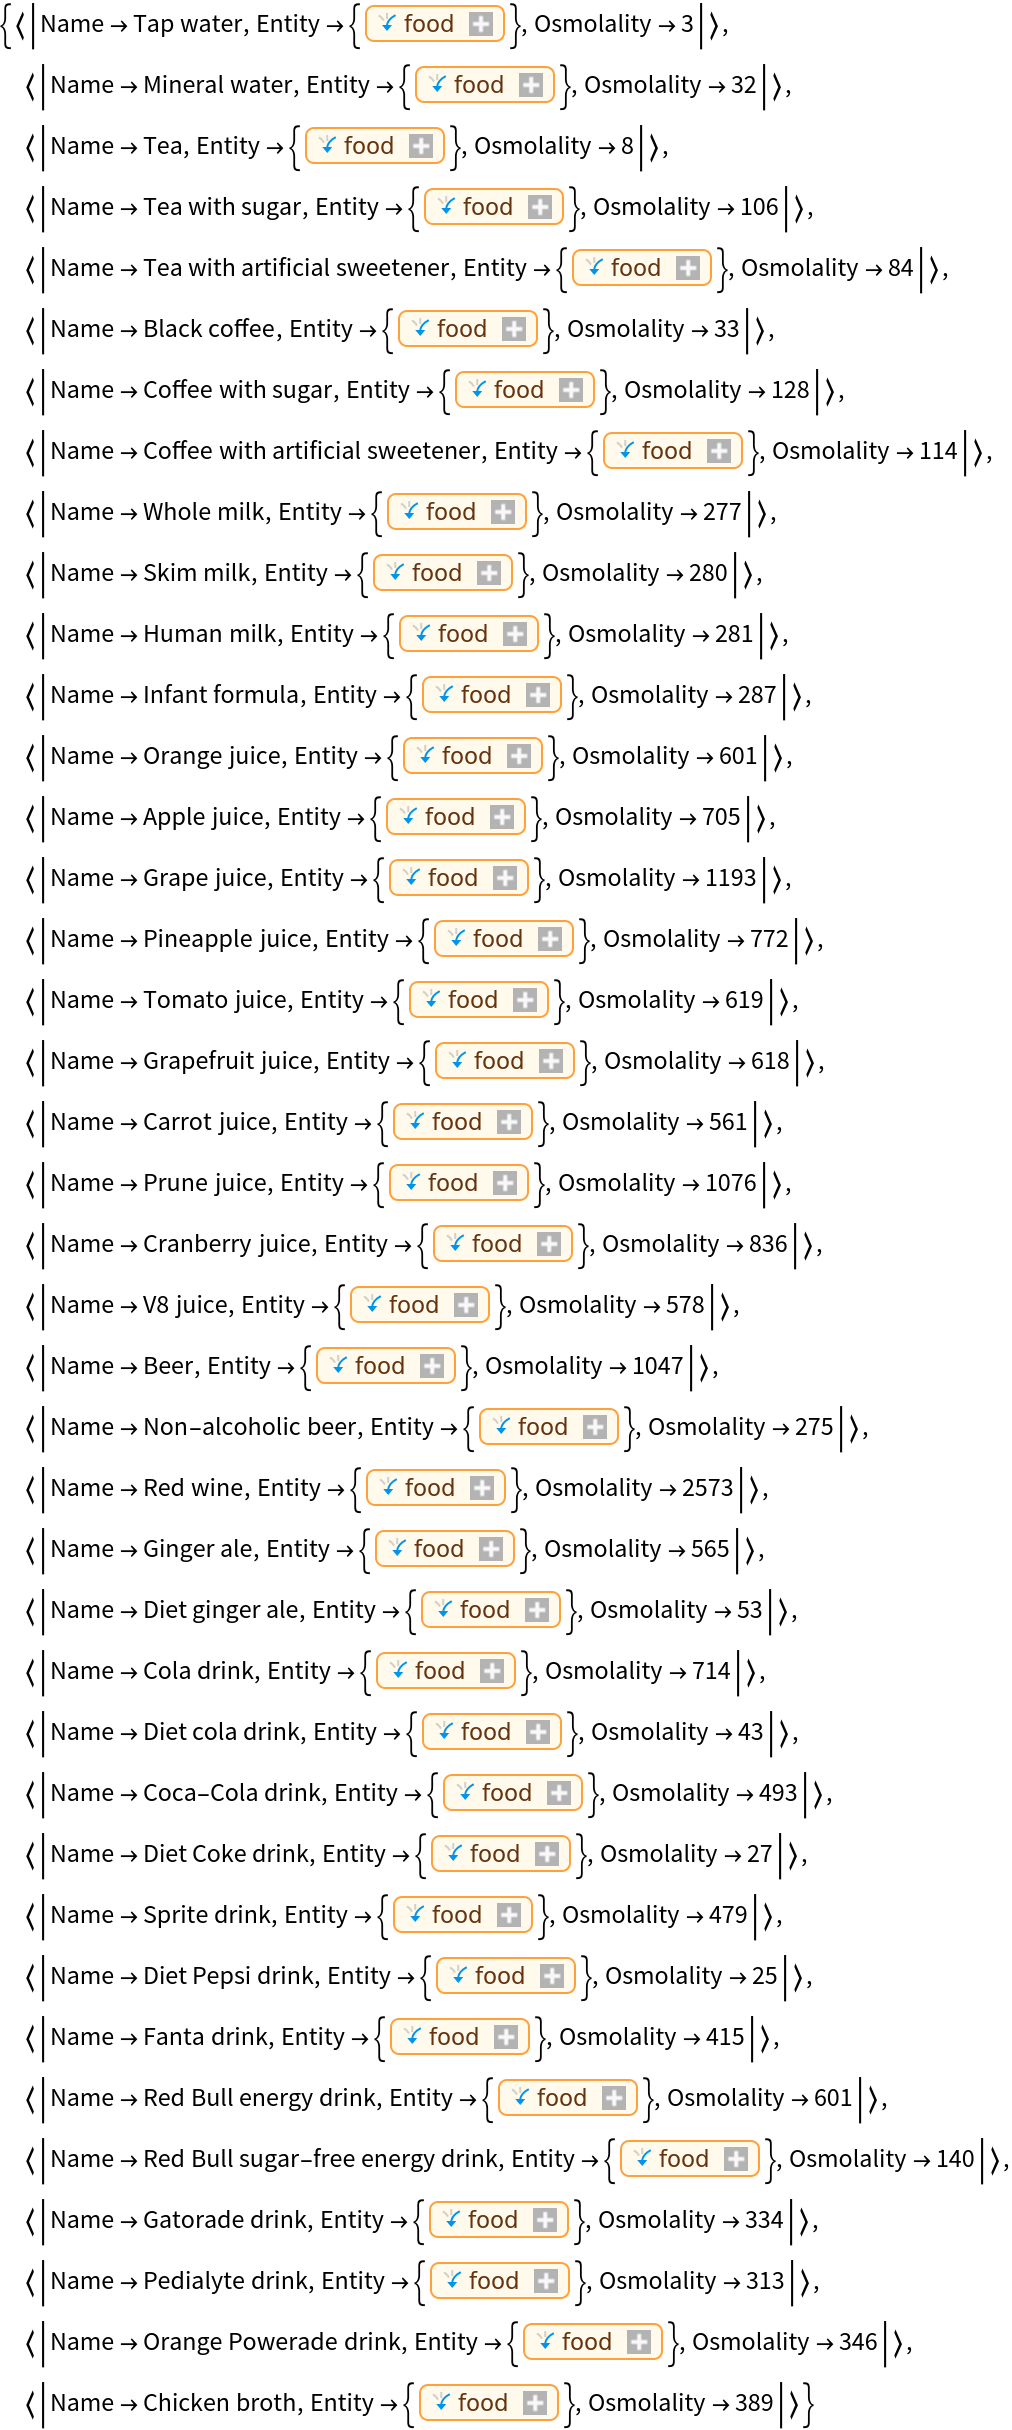 |
Retrieve the osmolality values for the full dataset as a list of rules:
| In[3]:= |
| Out[3]= |  |
Retrieve the entities for the full dataset as a list of rules:
| In[4]:= |
| Out[4]= | 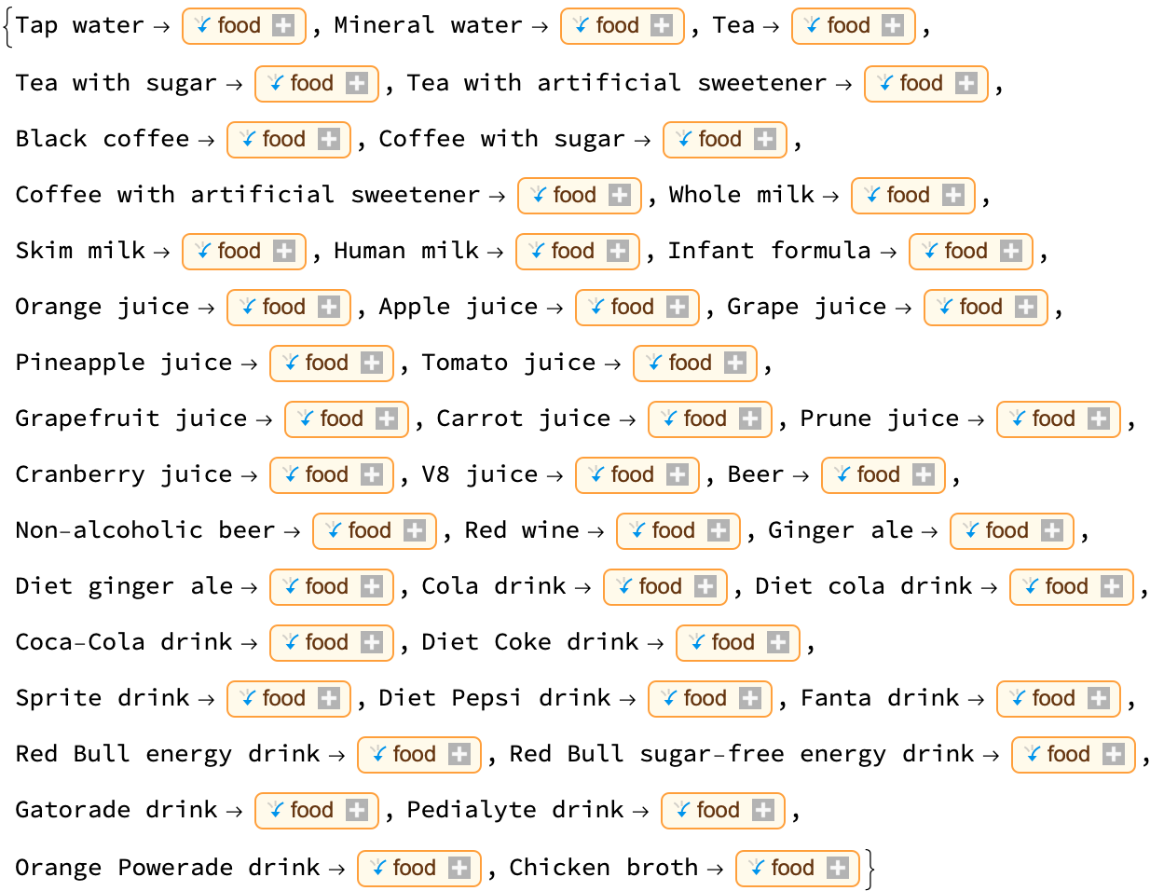 |
Retrieve one or more specific beverages as a dataset:
| In[5]:= |
| Out[5]= |  |
| In[6]:= |
| Out[6]= | 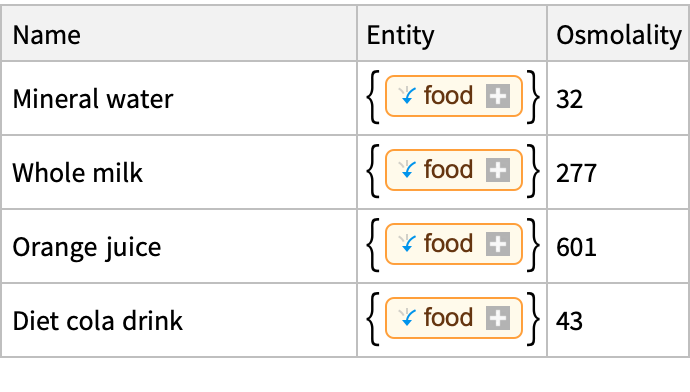 |
Analyze the osmolality values for the full dataset:
| In[7]:= | ![Through[{MinimalBy[#, Last] &, MaximalBy[#, Last] &}[
ResourceFunction["BeverageOsmolality"]["OsmolalityRules"]]]](https://www.wolframcloud.com/obj/resourcesystem/images/a01/a01c412a-bbce-4ef3-af6d-55ad76ad66f9/64ca561291aa02b9.png) |
| Out[7]= |
| In[8]:= | ![Thread[{"Mean", "Median", "StandardDeviation"} -> ({Mean[#], Median[#], StandardDeviation[#]} &@
Values[ResourceFunction["BeverageOsmolality"][
"OsmolalityRules"]]) // N]](https://www.wolframcloud.com/obj/resourcesystem/images/a01/a01c412a-bbce-4ef3-af6d-55ad76ad66f9/75c41eae74dc0c1b.png) |
| Out[8]= |
When specifying multiple beverages, a message in the Messages box will advise which beverage items are missing, and only the ones available in the dataset will display:
| In[9]:= |
| Out[9]= | 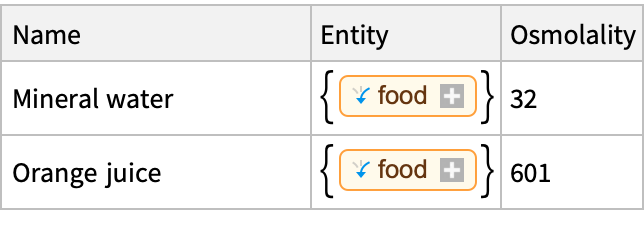 |
When specifying a single beverage, a message displays in the output and the Messages box when it is not available:
| In[10]:= |
| Out[10]= |
Plot the osmolality values for all beverages in the dataset:
| In[11]:= | ![osmolalityRulesAssoc = Association[
ResourceFunction["BeverageOsmolality"]["OsmolalityRules"]];
ListPlot[Tooltip[osmolalityRulesAssoc], Sequence[
AxesLabel -> "mOsm/kg", PlotStyle -> ColorData["HTML", "FireBrick"], PlotLabel -> "Beverage Osmolality in mOsm/kg", PlotRange -> {-100, 2800}, ImageSize -> 600]]](https://www.wolframcloud.com/obj/resourcesystem/images/a01/a01c412a-bbce-4ef3-af6d-55ad76ad66f9/617dd146c04c586b.png) |
| Out[12]= | 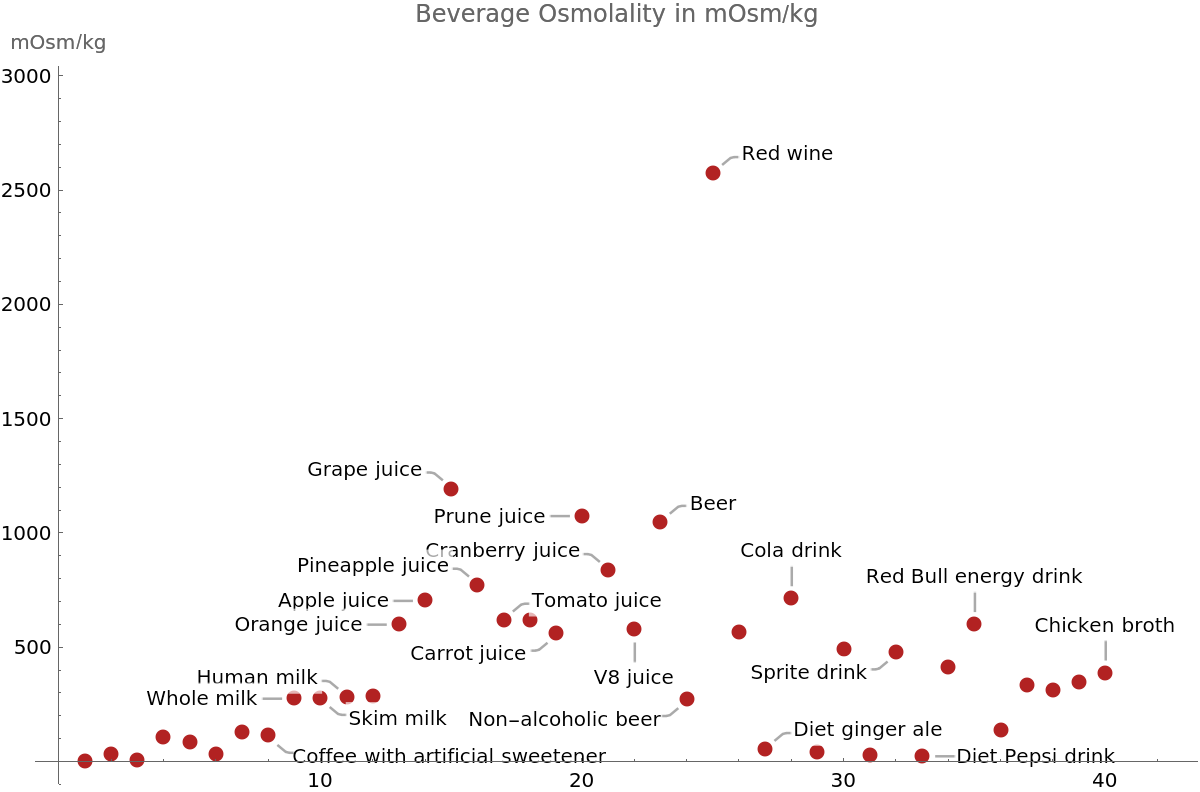 |
Compare osmolality to the sugar, potassium and calories of the top 10 hypertonic beverages:
| In[13]:= | ![top10Osmol = TakeLargest[osmolalityRulesAssoc, 10];
osmolChart = BarChart[
Sequence[
top10Osmol, ChartLabels -> Placed[Automatic, Below, Rotate[#, Pi/2]& ], AxesLabel -> "mOsm/kg", PlotLabel -> "Top 10 Hypertonic Beverages", ChartStyle -> ColorData["HTML", "FireBrick"]]];
entities = Lookup[ResourceFunction["BeverageOsmolality"]["EntityRules"], Keys@top10Osmol];
sugar = QuantityMagnitude[
EntityValue[#, "RelativeTotalSugarContent"] & /@ entities];
sugarChart = BarChart[
Sequence[sugar, ChartLabels -> Placed[
Keys[top10Osmol], Below, Rotate[#, Pi/2]& ], AxesLabel -> "g/g", ChartStyle -> ColorData["HTML", "CadetBlue"], PlotLabel -> "Sugar Content"]];
potassium = EntityValue[#, "RelativePotassiumContent"] & /@ entities;
potassiumChart = BarChart[
Sequence[potassium, ChartLabels -> Placed[
Keys[top10Osmol], Below, Rotate[#, Pi/2]& ], AxesLabel -> "mg/g", ChartStyle -> ColorData["HTML", "SteelBlue"], PlotLabel -> "Potassium Content"]];
calories = EntityValue[#, "RelativeTotalCaloriesContent"] & /@ entities;
caloriesChart = BarChart[
Sequence[calories, ChartLabels -> Placed[
Keys[top10Osmol], Below, Rotate[#, Pi/2]& ], AxesLabel -> "Cal/g", ChartStyle -> ColorData["HTML", "Tomato"], PlotLabel -> "Calories"]];
GraphicsRow[{osmolChart}, ImageSize -> 400]](https://www.wolframcloud.com/obj/resourcesystem/images/a01/a01c412a-bbce-4ef3-af6d-55ad76ad66f9/408d016c8f18d005.png) |
| Out[14]= | 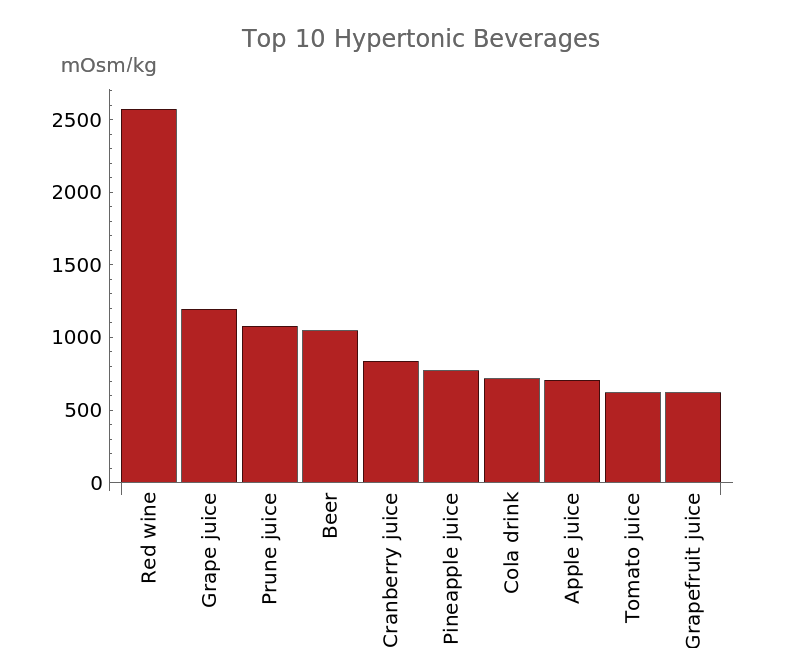 |
Now show the sugar, potassium and calorie charts associated to these beverages:
| In[15]:= |
| Out[15]= | 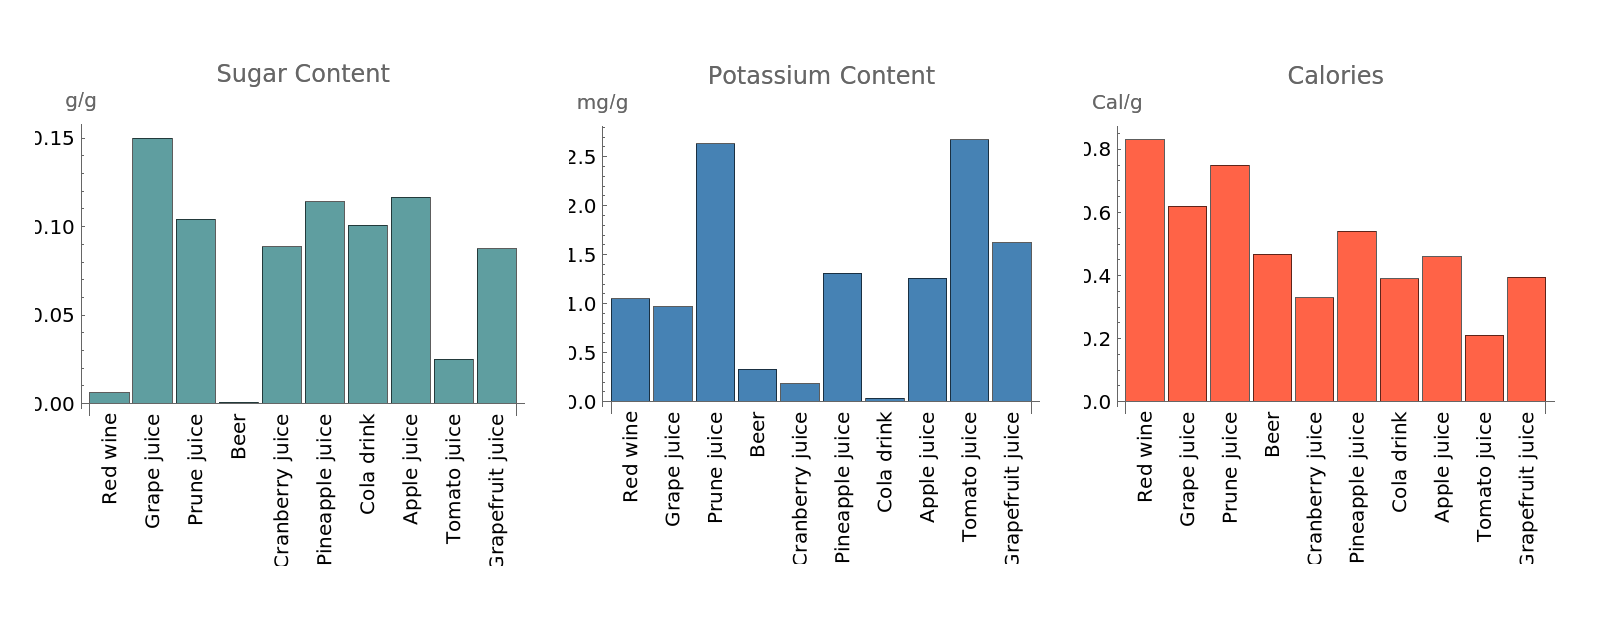 |
Wolfram Language 13.0 (December 2021) or above
This work is licensed under a Creative Commons Attribution 4.0 International License