Wolfram Function Repository
Instant-use add-on functions for the Wolfram Language
Function Repository Resource:
Add Matplotlib colormaps to ColorData
ResourceFunction["AddMatplotlibColors"][] adds Matplotlib colormaps for use with graphics primitives and functions. |
| Magma | |
| Inferno | |
| Plasma | |
| Viridis | |
| EricsRdBuGnYl | |
| EricsRdBuGnYl2 | |
| EricsPuBuGnYl | |
| FakeParula | |
| JoesBluGrnPnk2 |
Add Matplotlib colormaps:
| In[1]:= |
| Out[1]= |
Get the colormap by its name:
| In[2]:= |
| Out[2]= | 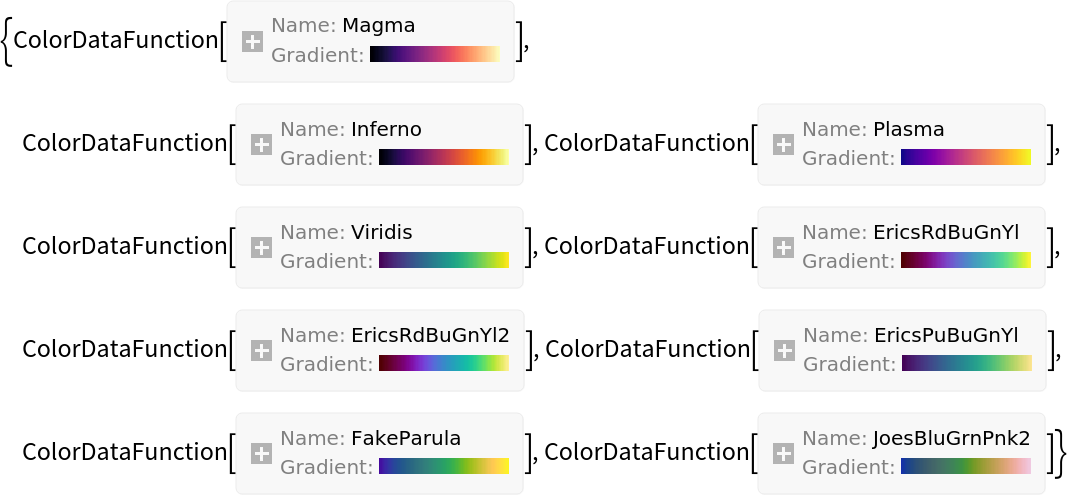 |
| In[3]:= | ![gradient[name_] := DensityPlot[x, {x, -1, 1}, {y, 0, 1}, FrameTicks -> None, AspectRatio -> 1/10, PlotRange -> All, ColorFunction -> name, PlotPoints -> 40, PlotRangePadding -> None, ImageSize -> 200]
gradient["Magma"]](https://www.wolframcloud.com/obj/resourcesystem/images/966/9661d7d5-0d18-4928-8380-648ee4e2e9c5/2dda6b503dbfe8c7.png) |
| Out[3]= |
Use them like the built-in color functions:
| In[4]:= |
| In[5]:= |
| Out[5]= | 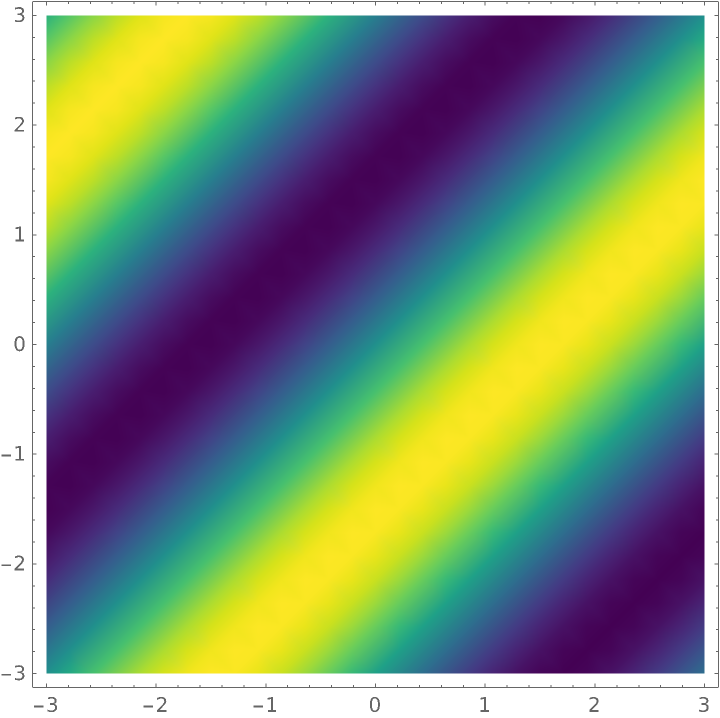 |
A gallery of colormaps:
| In[6]:= | ![showcolorfunction[name_] := With[{opts = {PlotRange -> All, ColorFunction -> name, PlotPoints -> 40, PlotRangePadding -> None, ImageSize -> 200}}, Column[{name, DensityPlot[
Cos[x] Sin[y], {x, -2 \[Pi], 2 \[Pi]}, {y, -\[Pi], \[Pi]}, FrameTicks -> None, AspectRatio -> 1/4, opts], DensityPlot[
10 Cos[x^2] Exp[y], {x, -2 \[Pi], 2 \[Pi]}, {y, -\[Pi], 0}, FrameTicks -> None, AspectRatio -> 1/2, opts], DensityPlot[x, {x, -1, 1}, {y, 0, 1}, FrameTicks -> {{None, None}, {Automatic, None}}, AspectRatio -> 1/10, opts]}, Center, 0]]
Grid@Partition[
showcolorfunction /@ ResourceFunction["AddMatplotlibColors"][], 3]](https://www.wolframcloud.com/obj/resourcesystem/images/966/9661d7d5-0d18-4928-8380-648ee4e2e9c5/4cab82156ea65c2e.png) |
| Out[6]= | 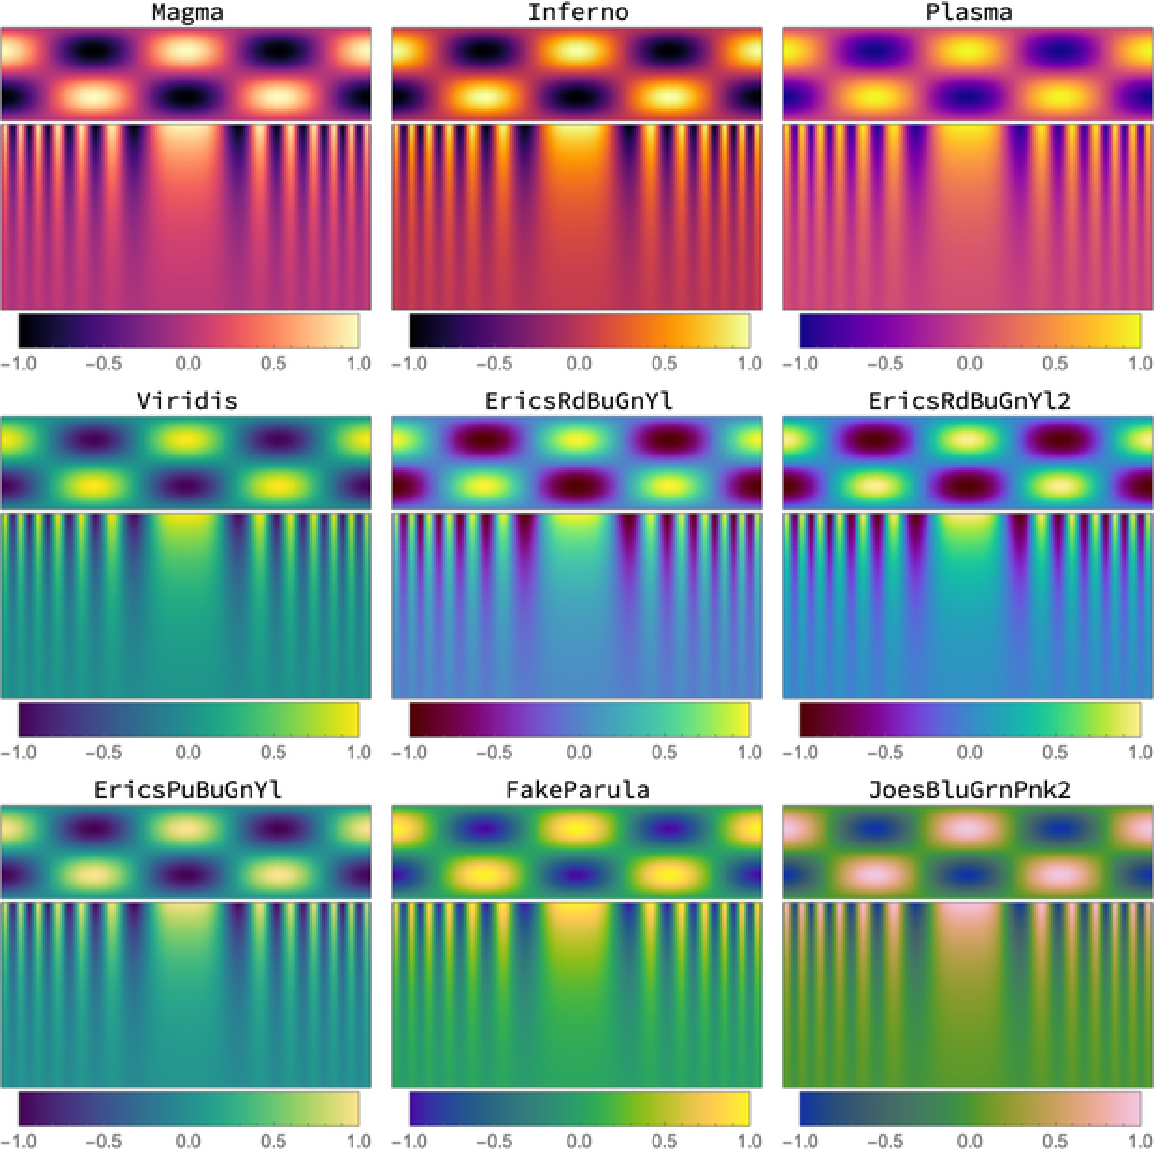 |
This work is licensed under a Creative Commons Attribution 4.0 International License