Wolfram Function Repository
Instant-use add-on functions for the Wolfram Language
Function Repository Resource:
Create a bubble chart from a list of points with the size of the bubbles corresponding to the count of points at each location
ResourceFunction["HistogramBubbleChart"][{{x1,y1}, {x2,y2}…}] makes a bubble chart with for 2D data with positions {xi,yi} with sizes based on the count of {xi,yi}. | |
ResourceFunction["HistogramBubbleChart"][data,bspec] makes a bubble chart with the sizes of bins specified by bspec. | |
ResourceFunction["HistogramBubbleChart"][data,bspec,hspec] makes a bubble chart with sizes of bins specified by bspec and the sizes of the bubbles specified by hspec. |
Create a histogram bubble chart for three values:
| In[1]:= |
| Out[1]= | 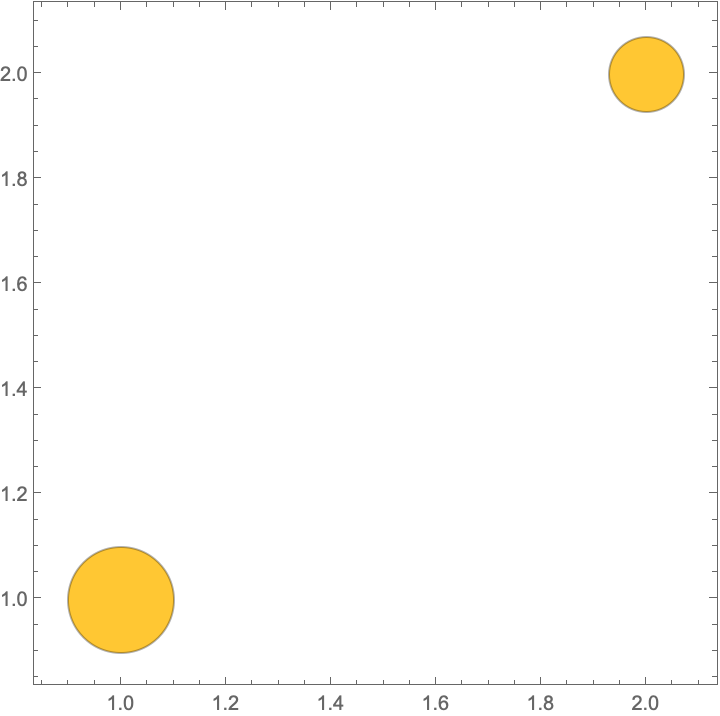 |
Useful for visualizing high density data:
| In[2]:= |
| Out[2]= | 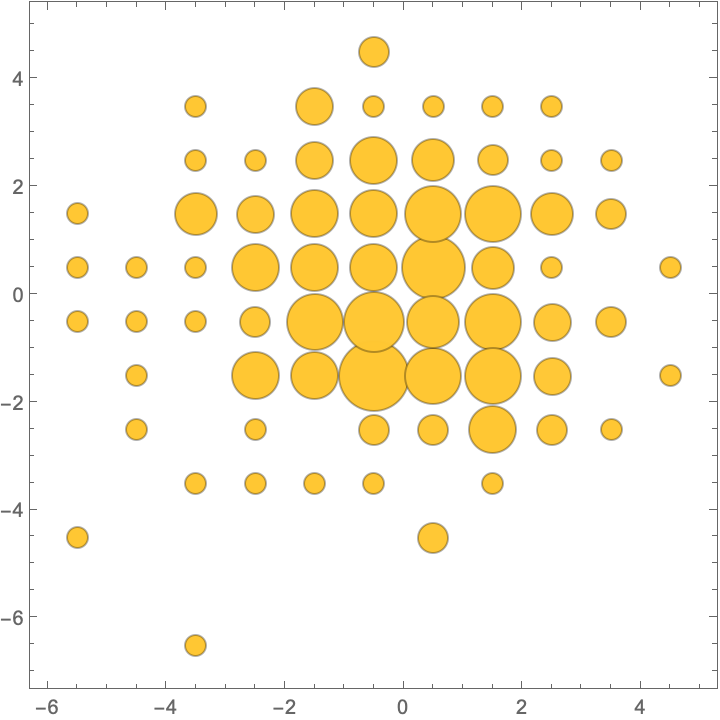 |
Compare two distributions:
| In[3]:= |
| Out[3]= | 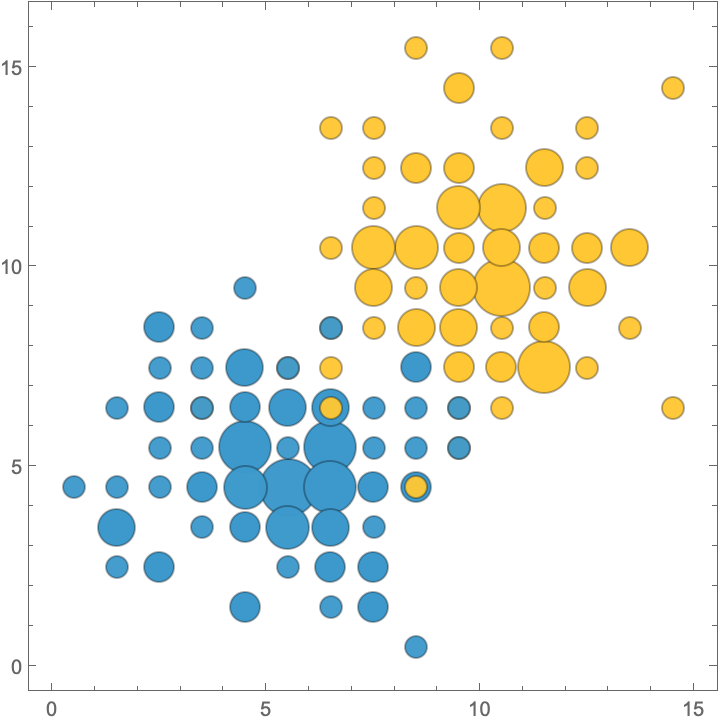 |
Give options to bubble chart:
| In[4]:= | ![ResourceFunction["HistogramBubbleChart"][
RandomVariate[NormalDistribution[0, 2], {200, 2}], {1}, ChartStyle -> LightBlue]](https://www.wolframcloud.com/obj/resourcesystem/images/8d4/8d4df5dd-d9b2-4192-9bf4-62e739064910/602089865b9d1914.png) |
| Out[4]= | 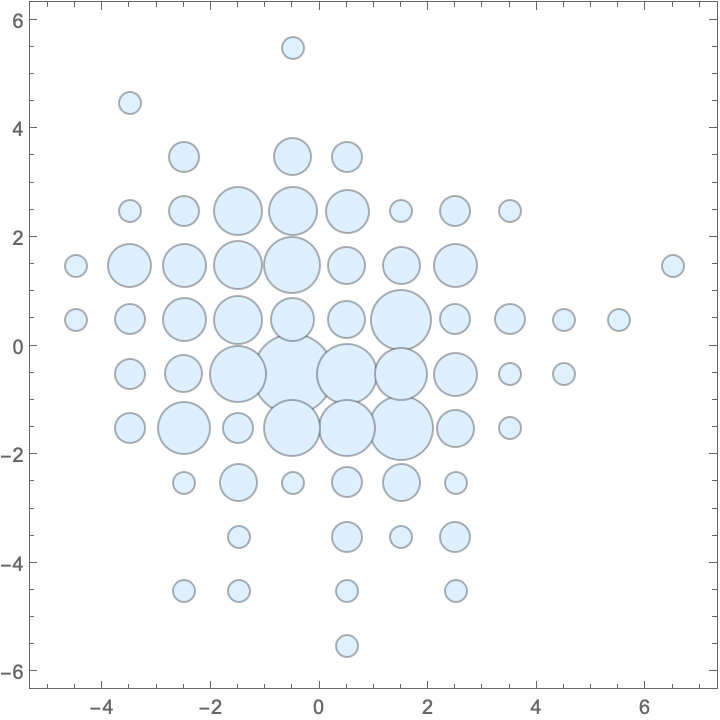 |
Specify the size function:
| In[5]:= | ![ResourceFunction["HistogramBubbleChart"][
RandomVariate[NormalDistribution[0, 2], {200, 2}], {2}, "CDF" , ChartStyle -> LightBlue]](https://www.wolframcloud.com/obj/resourcesystem/images/8d4/8d4df5dd-d9b2-4192-9bf4-62e739064910/24228776e883751c.png) |
| Out[5]= | 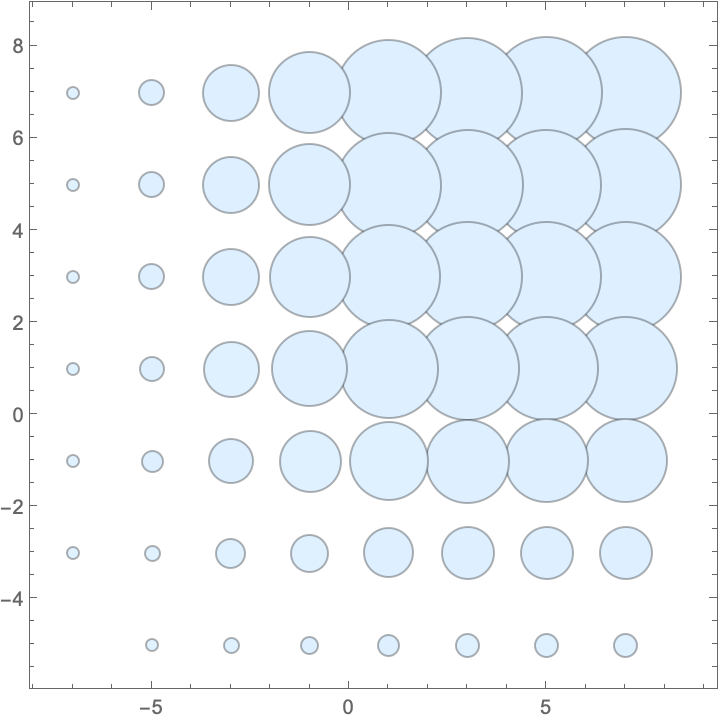 |
Works similarly to density histogram, but instead of colors corresponding to frequency it uses the size of the bubbles:
| In[6]:= | ![Table[#[RandomVariate[NormalDistribution[], {100, 2}], {1}, ChartElementFunction -> cf, ImageSize -> Small], {cf, {"Bubble", "FadingBubble", "MarkerBubble", "SphereBubble"}}] & /@ {DensityHistogram, ResourceFunction["HistogramBubbleChart"]}](https://www.wolframcloud.com/obj/resourcesystem/images/8d4/8d4df5dd-d9b2-4192-9bf4-62e739064910/244adff46d6204ac.png) |
| Out[6]= | 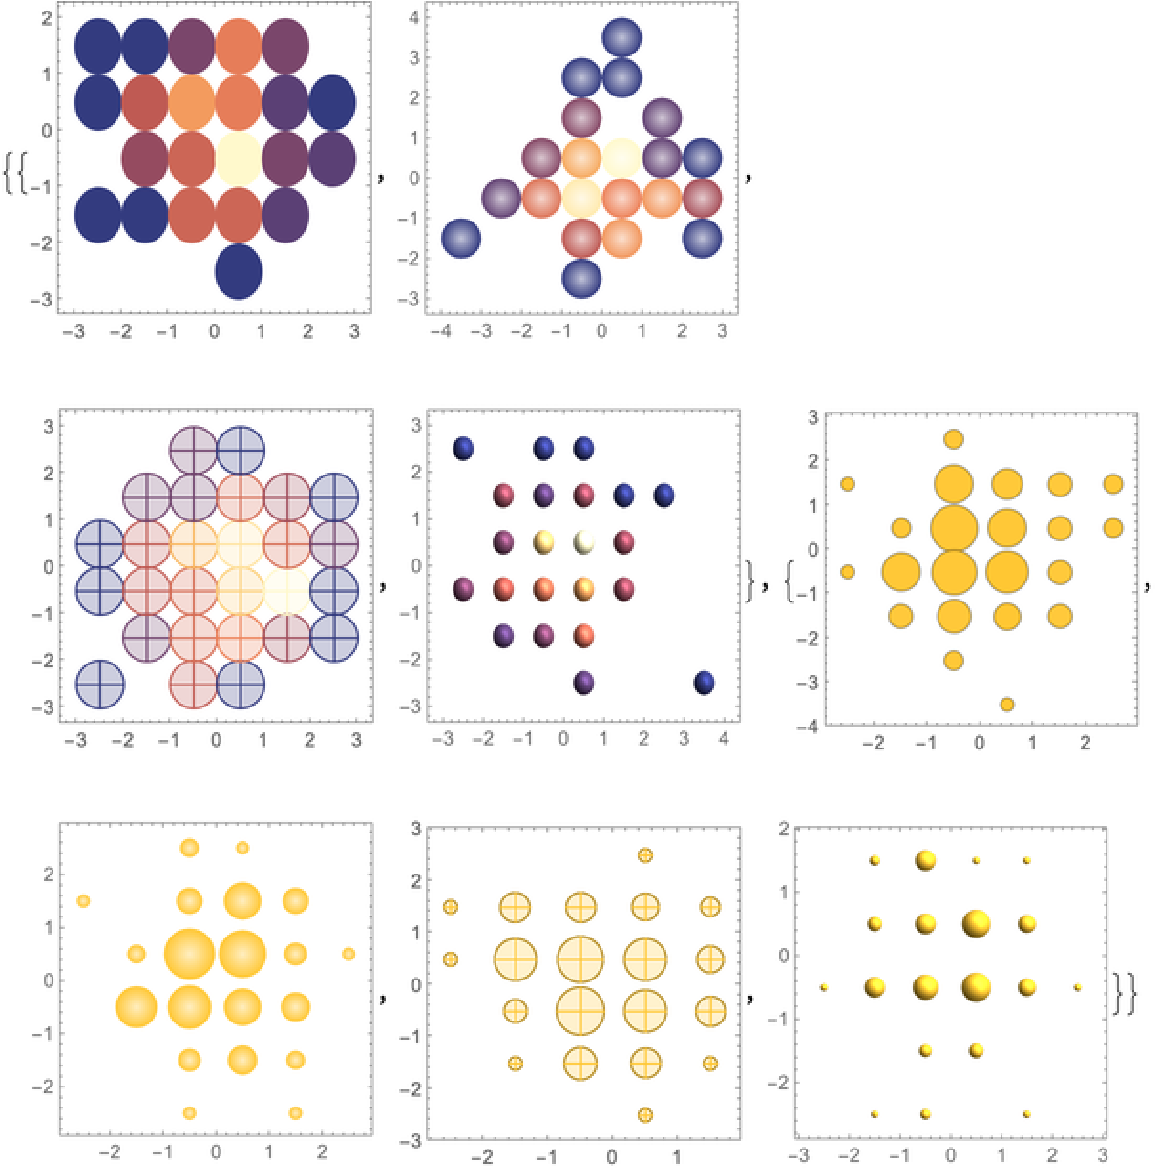 |
Wrappers are not permitted:
| In[7]:= |
| Out[7]= |
Wolfram Language 13.0 (December 2021) or above
This work is licensed under a Creative Commons Attribution 4.0 International License