Function Repository Resource:

ManipulatePlot

Source Notebook

Generate a plot in which the plot ranges and function parameters can be manipulated dynamically

Contributed by: Wolfram|Alpha Math Team

ResourceFunction["ManipulatePlot"][expr,{x,lo,hi},{a,min,max},]

returns a manipulable plot of expr on the domain loxhi with symbolic parameters varying on the given domains.

ResourceFunction["ManipulatePlot"][{expr1,expr2,},]

returns a manipulable plot of all of the expri.

Details and Options

ResourceFunction["ManipulatePlot"] has syntax that merges those of Manipulate and Plot where the independent variable for plotting x, along with its bounds, forms the second argument. Subsequent parameters become Manipulate variables.
ResourceFunction["ManipulatePlot"] takes the options of both Manipulate and Plot.
Both the horizontal and vertical plot ranges are adjustable in the generated plot.

Examples

Basic Examples (1) 

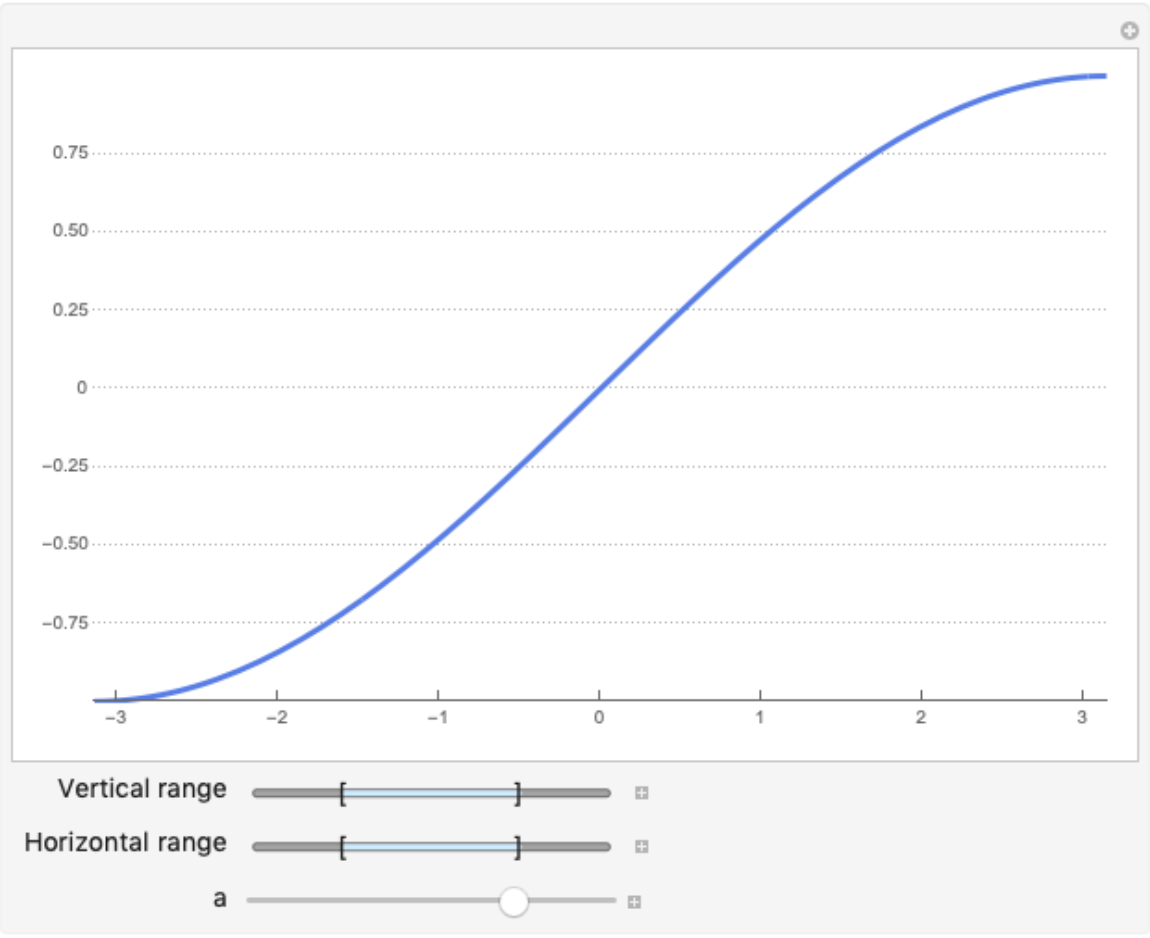
Plot a basic function allowing manipulation of the parameters and plot range:

In[1]:=
ResourceFunction["ManipulatePlot"][
 Sin[a*x], {x, -\[Pi], \[Pi]}, {a, -1, 1}]
Out[1]=

Scope (2) 

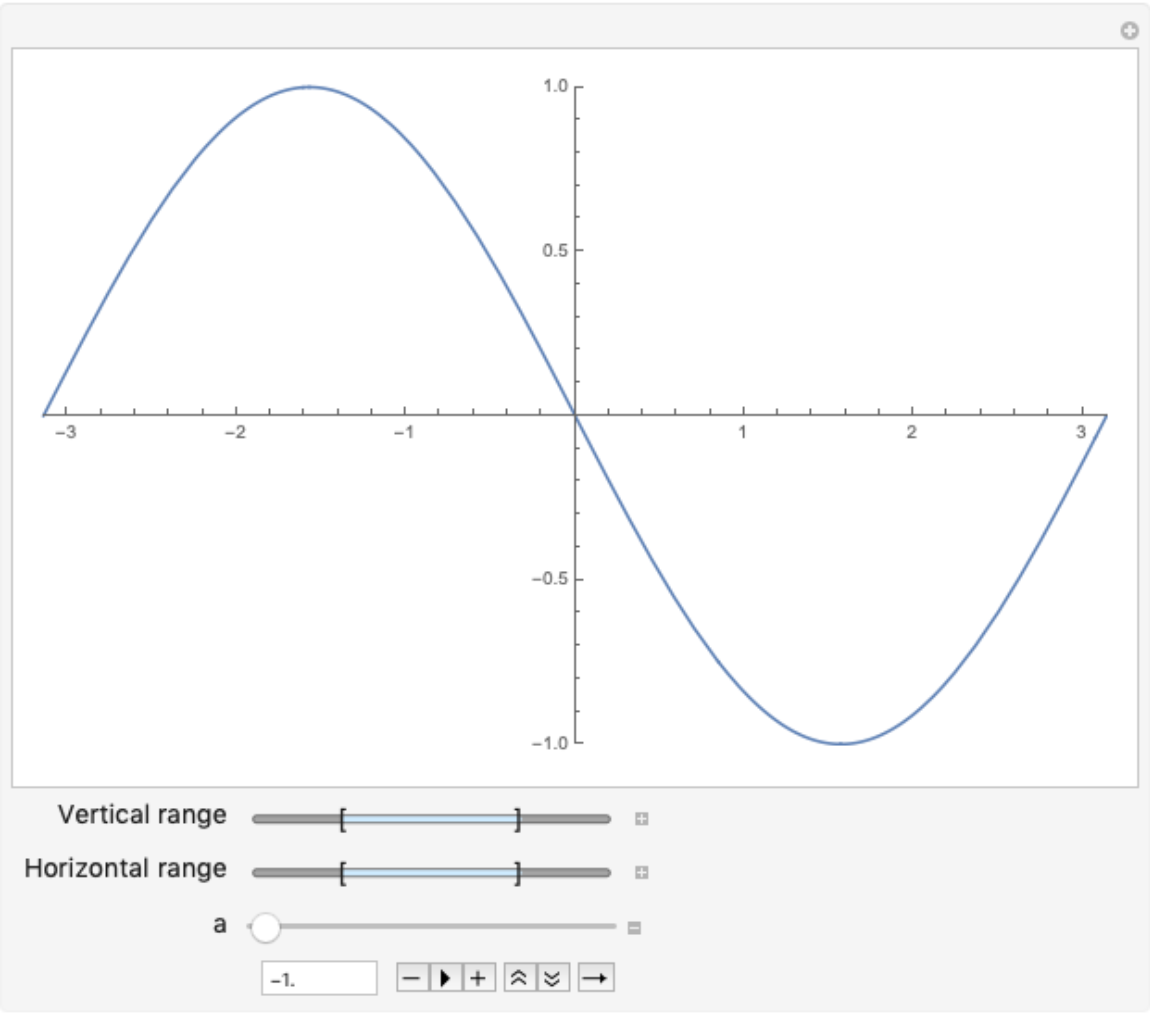
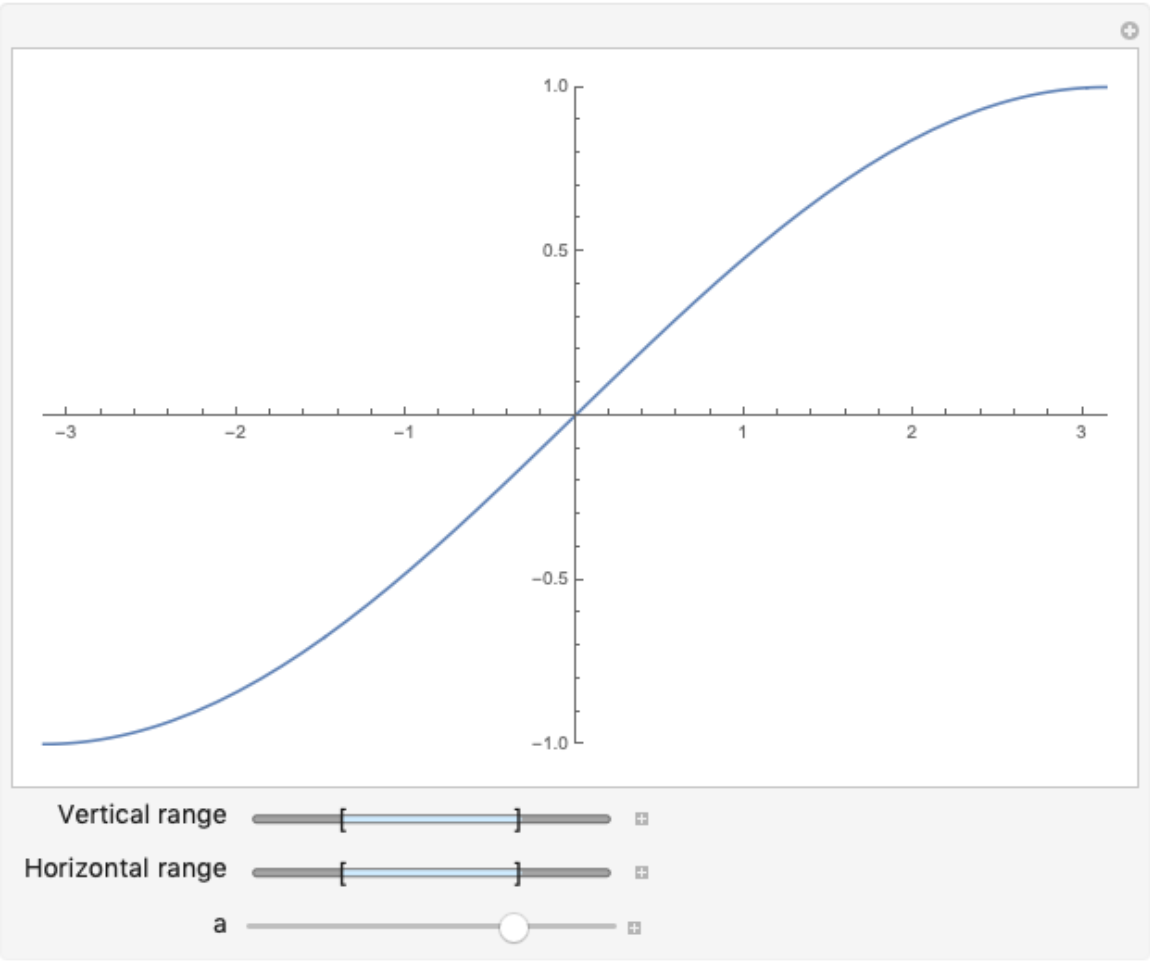
Initialize a parameter using Manipulate syntax:

In[2]:=
ResourceFunction["ManipulatePlot"][
 Sin[a*x], {x, -\[Pi], \[Pi]}, {{a, 1/2}, -1, 1}]
Out[2]=

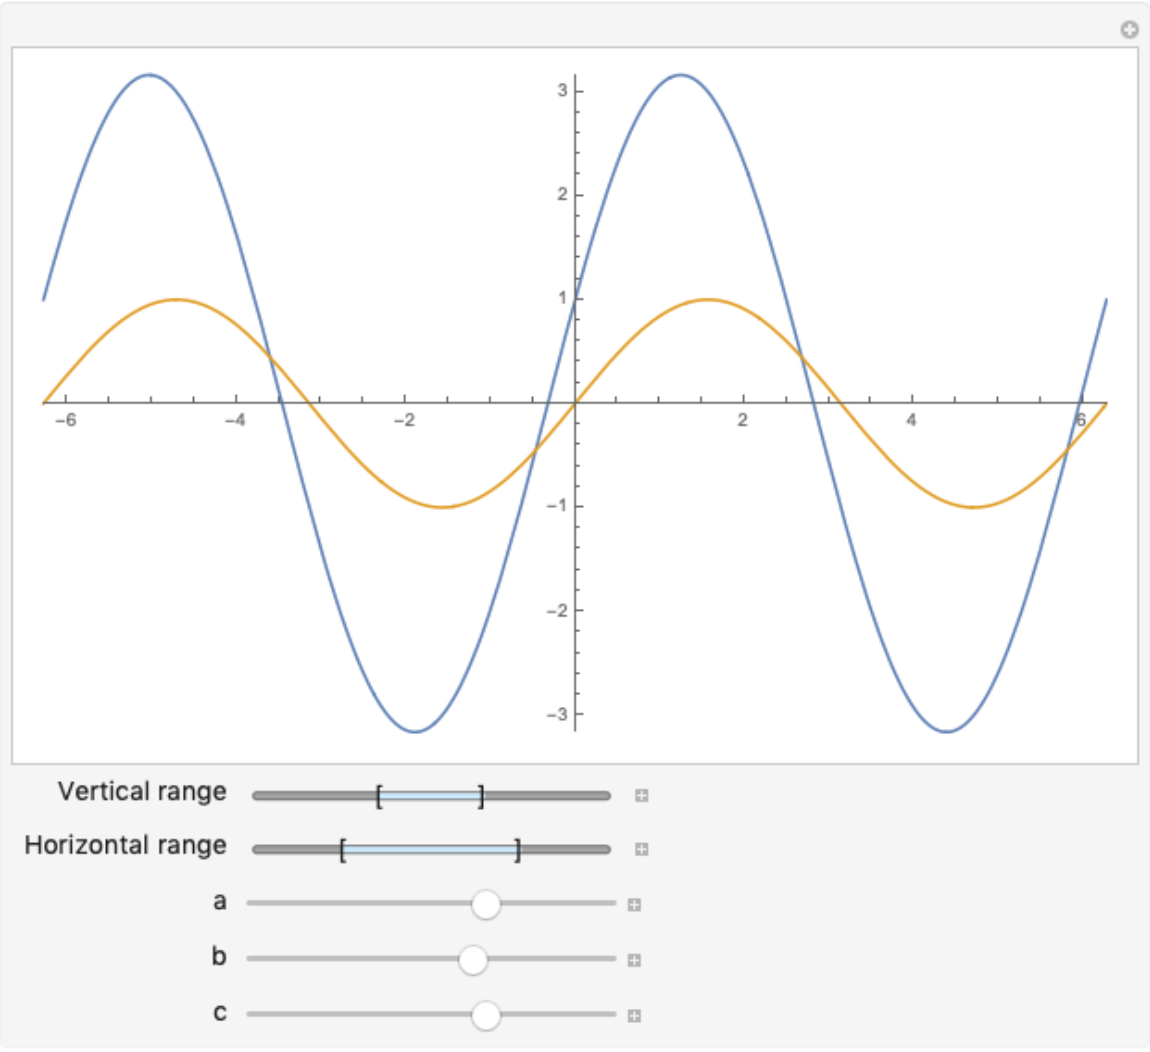
ManipulatePlot can support multiple curves and take many parameters:

In[3]:=
ResourceFunction[
 "ManipulatePlot"][{c Sin[b*x] + a Cos[b*x], Sin[a x]},  {x, -2 Pi, 2 Pi}, {{a, 1}, -1, 2}, {{b, 1}, -4, 4}, {{c, 3}, -1, 5}]
Out[3]=

Options (1) 

ManipulatePlot accepts options for both Plot and Manipulate:

In[4]:=
ResourceFunction["ManipulatePlot"][
 Sin[a*x], {x, -\[Pi], \[Pi]}, {{a, 1/2}, -1, 1}, PlotTheme -> "Business"]
Out[4]=

Publisher

Wolfram|Alpha Math Team

Version History

  • 3.0.0 – 23 March 2023
  • 2.0.1 – 29 September 2021
  • 2.0.0 – 25 June 2020
  • 1.0.0 – 19 March 2020

Related Resources

License Information