Wolfram Function Repository
Instant-use add-on functions for the Wolfram Language
Function Repository Resource:
Produce random causal graphs by sprinkling points into a specified region of a (potentially curved) spacetime
ResourceFunction["CurvedSpacetimeRegionSprinkling"][cond,{x1,…,xm},n] produces a random sprinkling of n points into a (potentially curved) spacetime region that satisfies the conditions cond. | |
ResourceFunction["CurvedSpacetimeRegionSprinkling"][cond,{x1,…,xm},{{xmin,xmax},…},n] produces a random sprinkling of n points into a (potentially curved) spacetime region that satisfies the conditions cond restricted to the bounds {xmin,xmax}×⋯. | |
ResourceFunction["CurvedSpacetimeRegionSprinkling"][cond,{x1,…,xm},n,"prop"] gives the property "prop" for the specified (potentially curved) spacetime region sprinkling. | |
ResourceFunction["CurvedSpacetimeRegionSprinkling"][cond,{x1,…,xm},{{xmin,xmax},…},n,"prop"] gives the property "prop" for the specified (potentially curved) restricted spacetime region sprinkling. |
| "CausalGraphFull" | full causal partial order graph (before transitive reduction) |
| "CausalGraph" | transitively reduced causal partial order graph |
| "Points" | plot of the sprinkled points only (without causal edges) |
| "PointsList" | list of the spacetime coordinates of all sprinkled points |
| "PointsCount" | number of sprinkled points |
| "Dimensions" | number of dimensions in the continuum spacetime approximation |
| "TotalEdgeCount" | total number of causal edges (before transitive reduction) |
| "ReducedEdgeCount" | number of transitively reduced causal edges |
| "PureCausalGraphFull" | full causal partial order graph (before transitive reduction) with vertex coordinate information removed |
| "PureCausalGraph" | transitively reduced causal partial order graph with vertex coordinate information removed |
| "Properties" | list of properties |
Produce a random sprinkling of 100 points into a 1+1-dimensional hyperbolic region of spacetime:
| In[1]:= |
|
| Out[1]= |
|
Show the causal graph:
| In[2]:= |
|
| Out[2]= |
|
Show the full causal graph (without transitive reduction):
| In[3]:= |
|
| Out[3]= |
|
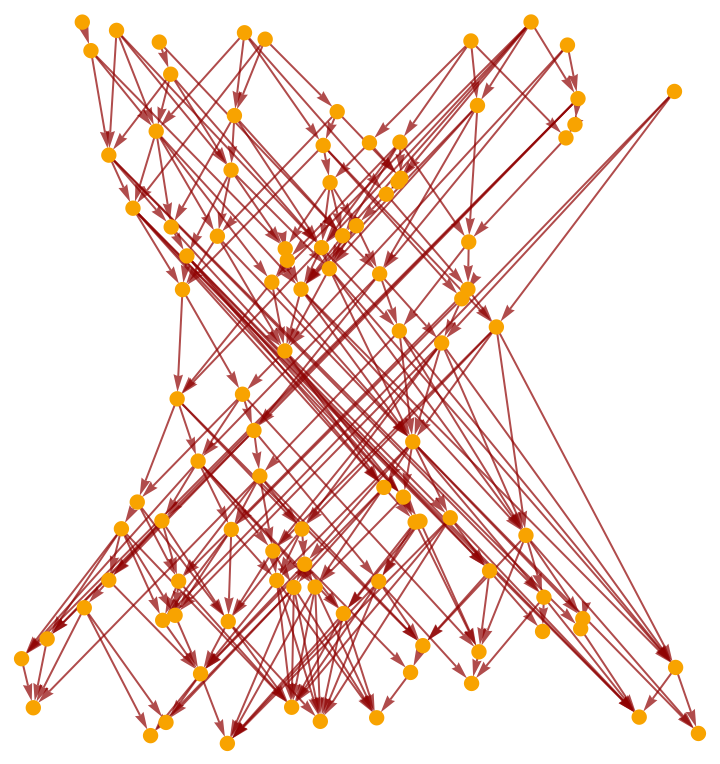
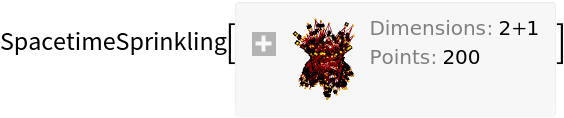
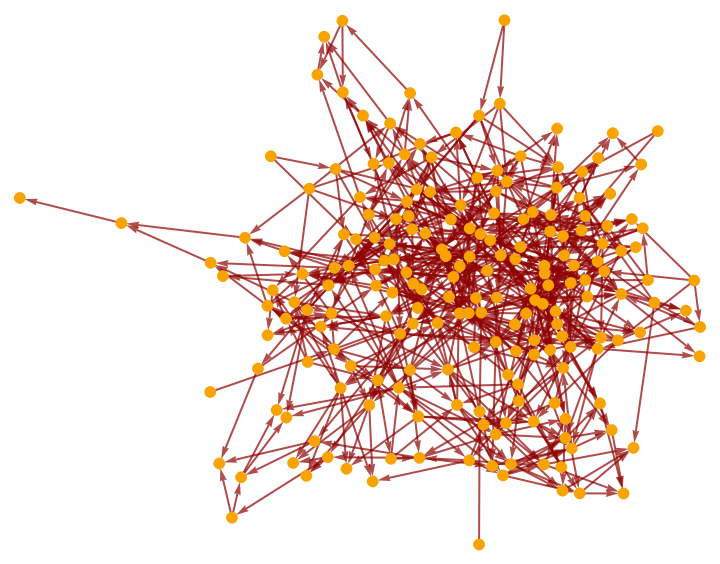
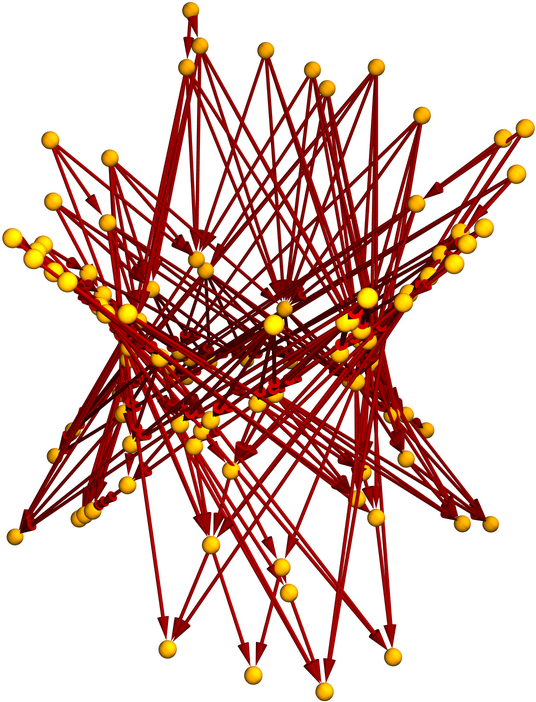
Produce a random sprinkling of 200 points into a 2+1-dimensional hyperboloidal region of spacetime (i.e. de Sitter space):
| In[4]:= |
|
| Out[4]= |
|
Show the causal graph:
| In[5]:= |
|
| Out[5]= |
|
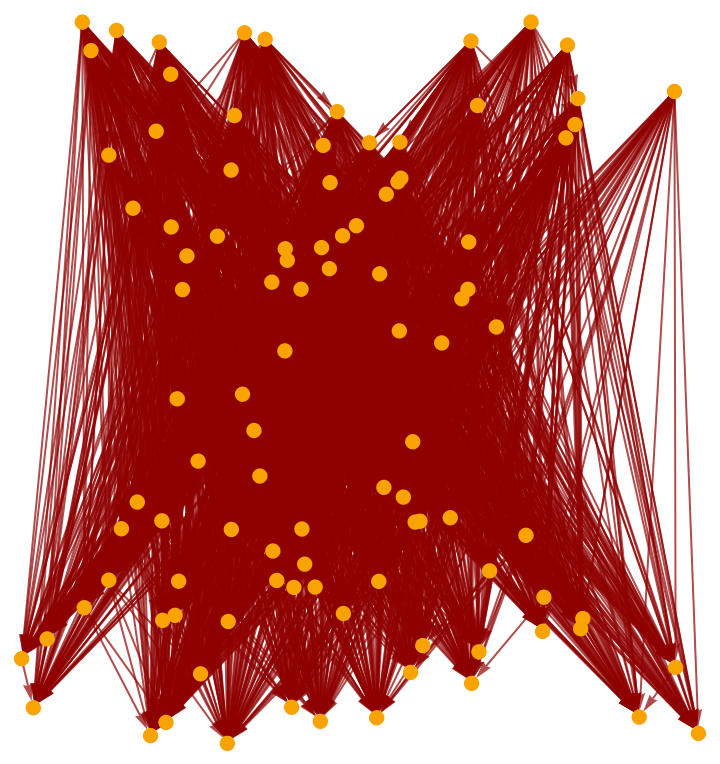
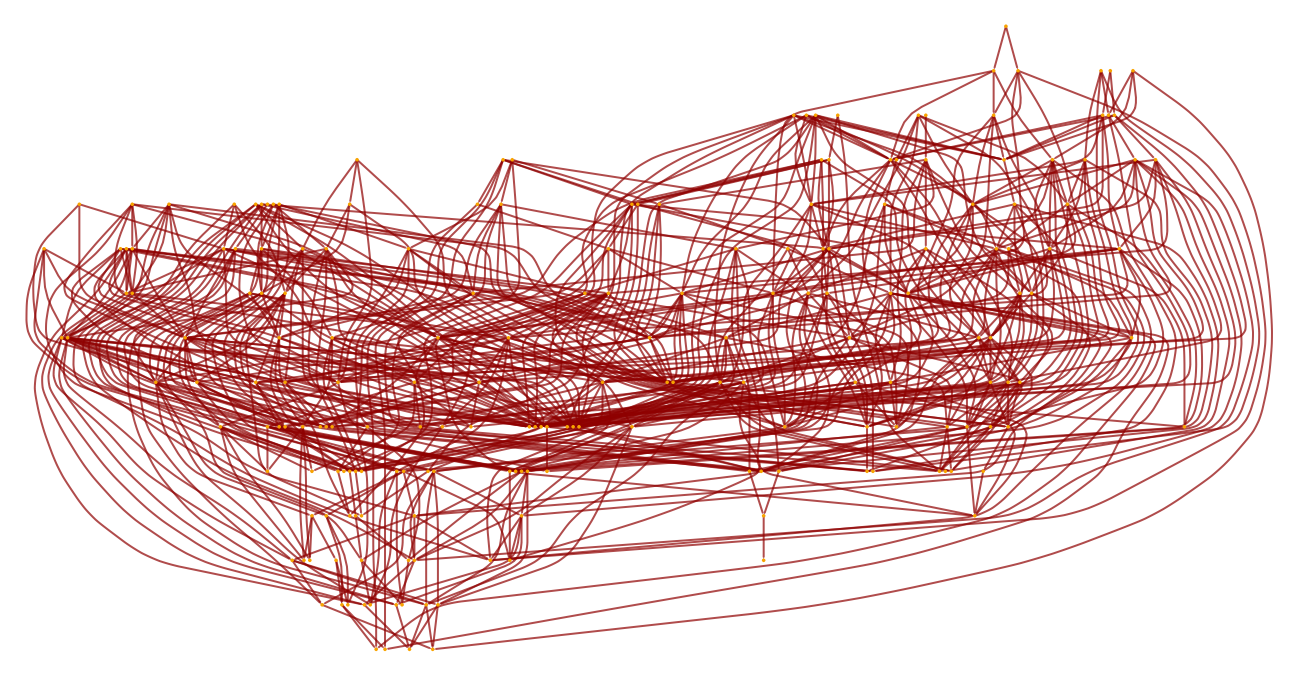
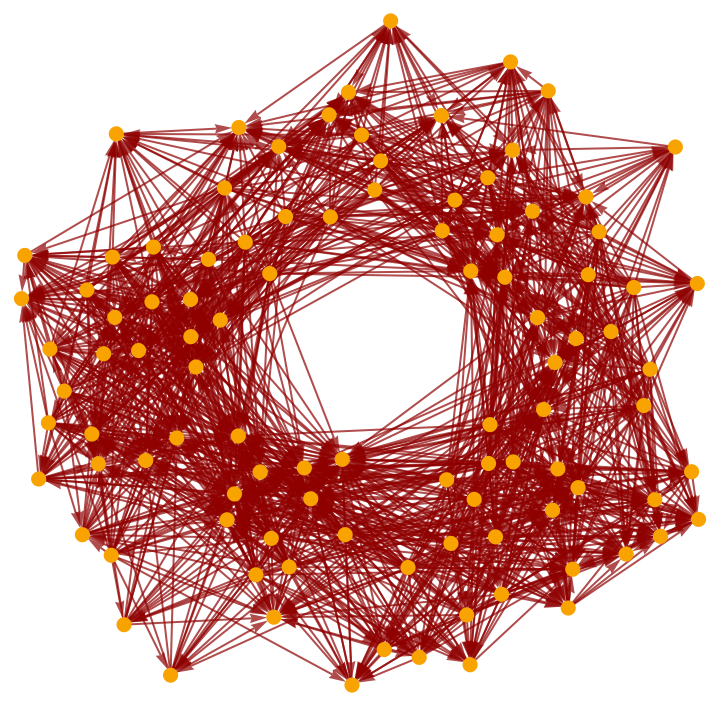
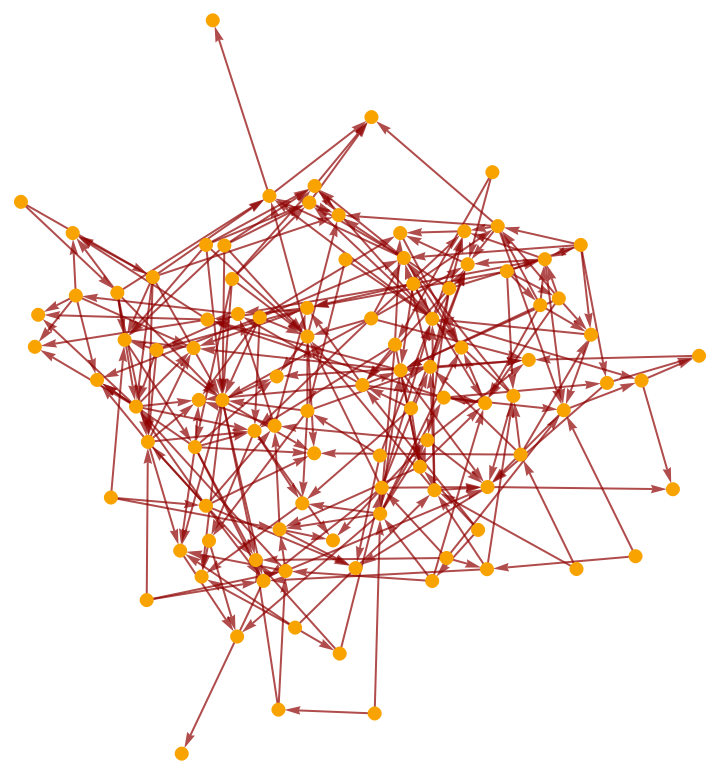
Show the pure causal graph (with vertex coordinate information removed):
| In[6]:= |
|
| Out[6]= |
|
Show the pure causal graph with a layered graph embedding:
| In[7]:= |
|
| Out[7]= |
|
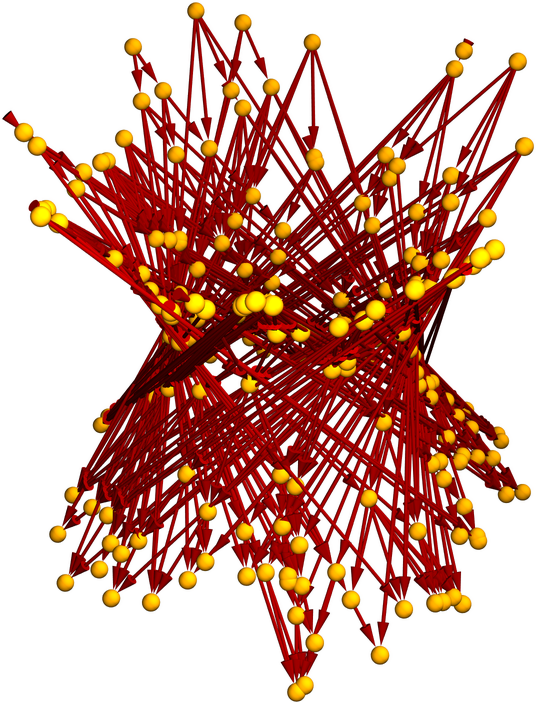
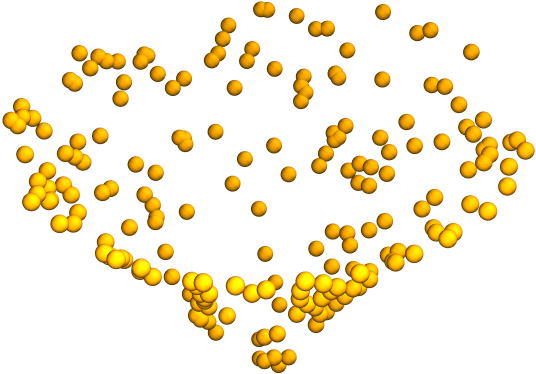
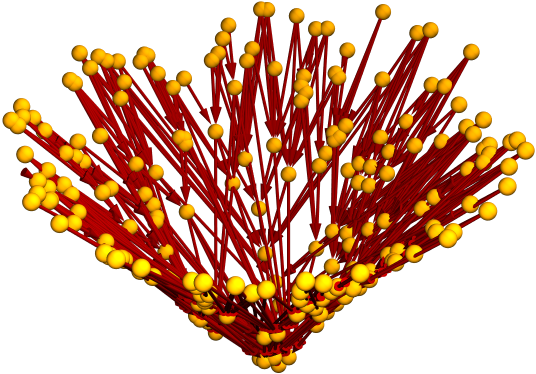
Produce a random sprinkling of 200 points into a 2+1-dimensional paraboloidal region of spacetime based on Flamm's paraboloid (related to the Schwarzschild geometry):
| In[8]:= |
|
| Out[8]= |
|
Plot the positions of the sprinkled points only (without causal edges):
| In[9]:= |
|
| Out[9]= |
|
Show the causal graph:
| In[10]:= |
|
| Out[10]= |
|
By default, the region is restricted to the bounds {{-1,1},…}:
| In[11]:= |
|
| Out[11]= |
|
Show the causal graph:
| In[12]:= |
|
| Out[12]= |
|
Sprinklings can be produced in 0+1-dimensional spacetimes:
| In[13]:= |
|
| Out[13]= |
|
Show the pure causal graph:
| In[14]:= |
|
| Out[14]= |
|
Produce a sprinkling in 1+1-dimensional spacetime:
| In[15]:= |
|
| Out[15]= |
|
Show the causal graph:
| In[16]:= |
|
| Out[16]= |
|
Produce a sprinkling in a 2+1-dimensional spacetime:
| In[17]:= |
|
| Out[17]= |
|
Show the causal graph. Note that, unlike the resource function FlatSpacetimeSprinkling, CurvedSpacetimeRegionSprinkling does not support higher-dimensional sprinklings:
| In[18]:= |
|
| Out[18]= |
|
Properties can be requested directly from CurvedSpacetimeRegionSprinkling:
| In[19]:= |
|
| Out[19]= |
|
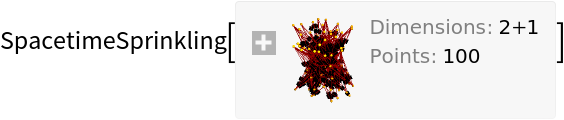
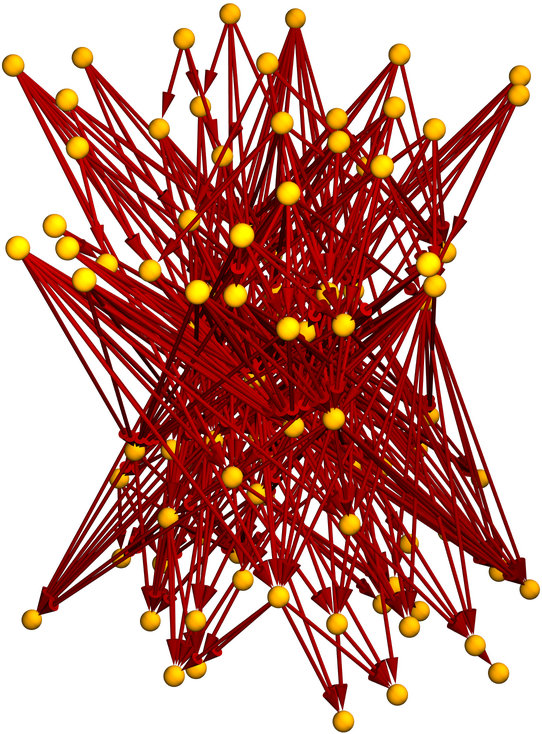
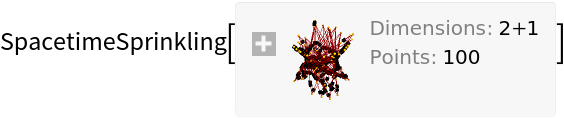
Produce a random sprinkling of 100 points into a 2+1-dimensional hyperboloidal region of spacetime (i.e. de Sitter space):
| In[20]:= |
|
| Out[20]= |
|
Show the complete list of properties:
| In[21]:= |
|
| Out[21]= |
|
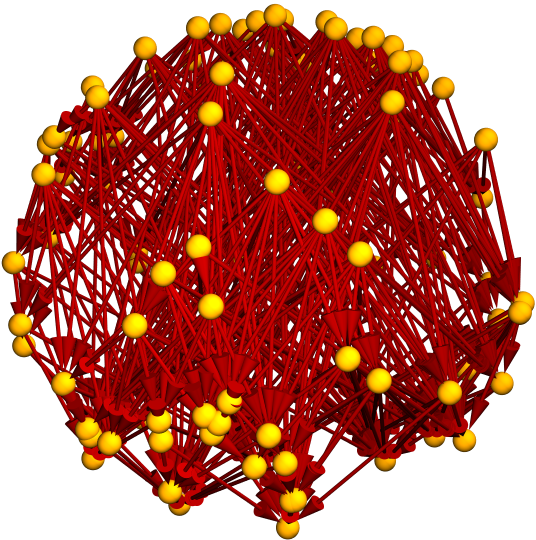
Show the full causal graph:
| In[22]:= |
|
| Out[22]= |
|
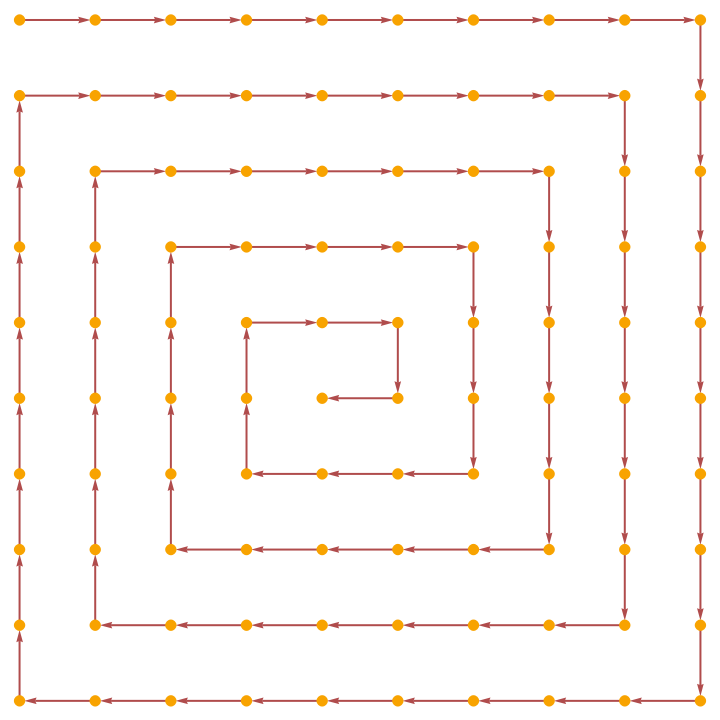
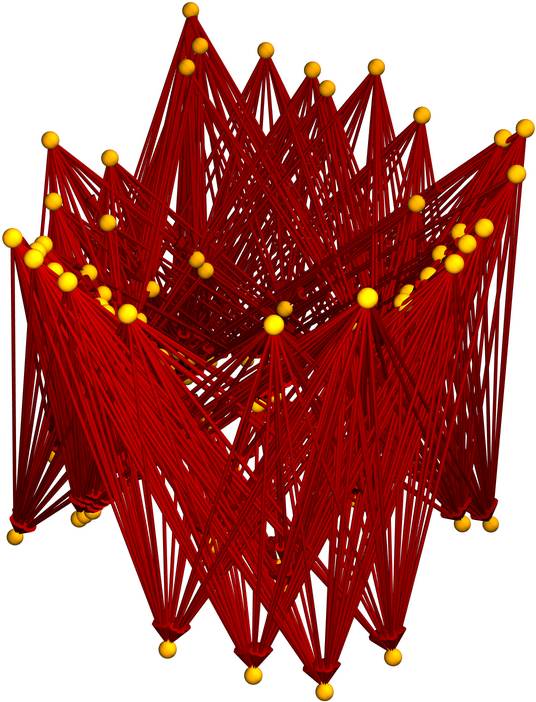
Show the transitively reduced causal graph:
| In[23]:= |
|
| Out[23]= |
|
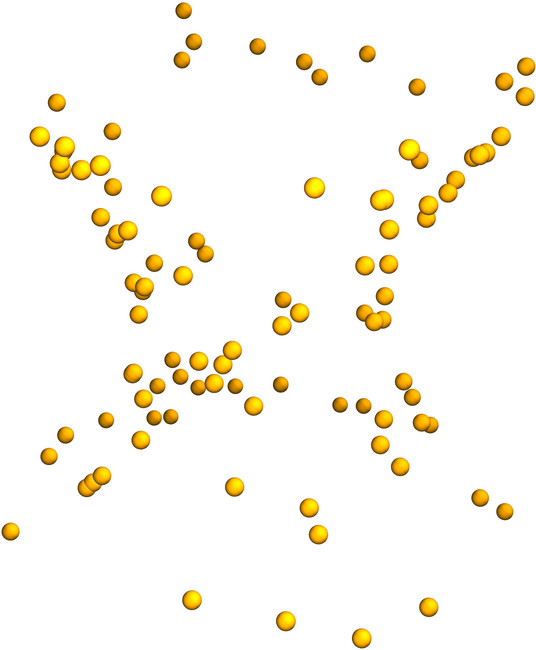
Plot the positions of the sprinkled points only (without causal edges):
| In[24]:= |
|
| Out[24]= |
|
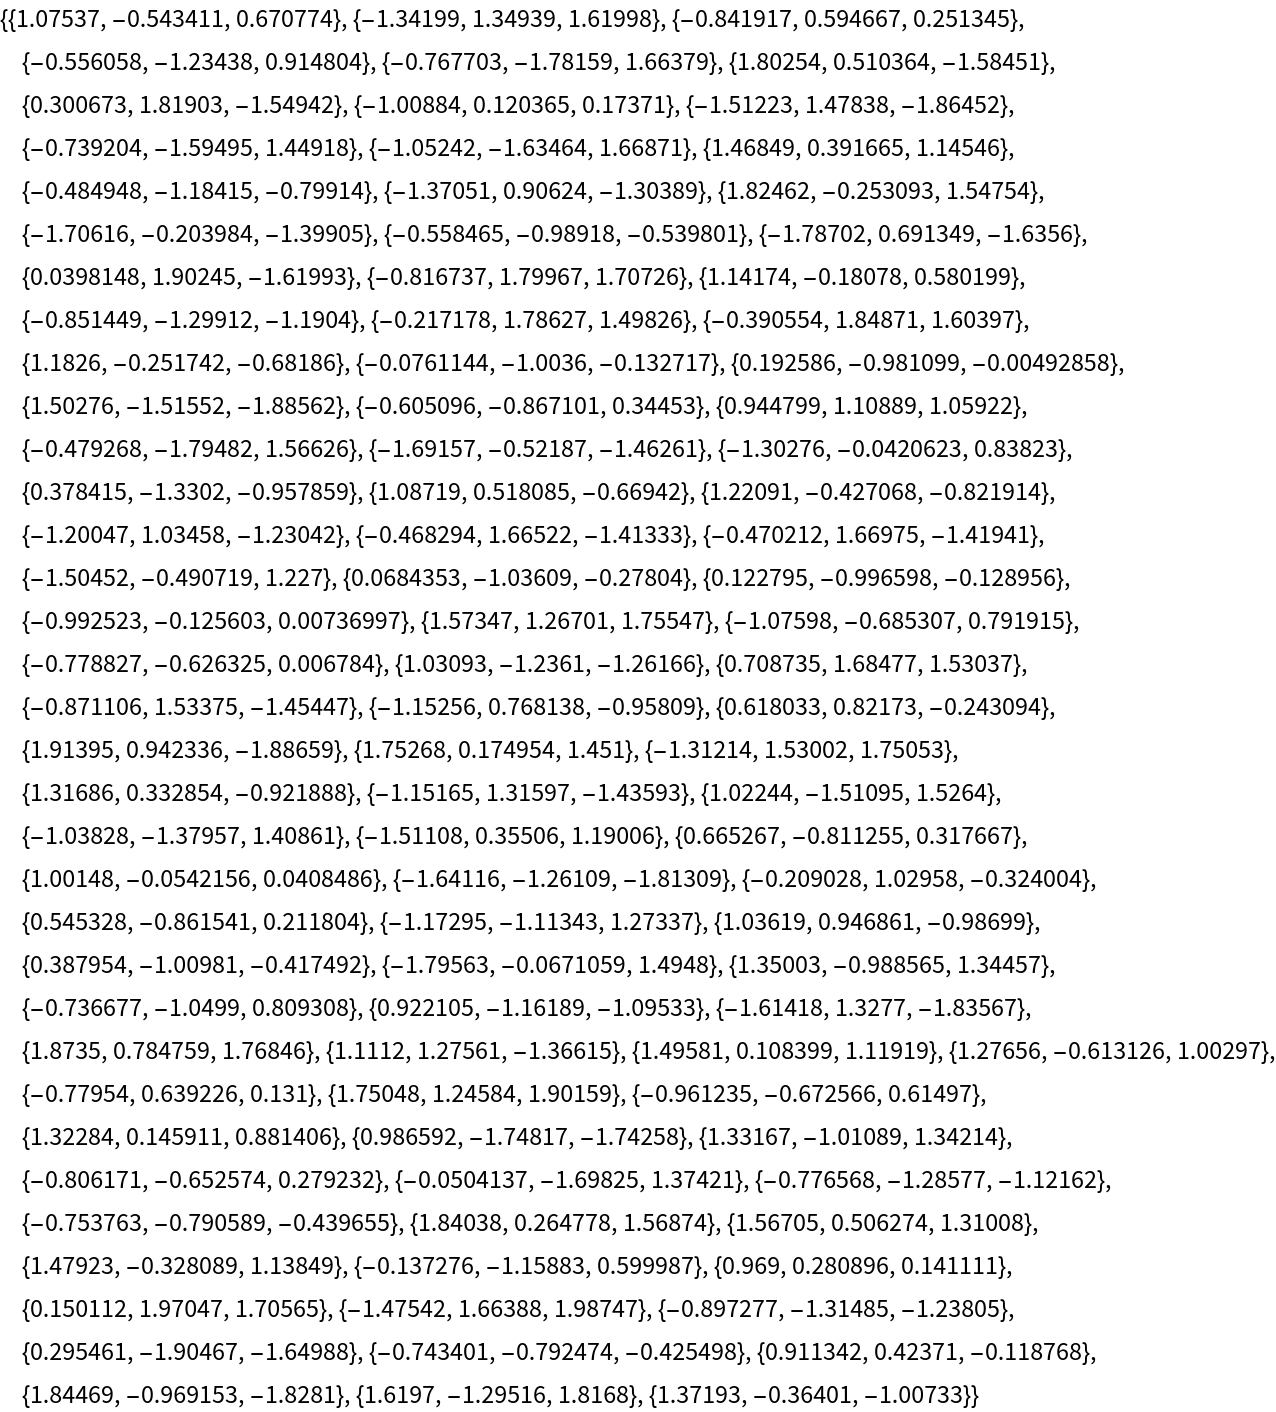
Show a complete list of spacetime coordinates for the sprinkled points:
| In[25]:= |
|
| Out[25]= |
|
Show the number of sprinkled points:
| In[26]:= |
|
| Out[26]= |
|
Show the number of dimensions in the background spacetime:
| In[27]:= |
|
| Out[27]= |
|
Show the total number of causal edges:
| In[28]:= |
|
| Out[28]= |
|
Show the number of causal edges after transitive reduction:
| In[29]:= |
|
| Out[29]= |
|
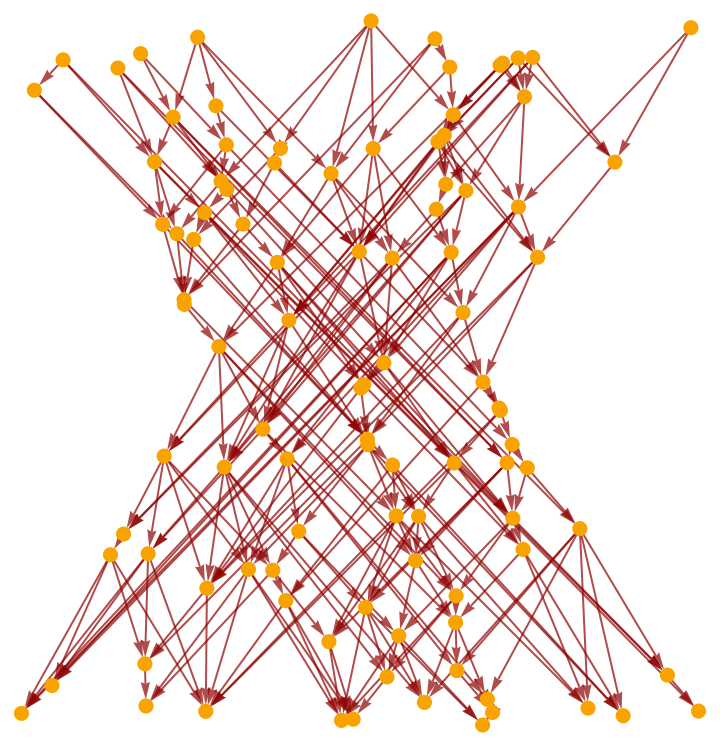
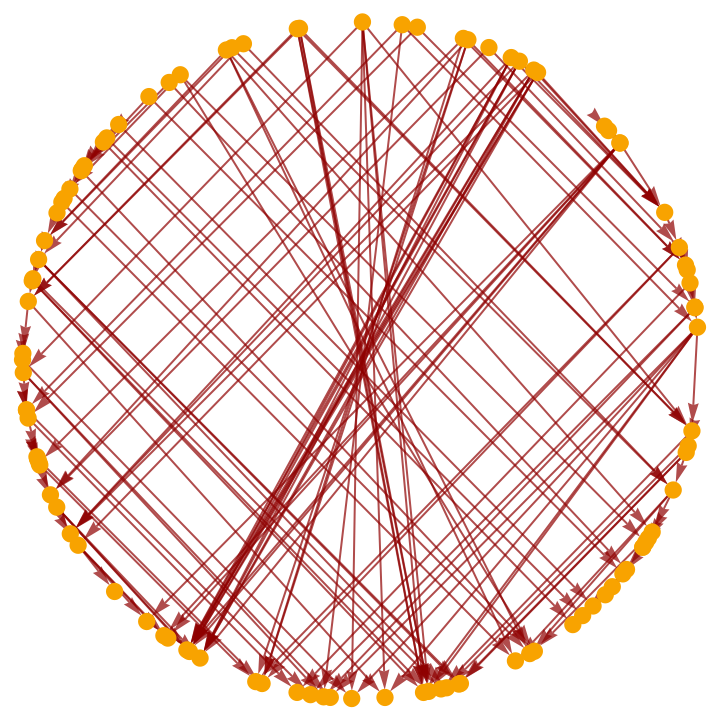
Show the pure full causal graph (with vertex coordinate information removed):
| In[30]:= |
|
| Out[30]= |
|
Show the pure transitively reduced causal graph (with vertex coordinate information removed):
| In[31]:= |
|
| Out[31]= |
|
This work is licensed under a Creative Commons Attribution 4.0 International License